RSS Feeds

Streamlining Security Investigations with Agents
Feed: Engineering at Slack (https://slack.engineering/feed/)
Published: 2025-12-01 16:00:42 | Created: 2026-07-23 05:22:39

Slack’s Security Engineering team is responsible for protecting Slack’s core infrastructure and services. Our security event ingestion pipeline handles billions of events per day from a diverse array of data sources. Reviewing alerts produced by our security detection system is our primary responsibility during on-call shifts.

We’re going to show you how we’re using AI agents to optimize our working efficiency and strengthen Slack’s security defenses. This post is the first in a series that will unpack some of the design choices we’ve made and the many things we’ve learnt along the way.

The Development Process

The Prototype

At the end of May 2025 we had a rudimentary prototype of what would grow into our service. Initially, the service was not much more than a 300 word prompt.

The prompt consisted of five sections:

  • Orientation: “You are a security analyst that investigates security alerts […]”
  • Manifest: “You have access to the following data sources: […]”
  • Methodology: “Your investigation should follow these steps: […] ”
  • Formatting: “Produce a markdown report of the investigation: […]”
  • Classification: “Choose a response classification from: […]”

We implemented a simple “stdio” mode MCP server to safely expose a subset of our data sources through the tool call interface. We repurposed a coding agent CLI as an execution environment for our prototype.

The performance of our prototype implementation was highly variable: sometimes it would produce excellent, insightful results with an impressive ability to cross-reference evidence across different data sources. However, sometimes it would quickly jump to a convenient or spurious conclusion without adequately questioning its own methods. For the tool to be useful, we needed consistent performance. We needed greater control over the investigation process.

We spent some time trying to refine our prompt, stressing the need to question assumptions, to verify data from multiple sources, and to make use of the complete set of data sources. While we did have some success with this approach, ultimately prompts are just guidelines; they’re not an effective method for achieving fine-grained control.

The Solution

Our solution was to break down the complex investigation process we’d described in the prompt of our prototype into a sequence of model invocations, each with a single, well-defined purpose and output structure. These simple tasks are chained together by our application.

Each task was given a structured output format. Structured output is a feature that can be used to restrict a model to using a specific output format defined by a JSON schema. The schema is applied to the last output from the model invocation. Using structured outputs isn’t “free”; if the output format is too complicated for the model, the execution can fail. Structured outputs are also subject to the usual problems of cheating and hallucination.

In our initial prototype, we included guidance to “question your evidence”, but had mixed success. With our structured output approach, that guidance had become a separate task in our investigation flow with much more predictable behavior.

This approach gave us more precise control at each step of the investigation process.

From Prototype to Production

While reviewing the literature, two papers particularly influenced our thinking:

These papers describe prompting techniques that introduce multiple personas in the context of a single model invocation. The idea of modelling the investigation using defined personas was intriguing, but in order to maintain control we needed to represent our personas as independent model invocations. Security tabletop exercises, and how we might adapt their conventions to our application, were also a major source of inspiration during the design process.

Our chosen design is built around a team of personas (agents) and the tasks they can perform in the investigation process. Each agent/task pair is modelled with a carefully defined structured output, and our application orchestrates the model invocations, propagating just the right context at each stage.

Investigation Loop
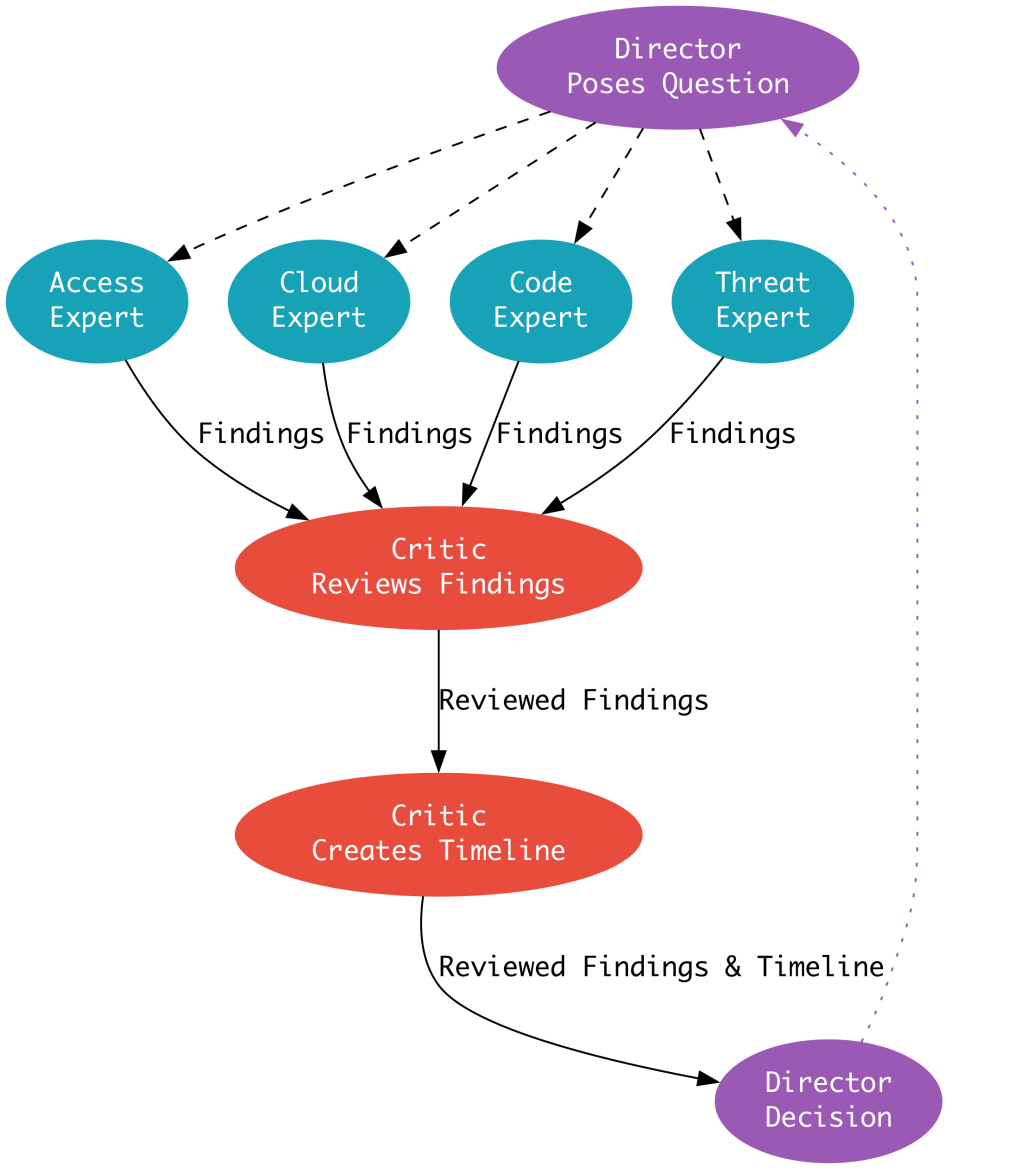
Flow diagram illustrating how agents cooperate during security investigations
The Director agent poses a question and domain expert agents respond, generating findings. The Critic agent reviews findings for quality and assembles a timeline using the most credible. The Director uses the high-quality findings and timeline to determine how to progress the investigation.

Our design has three defined persona categories:

Director Agent

The Investigation Director. The Director’s responsibility is to progress the investigation from start to finish. The Director interrogates the experts by forming a question, or set of questions, which become the expert’s prompt. The Director uses a journaling tool for planning and organizing the investigation as it progresses.

Expert Agent

A domain expert. Each domain expert has a unique set of domain knowledge and data sources. The experts’ responsibility is to produce findings from their data sources in response to the Director’s questions.

We currently have four experts in our team:

    • Access: Authentication, authorization and perimeter services.
    • Cloud: Infrastructure, compute, orchestration, and networking.
    • Code: Analysis of source code and configuration management.
    • Threat: Threat analysis and intelligence data sources.

Critic Agent

The Critic is a “meta-expert”. The Critic’s responsibility is to assess and quantify the quality of findings made by domain experts using a rubric we’ve defined. The Critic annotates the experts’ findings with its own analysis and a credibility score for each finding. The Critic’s conclusions are passed back to the Director, closing the loop. The weakly adversarial relationship between the Critic and the expert group helps to mitigate against hallucinations and variability in the interpretation of evidence.

Because each agent/task pair is a separate model invocation we can vary all of the inputs, including the model version, output format, prompts, instructions, and tools. One of many ways we’re using this capability is to create a “knowledge pyramid”.

Knowledge Pyramid
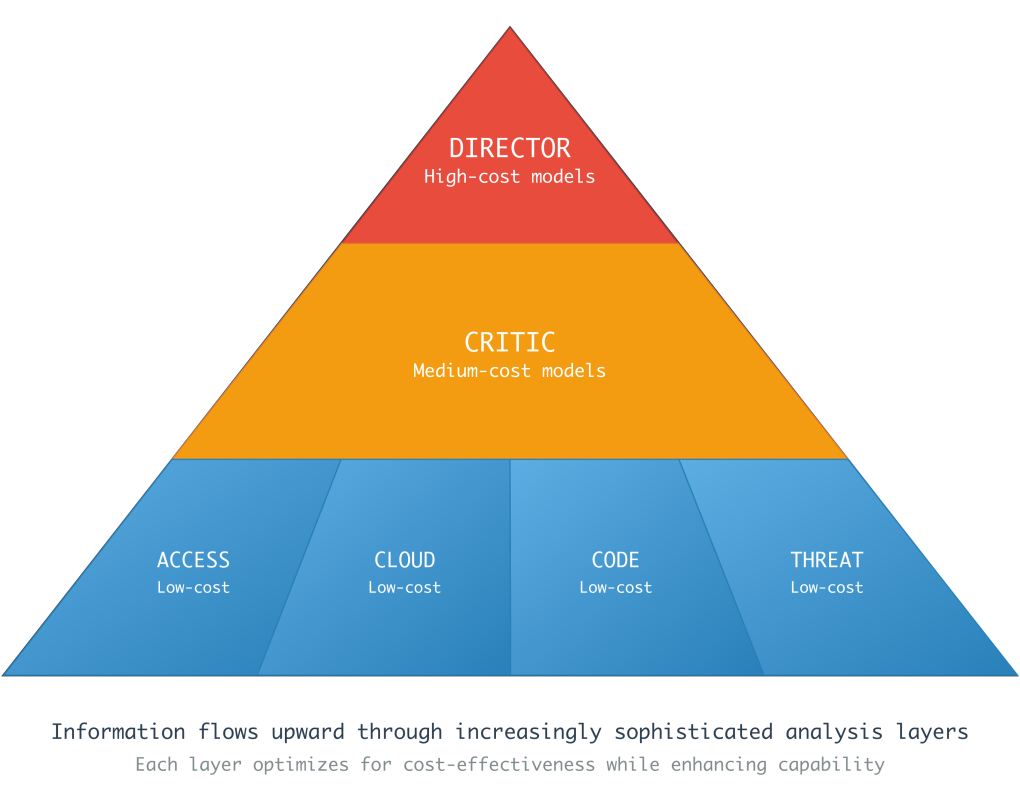
Pyramid diagram illustrating how investigation knowledge flows up from low to high cost models.

At the bottom of the knowledge pyramid, domain experts generate investigation findings by interrogating complex data sources, requiring many tool calls. Analyzing the returned data can be very token-intensive. Next, the Critic’s review identifies the most interesting findings from that set. During the review process the Critic inspects the experts’ claims and the tool calls and tool results used to support them, which also incurs a significant token overhead. Once the Critic has completed its review, it assembles an up to date investigation timeline, integrating the running investigation timeline and newly gathered findings into a coherent narrative. The condensed timeline, consisting only of the most credible findings, is then passed back to the Director. This design allows us to strategically use low, medium, and high-cost models for the expert, critic, and director functions, respectively.

Investigation Flow

The investigation process is broken into several phases. Phases allow us to vary the structure of the investigation loop as the investigation proceeds. At the moment, we have three phases, but it is simple to add more. The Director persona is responsible for advancing the phase.
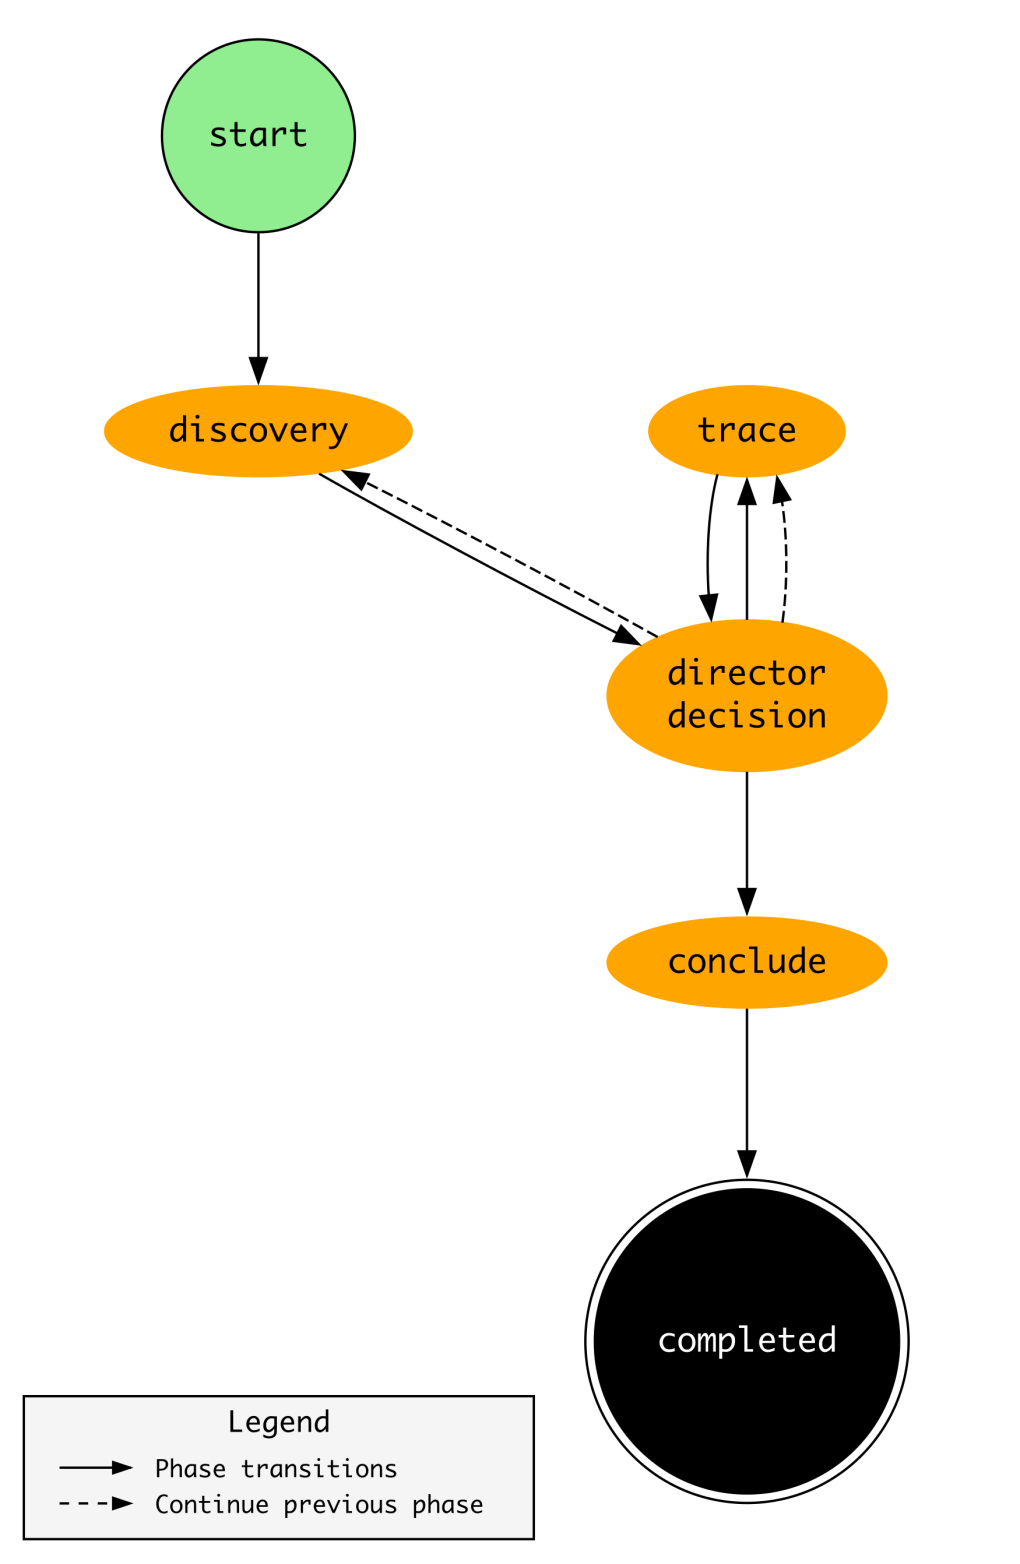
Flow diagram illustrating how the Director progresses the investigation through distinct phases.
Investigations begin in the discovery phase. After each round of investigation the Director decides whether to remain in the current phase or to progress to a new phase.

Discovery

The first phase of each investigation. The goal in the discovery phase is to ensure that every available data source is examined. The Director reviews the state of the investigation and generates a question that is broadcast to the entire expert team.

Director Decision

A “meta-phase” in which the Director decides whether to advance to the next investigation phase or continue in the current one. The task’s prompt includes advice on when to advance to each phase.

Trace

Once the discovery phase has made clear which experts are able to produce relevant findings, the Director transitions the investigation to the trace phase. In the trace phase, the Director chooses a specific expert to question. We also have the flexibility to vary the model invocation parameters by phase, allowing us to use a different model or enhanced token budget.

Conclude

The Director transitions the investigation to the concluding phase when sufficient information has been gathered to produce the final report.

Service Architecture

Our prototype used a coding agent CLI as an execution harness, but that wasn’t suitable for a practical implementation. We needed an interface that would let us observe investigations occurring in realtime, view and share past investigations, and launch ad-hoc investigations. Critically, we needed a way of integrating the system into our existing stack, allowing investigations to be triggered by our existing detection tools. The service architecture we created does all of these things and is quite simple.

Hub

The hub provides the service API and an interface to persistent storage. Besides the usual CRUD-like API, the hub also provides a metrics endpoint so we can visualise system activity, token usage, and manage cost.

Worker

Investigation workers pick up queued investigation tasks from the API. Investigations produce an event stream which is streamed back to the hub through the API. Workers can be scaled to increase throughput as needed.

Dashboard

The Dashboard is used by staff to interact with the service. Running investigations can be observed in real-time, consuming the event stream from the hub. Additionally the dashboard provides management tools, letting us view the details of each model invocation. This capability is invaluable when debugging the system.

Example Report

We’ve included an edited investigation report which demonstrates the potential of the agents to exhibit novel emergent behavior. In this case, the original alert was raised for a specific command sequence, which we analyze because it can be an indicator of compromise. In the course of investigating the alert, the agents independently discovered a separate credential exposure elsewhere in the process ancestry.
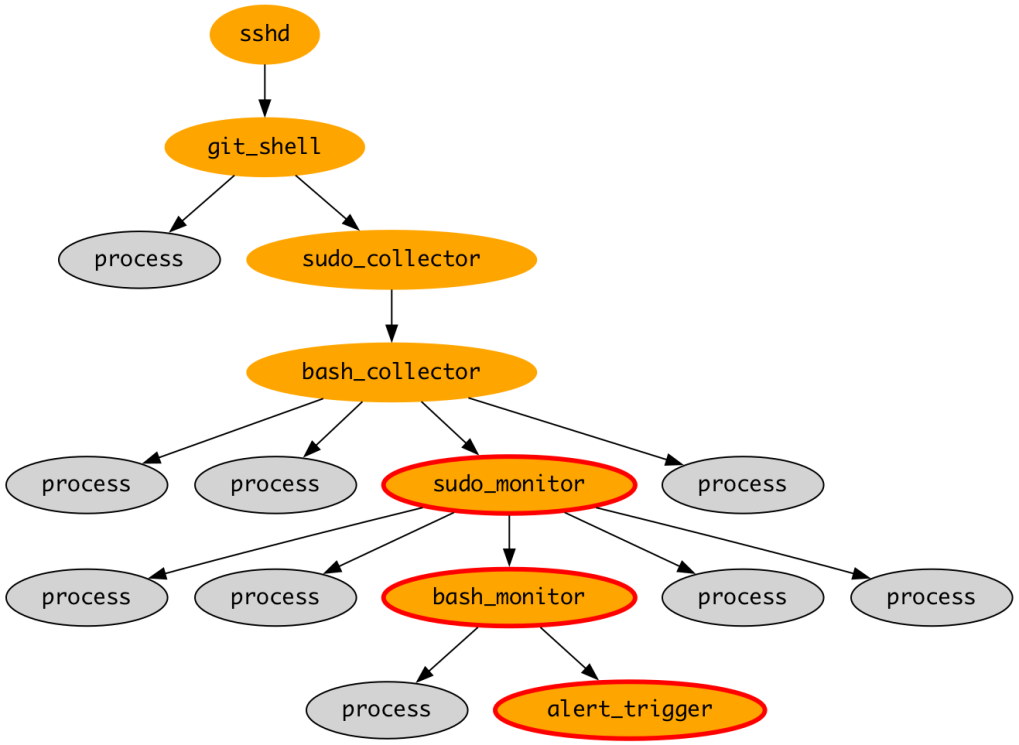
Tree diagram illustrating how agents navigated the process tree.
The highlighted leaf process triggered the investigation, but the agents traced the process hierarchy and discovered a different issue in an ancestor process.

The text below is a lightly edited version of the report summary from this investigation.


Investigation Report: Credential Exposure in Monitoring Workflow [ESCALATE]

Summary: While investigating [command sequence], the investigation uncovered a credential exposure elsewhere in the process ancestry chain.

Analysis

The investigation confirmed that the command execution on [TIMESTAMP] was part of a legitimate monitoring workflow using [diagnostic tool]. The process ancestry shows the expected execution chain. However, critical security concerns were identified:

  1. Credential Exposure: A credential was exposed in process command line parameters within the ancestry chain, creating significant security risk.
  2. Expert-Critic Contradiction: The expert incorrectly assessed credential handling as secure while the critic correctly identified exposed credentials, indicating analysis blind spots that require attention.

What is notable about this result is that the expert did not raise the credential exposure in its findings; the Critic noticed it as part of its meta-analysis of the expert’s work. The Director then chose to pivot the investigation to focus on this issue instead. In the report, the Director highlights both the need to mitigate the security issue, and to follow-up on the expert’s failure to properly identify the risk. We referred the credential exposure to the service owning team to resolve.

Conclusion

We’re still at an early phase of our journey to streamline security investigations using AI agents, but we’re starting to see meaningful benefits. Our web-based dashboard allows us to launch and watch investigations in real time, and investigations yield interactive, verifiable reports that show how evidence was collected, interpreted, and judged. During our on-call shifts, we’re switching to supervising investigation teams, rather than doing the laborious work of gathering evidence. Unlike static detection rules, our agents often make spontaneous and unprompted discoveries, as we demonstrated in our example report. We’ve seen this occur many times, from highlighting weakness in IAM policies, to identifying problematic code and more.

There’s a great deal more to say. We look forward to sharing more details of how our system works in future blog posts. As a preview of some future content from the series:

  • Maintaining alignment and orientation during multi-persona investigations
  • Using artifacts as a communication channel between investigation participants
  • Human in the loop: human / agent collaboration in security investigations

Acknowledgements

We wanted to give a shout out to all the people that have contributed to this journey: 

  • Chris Smith
  • Abhi Rathod
  • Dave Russell
  • Nate Reeves


Interested in taking on interesting projects, making people’s work lives easier, or just building some pretty cool forms? We’re hiring!

Apply now


show more
How Slack Rebuilt Notifications 📣
Feed: Engineering at Slack (https://slack.engineering/feed/)
Published: 2026-03-19 19:00:54 | Created: 2026-07-23 05:22:39

Introduction  

At Slack, notifications are how teams stay in the loop, but they can also become overwhelming when not designed with intention. Our goal was to make staying informed feel effortless. We set out to rebuild one of Slack’s most complicated systems from the ground up by bringing calm, consistency, and clarity to the experience.

Diagnosing the Noise Problem

We knew perception of noise in Slack was a universal challenge affecting teams everywhere. Across workspaces, notification overload consistently ranks among the most common frustrations. Research showed that the more channels a person joins, the more likely they are to feel overwhelmed and confused about notification behavior.

Internally, the data told a clear story. Issues with notifications are one of the top three drivers of Customer Experience tickets, with users often unsure how to control or understand their settings.

The noise problem wasn’t just about volume—it was baked into the architecture itself. Our legacy notification system evolved over years, accumulating complexity that made it nearly impossible for users to understand or control.

Four conflicting mental models: Desktop and mobile each had their own preference systems, with different options and behaviors. A “nothing” setting on mobile meant something entirely different from “Off” on desktop. Users couldn’t predict what would happen when they changed a setting.

Hidden coupling between preferences: What users were notified about was tightly coupled with how they received notifications. Wanting fewer push notifications meant sacrificing in-app awareness entirely—there was no way to separate the two.

Inconsistent state across clients: Settings didn’t reliably sync. Users would configure notifications on desktop only to find mobile behaving completely differently, leading to confusion and duplicate configuration work.

Power users left behind: Advanced controls were scattered across multiple menus with no clear hierarchy. Features like “badge all unreads” on mobile were hidden, and there was no unified place to understand all your notification options.

These architectural problems directly contributed to the noise users experienced—not just because notifications were frequent, but because users couldn’t confidently control them.

Simplifying Notifications at Scale  

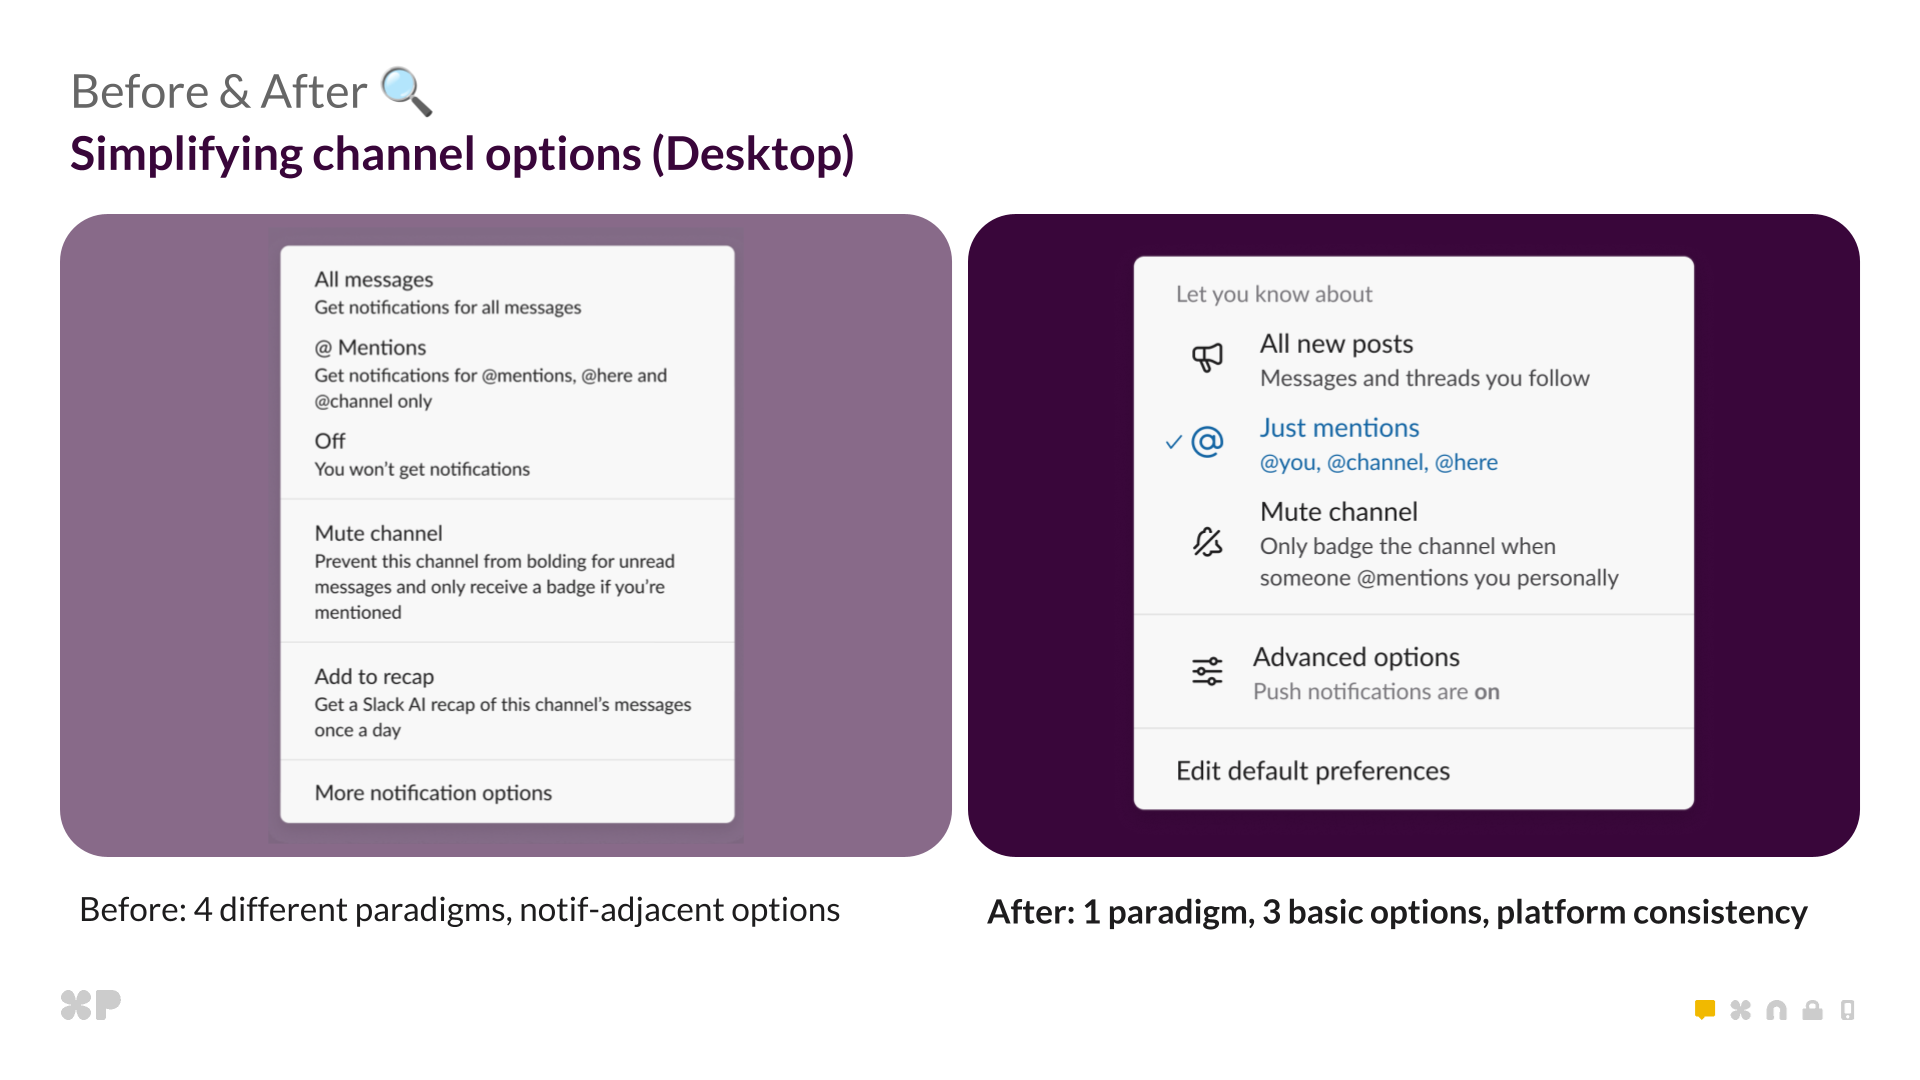
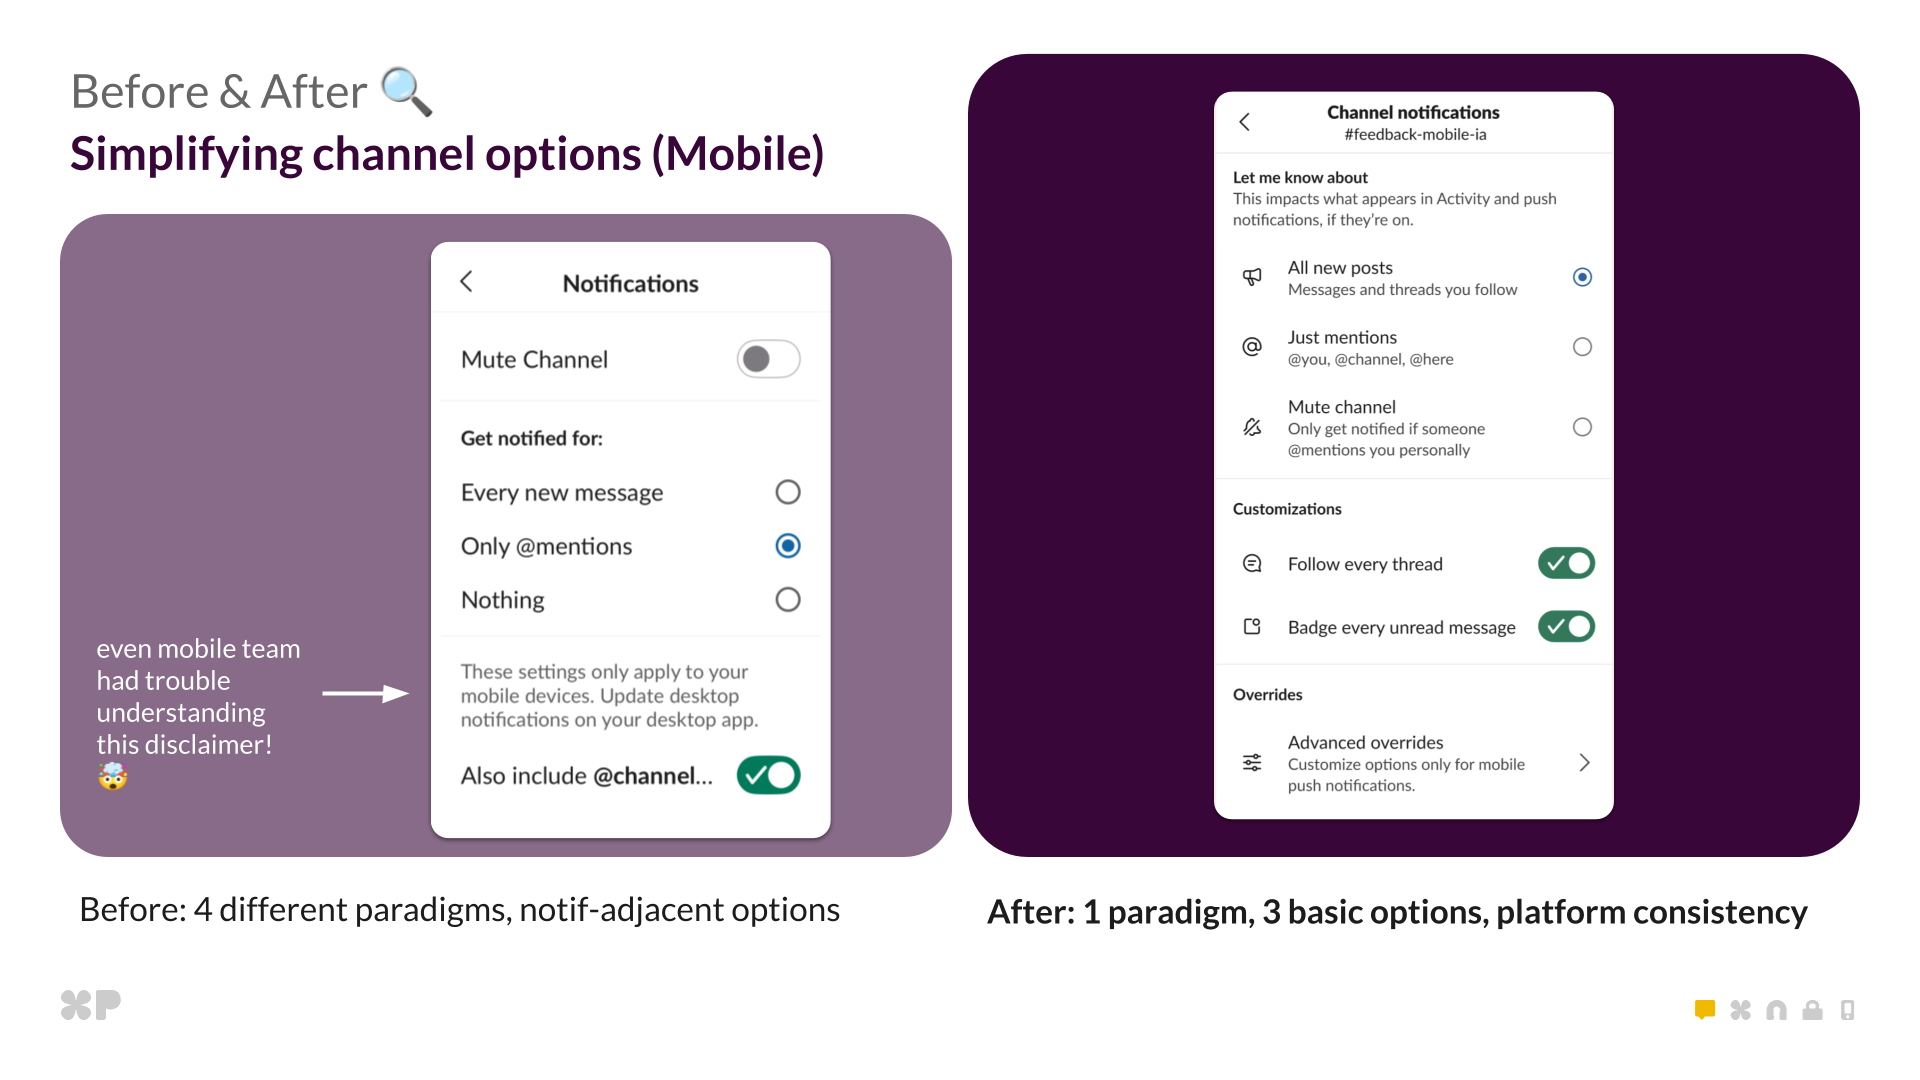
We didn’t just refactor the notifications UI. We completely redesigned how notifications behave across Slack. This project supported a number of notifications improvements to comprehensively address user pain points and confusion:

  • Simpler choices: Channel notifications now have three clear options: All new posts, Mentions, or Mute.
  • Push toggles: Unified on/off options for push notifications across desktop and mobile.
  • Advanced controls: Redesigned settings for power users, including “badge all unreads” on mobile.
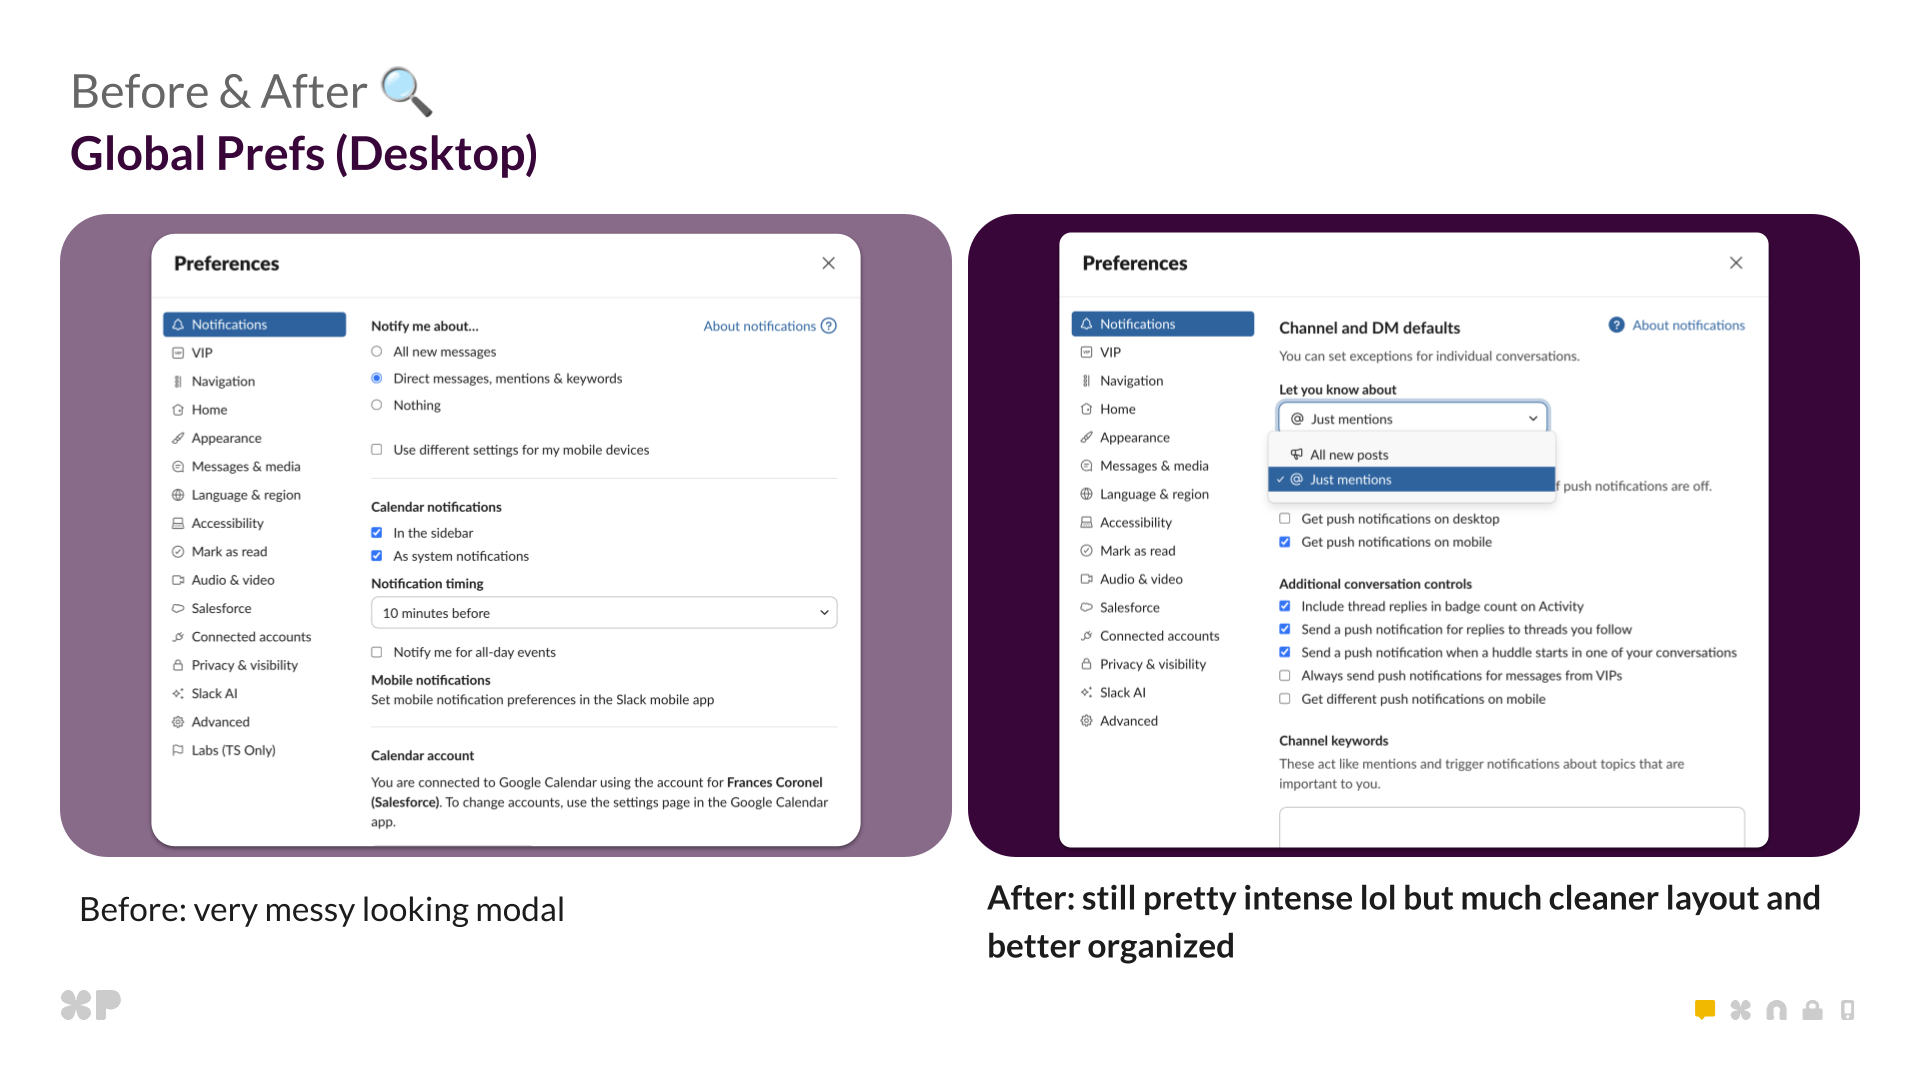
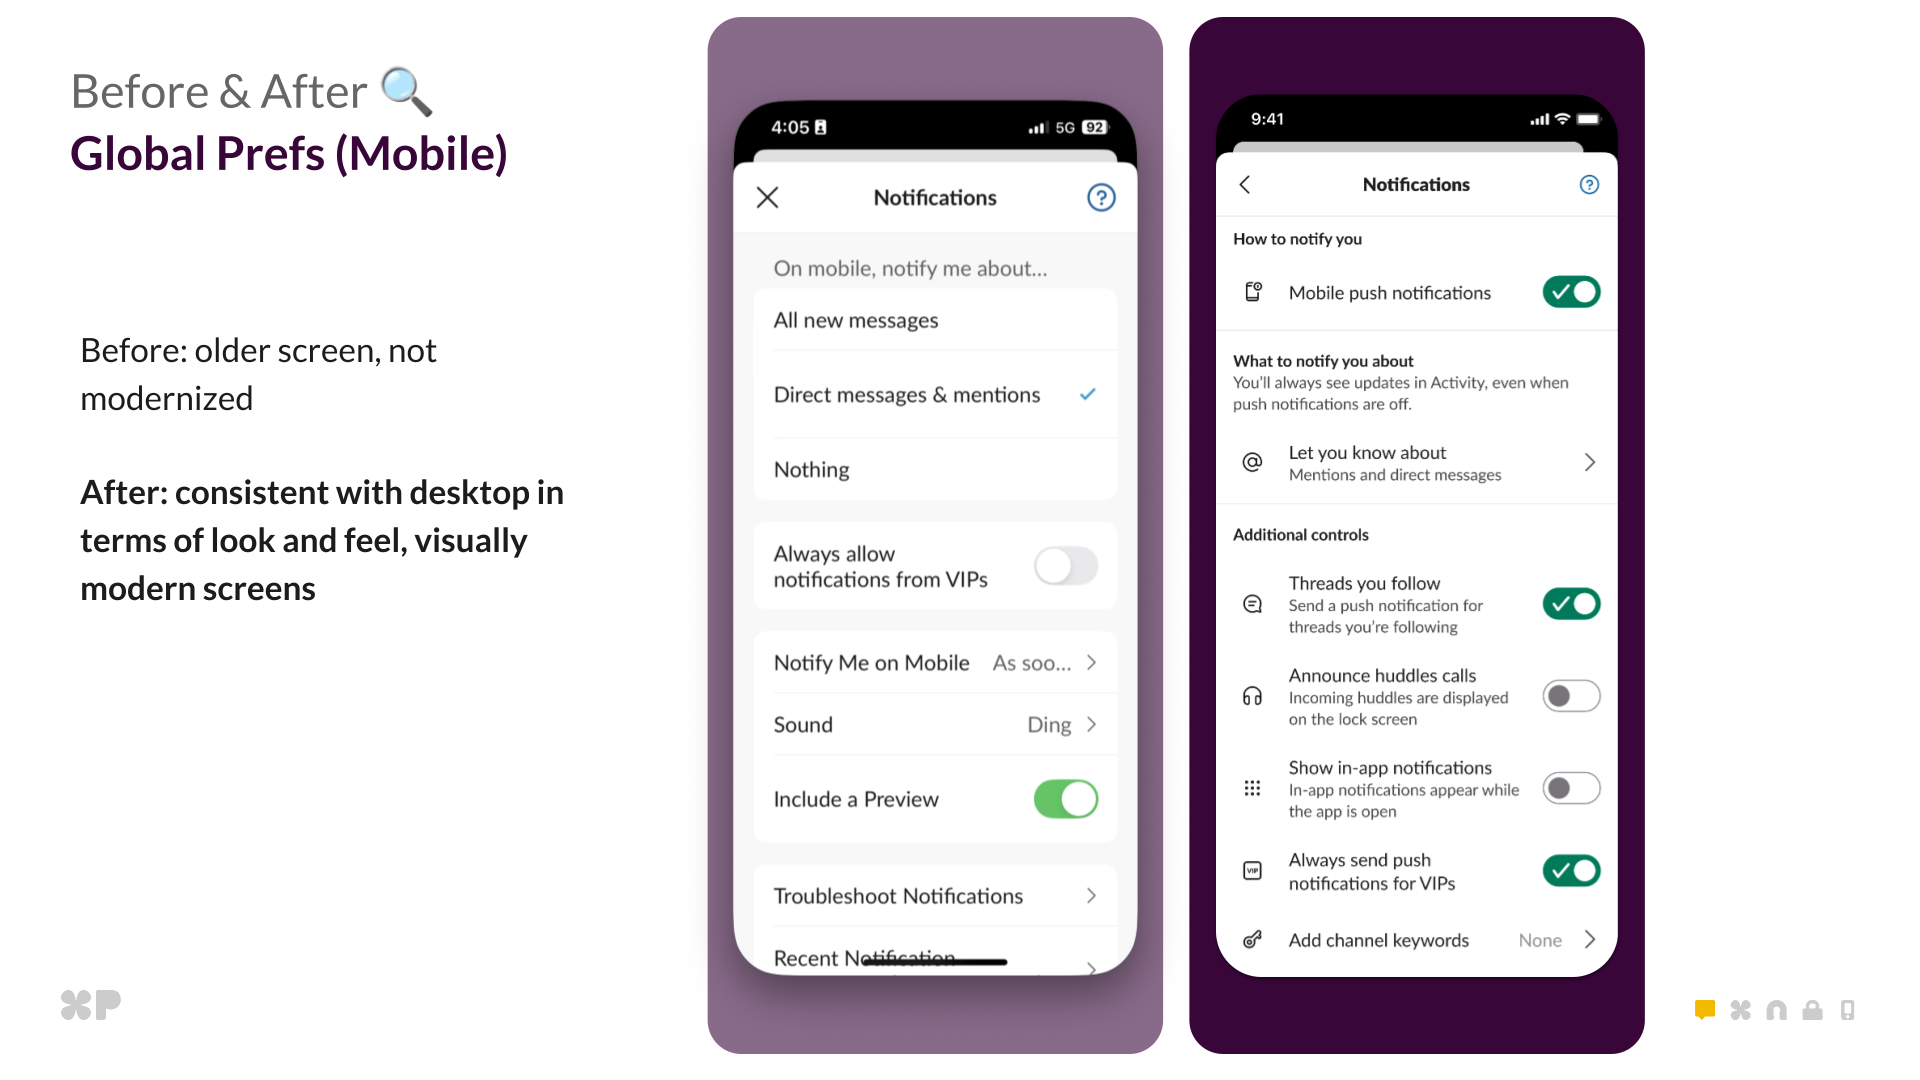
  • Global preferences: Modernized desktop and mobile experiences with consistent structure and copy.
  • Sync improvements: Consistent state across clients through simplified preference logic.

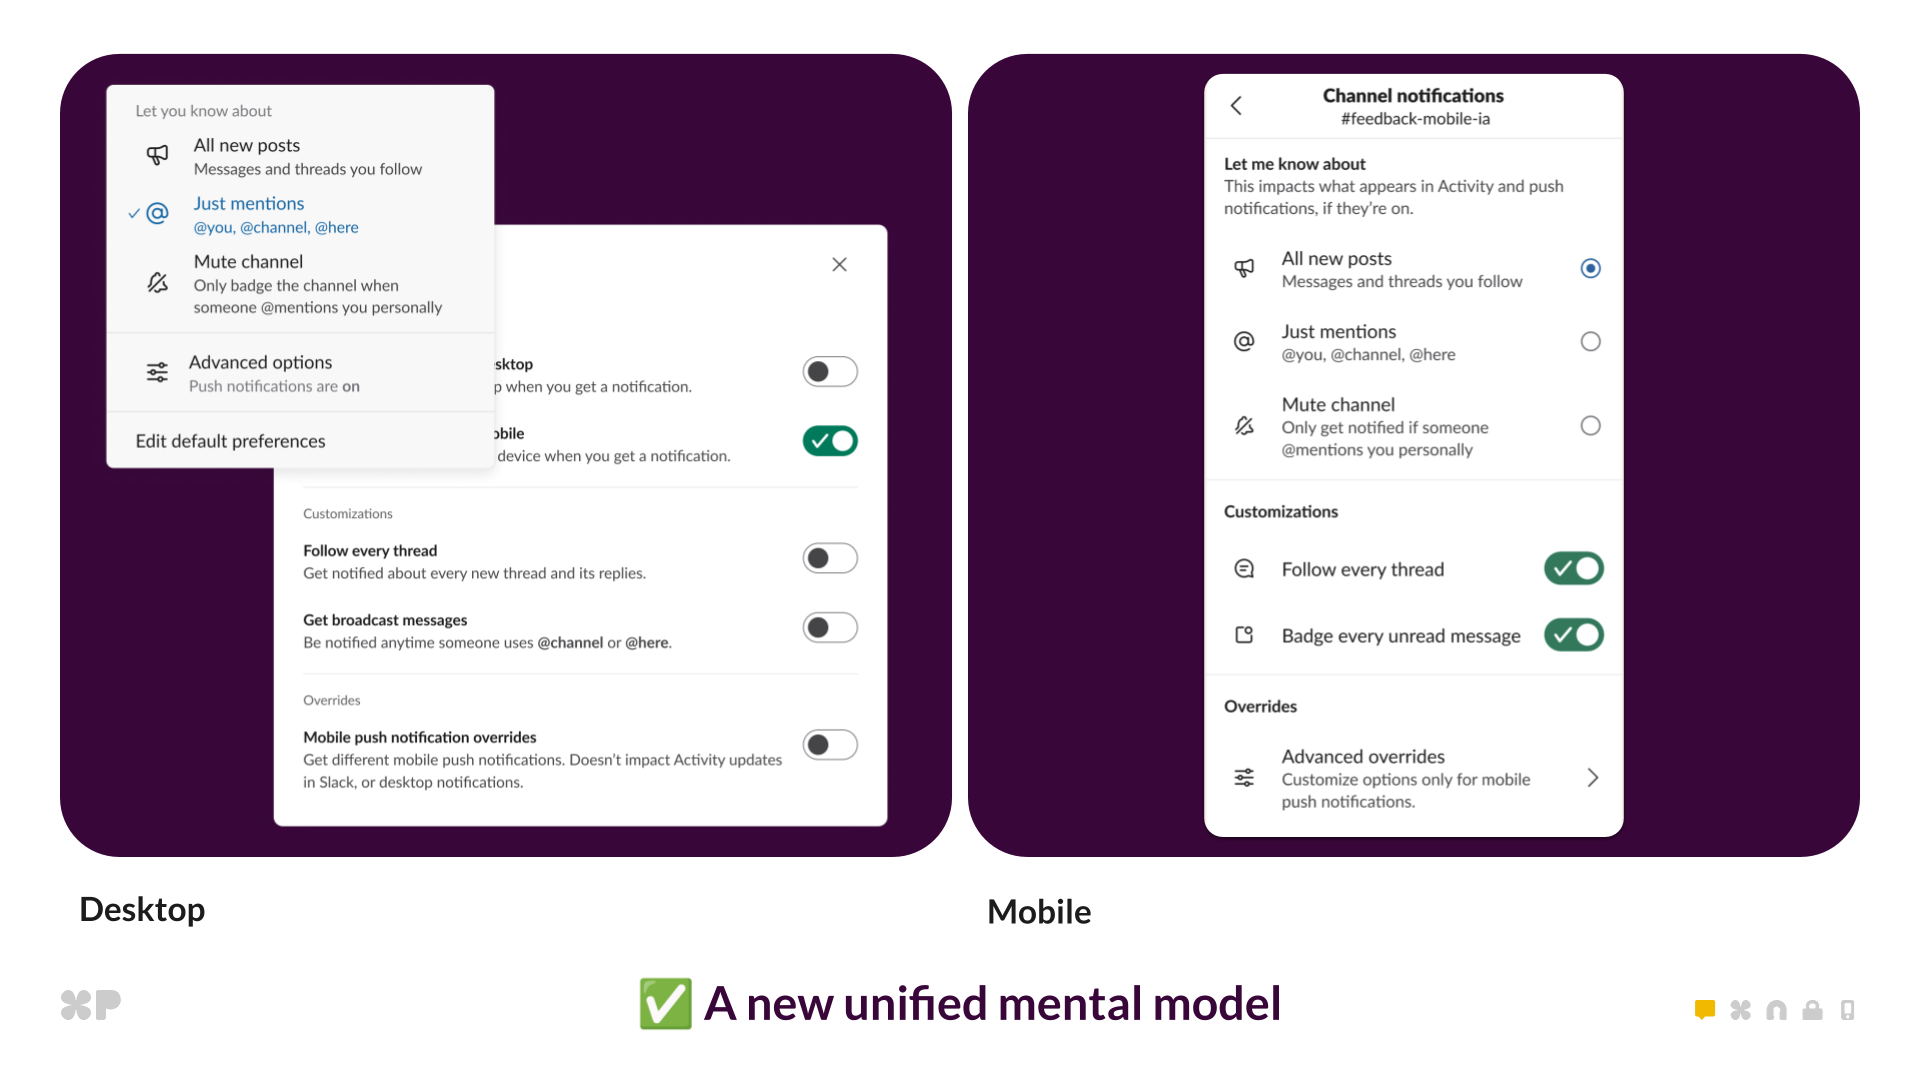
Before: four paradigms. After: one unified model with three options.

Mobile redesign: clearer settings and consistent cross-platform logic.

What “Simple” Really Looked Like  

Dozens of deep technical threads, many with 100+ replies , guided this project. These weren’t quick bug fixes but rather architecture decisions requiring tight alignment across product, design, frontend, backend, and mobile engineers. We tackled three major technical challenges:

  • The Preference Refactor: Migrating millions of users from four conflicting preference systems to one unified model
  • Modal Makeover and Global Preferences: Separating “what” from “how” with auto-save behavior and consistent cross-platform UI
  • Cross-Platform Parity: Achieving true state consistency between mobile and desktop

The Preference Refactor  

We rebuilt how Slack interprets notification preferences. The old “Off” setting now seamlessly migrates to “Mentions” with push disabled. It sounds simple, but this required deep backend and frontend coordination.

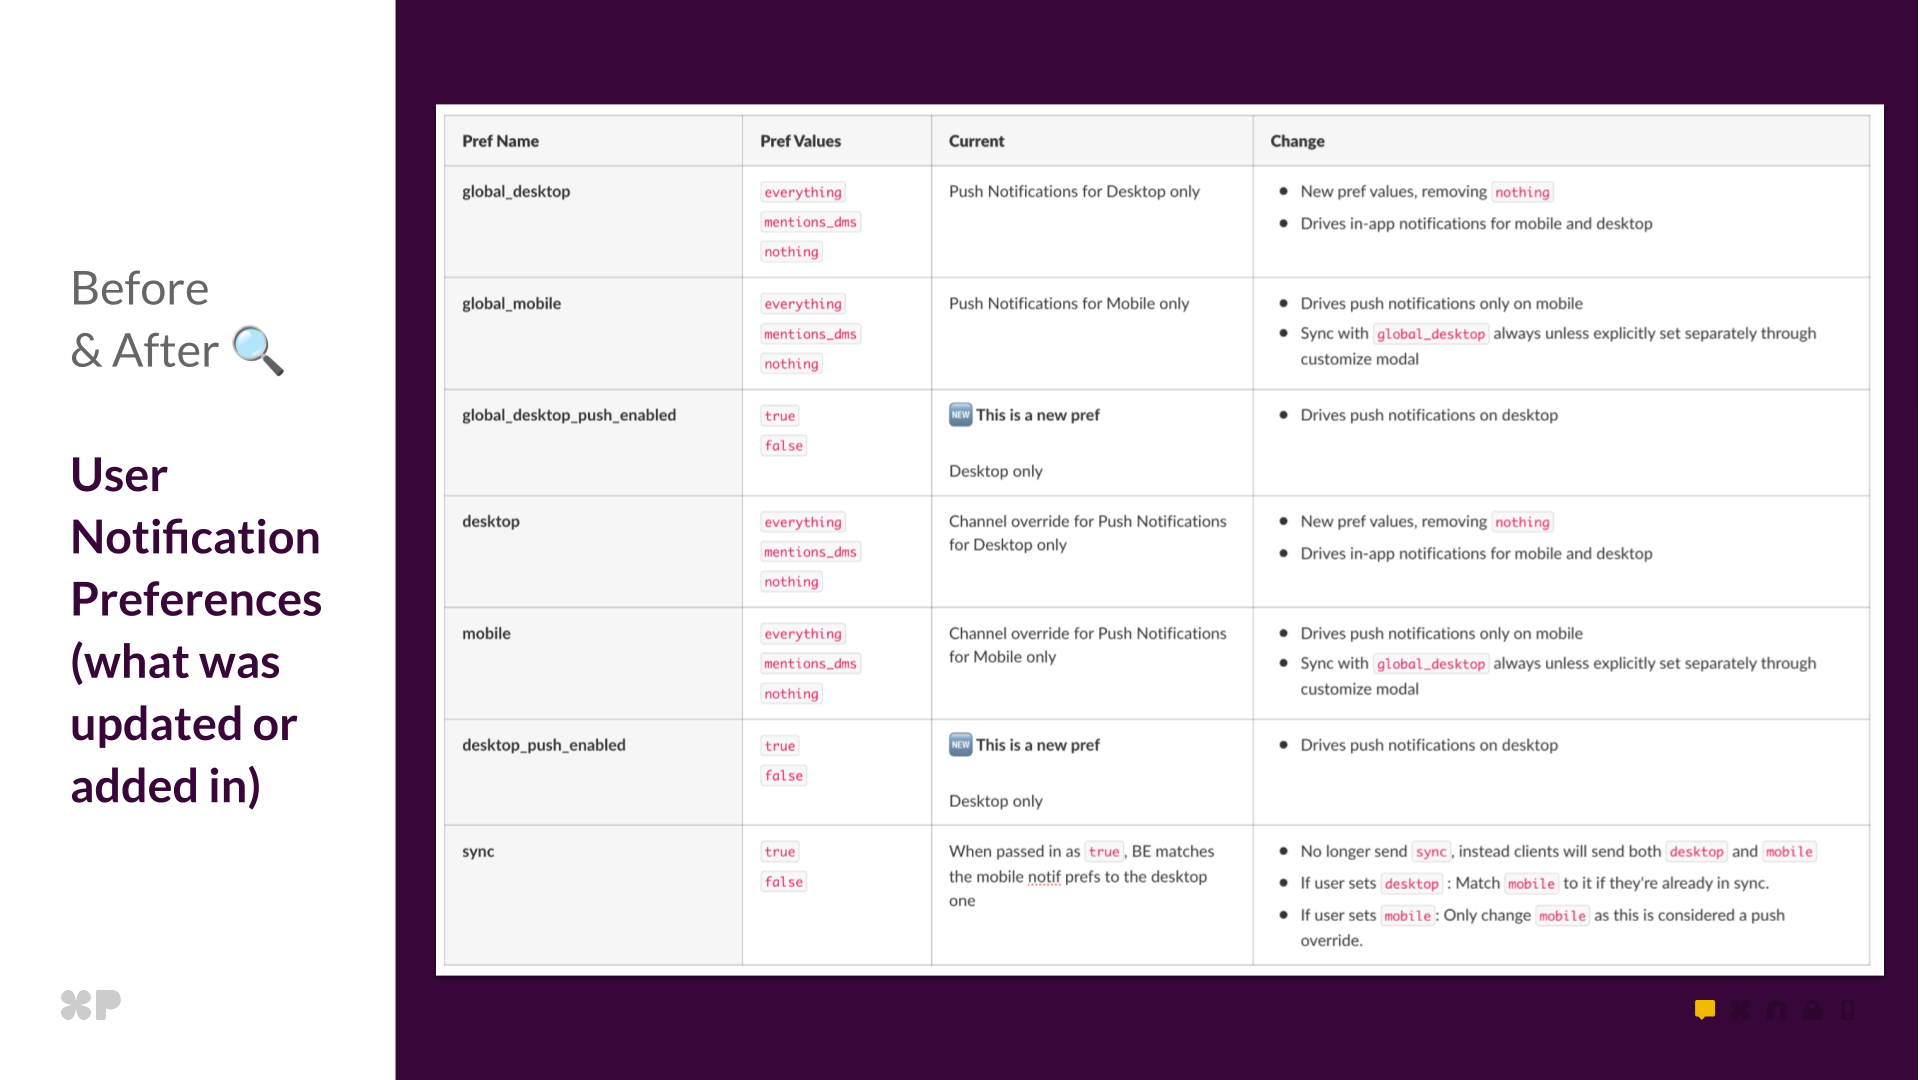
With backwards compatibility and the possibility of rollback in mind, we thought it too risky to move people from “off” to “mentions” at the database level. Instead, we used a read time strategy to ensure users had the same experience as before, but using the decoupled push logic. We introduced the new desktop_push_enabled pref which would be the only driver of enabling push notifications. Because this pref did not exist before, we were able to backfill all existing users based on whether they had it previously set to “off” with no interruptions to the current experience. We then did some read time magic to make “off” act as “mentions” but with pushes disabled in the new world (Because that is exactly how it functions today!). In-app notifications and activity are consistent across all clients, but push notifications are further customizable on desktop and mobile.

// Prefs before
'desktop': everything | mentions | nothing // Push on desktop
'mobile': everything | mentions |nothing // Push on mobile

// Prefs now
'desktop': everything | mentions // Activity on desktop and mobile
'desktop_push_enabled': true | false // Push on desktop
'mobile': everything | mentions | nothing // Push on mobile

Impact on noise: This refactor eliminated a major source of confusion. Users who thought they’d turned off all notifications were actually still getting in-app badges—they just didn’t know it. Now, “Mentions” means “notify me about mentions” and the push toggle explicitly controls interruptions.

Modal Makeover and Global Preferences

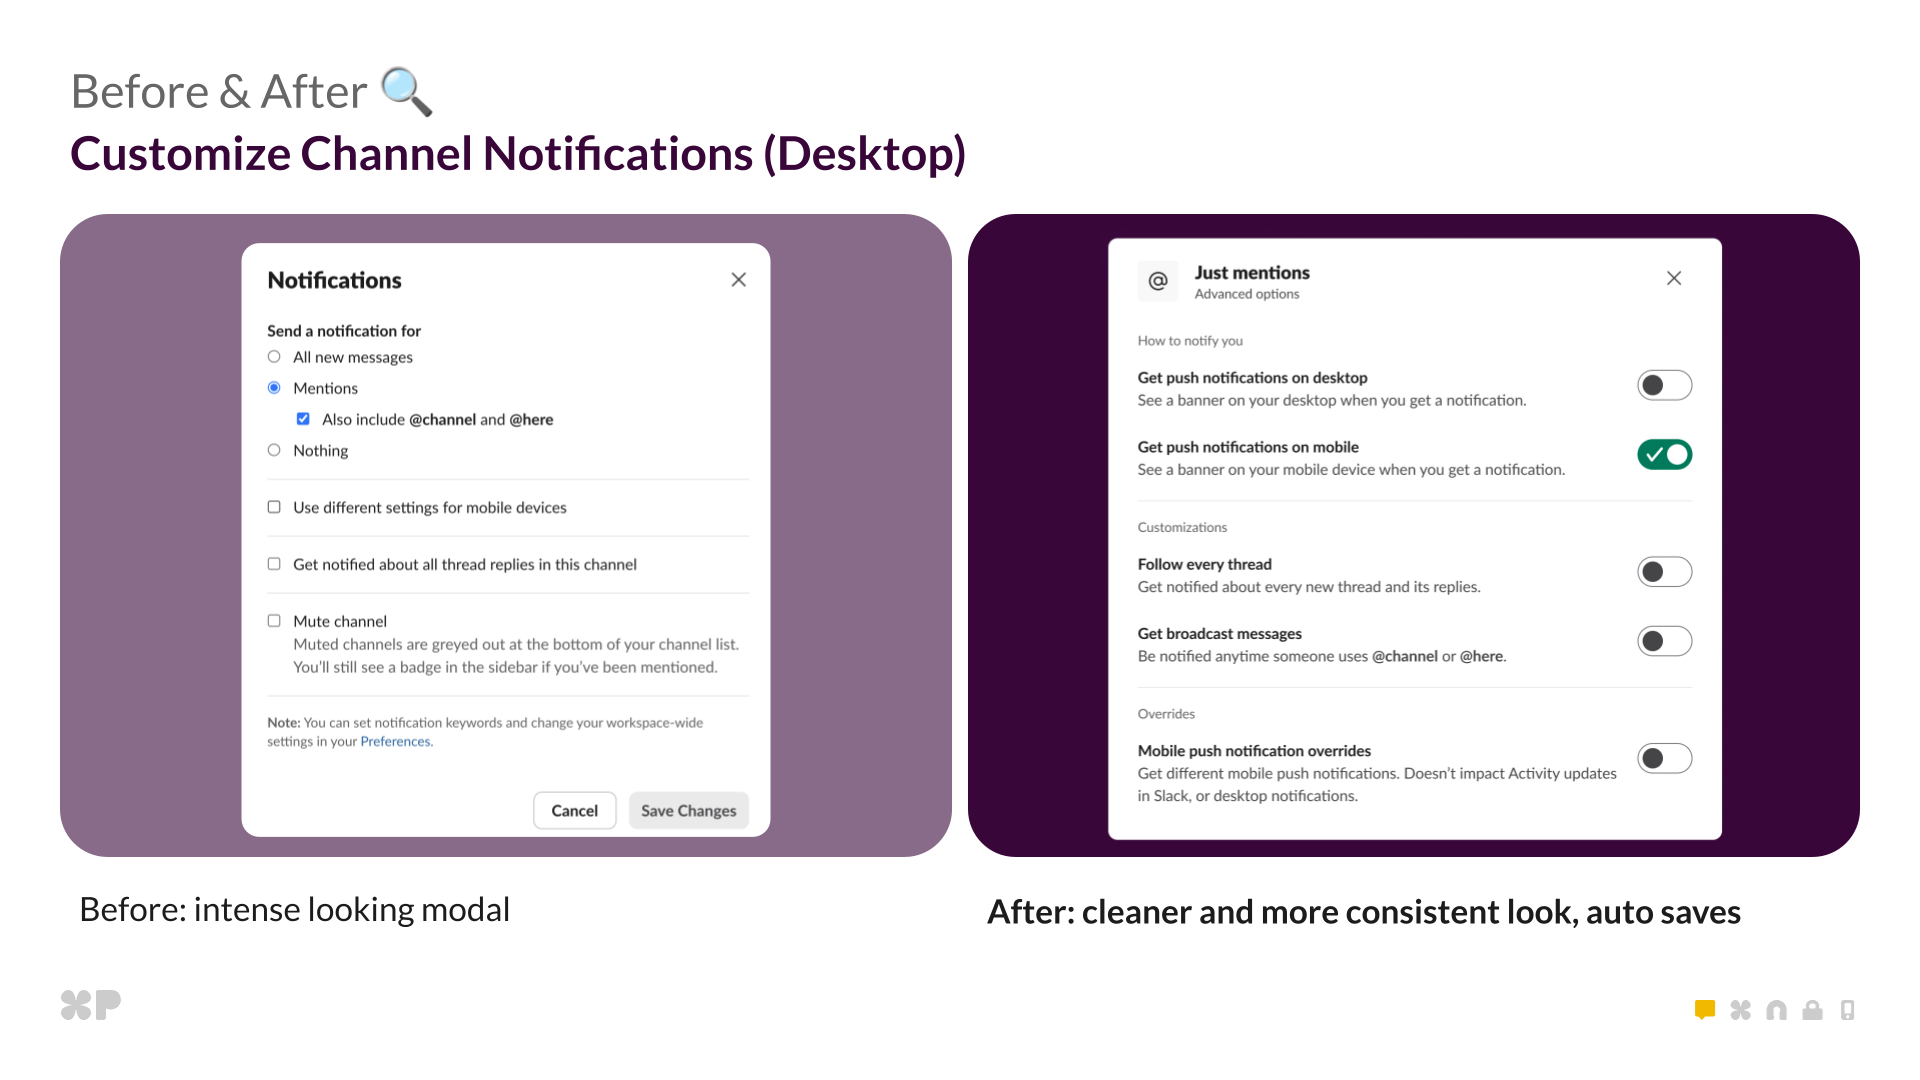
The old notification modal forced users to click “Save” after every change, making experimentation unreliable. Users would configure settings, forget to save, and wonder why nothing changed.

We introduced auto-save behavior—changes take effect immediately. We decoupled “what” from “how,” giving users independent control over activity and push. And we built cross-platform consistency through reusable React components, replacing legacy mobile-specific UI code.

Impact on noise: Users can now fine-tune their notification experience with confidence. Want to see all activity but only get pushed for mentions? Now it’s obvious how to do that. The clearer structure means less trial-and-error and fewer abandoned configuration attempts.


Cleaner, more consistent modal with auto-save behavior.

Cleaner, more consistent modal with auto-save behavior.

Still complex, but far more organized and readable.

Still complex, but far more organized and readable.

Mobile global preferences modernized to match desktop visually and structurally.

Mobile global preferences modernized to match desktop visually and structurally.

Cross-Platform Parity Challenge

Achieving true parity between mobile and desktop was one of the hardest tasks. The goal was simple: mobile should match desktop by default, with the option to override when needed.

The new preference model organizes every option into a clear hierarchy. This isn’t just design polish—it’s the conceptual model that powers how preferences work across all clients:

Unified hierarchy:

  • What to notify you about: All new messages, Mentions and DMs (default), or Mute
  • Push notifications: On desktop and mobile (default), desktop only, mobile only, or disabled
  • Advanced: Mobile-specific customization and badge controls

This redesign required renaming fields and refactoring client logic for explicit state, eliminating ambiguity and making rollbacks safe. We also rewrote some of the oldest pages in Slack’s iOS app—built before our modern architecture—to match desktop structure and visuals, ensuring consistency that builds trust across the entire experience.

This table showcases all the different user preferences we ended adding/updating on the backend

This table showcases all the different user preferences we ended adding/updating on the backend

Migration and Rollback Lessons

Migrating millions of users without disruption required careful mapping and fallbacks. Key lessons learned:

Trust must never break. We added read-time fallbacks so push_enabled: false always means “no push,” even during rollbacks.

Tiny schema issues can cause major UX bugs. A malformed field once reset preferences to Mentions until we cleaned data and flushed memcache.

Clarity beats cleverness. Removing the sync parameter and storing explicit desktop and mobile values made behavior predictable.

Closing Reflection

This project wasn’t just a refresh; it was a rebuild of trust. The legacy system created noise through confusion—users couldn’t predict what their settings would do, couldn’t reliably sync state across devices, and couldn’t find the controls they needed.

Why it matters

Users now control noise with confidence. The unified model means when users set a preference, they know exactly what will happen. No more hidden surprises, no more settings that don’t sync, no more choosing between being uninformed or overwhelmed.

 Support burden decreased significantly. A unified model means fewer tickets asking “why am I getting notifications?” or “how do I turn off mobile push?” The architecture now matches users’ mental models, making behavior predictable.

 Teams stay informed without the overwhelm. By separating “what to notify you about” from “how to receive notifications,” users can stay aware of everything happening in a channel while only getting pushed for what truly matters. This is the difference between reactive firefighting and intentional awareness.

A unified notifications model across desktop and mobile.

The data proves it: Tracking user engagement from pre-launch through post-launch reveals transformative adoption:

  • Settings engagement increased 5x and sustained for weeks—not one-time curiosity, but active ongoing preference refinement
  • Push notification toggles led to higher usage, with users immediately discovering the decoupled desktop/mobile controls. Advanced visibility options like “badge every unread message” saw significant engagement
  • Better defaults meant fewer workarounds—the percentage of users needing per-channel overrides decreased post-launch
  • Sustained engagement, not a spike—notification settings engagement remained elevated weeks after launch
  • The new default works—the vast majority chose “Mentions and DMs” while “All new messages” and “Mute” served their niche use cases well

More importantly, users report feeling more in control of their notification experience—turning Slack from a source of interruption into a tool for intentional focus.

What made it work

  • Close collaboration across design, frontend, backend, and mobile
  • Courage to revisit legacy systems instead of patching them
  • Shared alignment on clarity over speed
  • Collective ownership across the Messaging pillar

We proved that deep technical simplification can create emotional calm for millions of users. When the system matches how people think, staying informed becomes effortless—and that’s when Slack becomes the calm, focused workspace teams deserve.

Acknowledgments

Frontend: Frances Coronel, Chris Montrois, Katya Egorova

Backend: Shilpa Kannan, Steven Thacher, Yi Chen Che

iOS: Evan Hughes, Steven Wu, Sarah Huffman

Android: Frank Ding, Matt Pflance

XFN Leads: Celia Hunko, Brenda Chang, Annie Lawn, Mala Neti, Tanya Gupta

Big shoutout to the cross-functional team that made this project possible.

Notifications Team


Want to help millions of people work more intentionally? Join us at Slack.

Apply now
show more
From Custom to Open: Scalable Network Probing and HTTP/3 Readiness with Prometheus
Feed: Engineering at Slack (https://slack.engineering/feed/)
Published: 2026-03-31 17:00:39 | Created: 2026-07-23 05:22:39

The Problem: Legacy Tooling and Its Limitations

Currently, Slack utilizes a hybrid approach to network measurement, incorporating both internal (such as traffic between AWS Availability Zones) and external (monitoring traffic from the public internet into Slack’s infrastructure) solutions. These tools comprise a combination of commercial SaaS offerings and custom-built network testing solutions developed by our internal teams over time. This was a suitable enough solution for our needs.

When we began rolling out HTTP/3 support on the edge, there was a significant challenge that we encountered: A lack of client-side observability. 

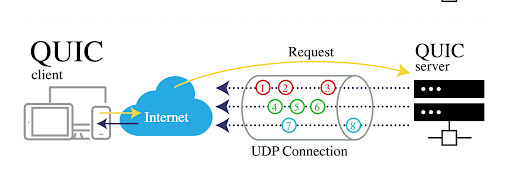
Since HTTP/3 is built on top of the QUIC transport protocol, it uses UDP instead of the traditional TCP. This fundamental shift to a new transport meant that existing monitoring tools and SaaS solutions were not capable of probing our new HTTP/3 endpoints for metrics.

At that time, there was a major gap in the market:

  • None of the SaaS observability tools we investigated supported HTTP/3 probing out of the box.
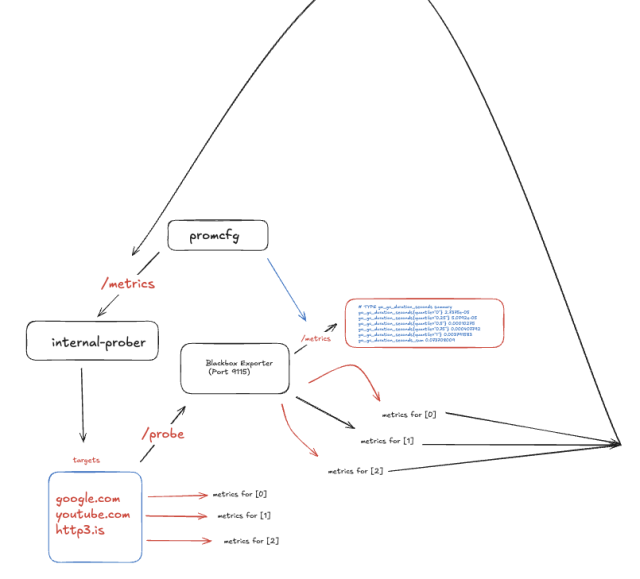
  • Our internal Prometheus Blackbox Exporter (BBE), a cornerstone of our monitoring, didn’t have native support for QUIC.

Without the ability to probe hundreds of thousands of HTTP/3 endpoints  in our new infrastructure, we couldn’t get the client-side visibility we needed to monitor regressions to HTTP/2 or accurate round trip measurements. 

The Intern Who Made It Happen

The Open Source Contribution  

Our intern, Sebastian Feliciano, scoped, implemented, and ultimately open-sourced QUIC support for Prometheus BBE

Choosing the Right HTTP Client: The first step was selecting a QUIC-capable HTTP client. After careful consideration, they chose quic-go to serve as the foundation for the new functionality. The choice was settled on due to its wide adoption across other open source technologies, as well as the first-class support it provides in creating http clients in go.

Here’s how Sebastian integrated quic-go into BBE’s HTTP client:

http3Transport := &http3.Transport{
    TLSClientConfig: tlsConfig,
    QUICConfig:      &quic.Config{},
}

client = &http.Client{
    Transport: http3Transport,
}

Maintaining Composability: Sebastian had to add this new logic while following the Blackbox Exporter’s existing architecture, ensuring the new features maintained the tool’s configuration patterns. 

The result of this work was a functional and configurable HTTP/3 probe within Prometheus, and by open-sourcing their contribution, they provided a solution that the entire Prometheus community could use. By following existing patterns and earning community buy-in, Sebastian successfully landed the HTTP/3 feature. 


Final Step: Integration  

Making an open-source contribution as an intern is a huge accomplishment. As many of us know, maintainers don’t always merge PRs quickly, especially for new features. Sebastian’s internship timeline was limited, so he couldn’t wait. Sebastian took matters into his own hands and architected an in-house system that utilized the new upstream features for probing out HTTP/3 endpoints.

Operational Improvements

Single Pane of Glass: We now have a unified view of both HTTP/1.1, HTTP/2, and HTTP/3 metrics in Grafana, allowing for easier correlation with other telemetry and comparison.

Better and More Reliable Alerts: With the new probes, we can create more reliable alerts on the health and performance of our HTTP/3 endpoints.

Easier Correlation: Having all our data in one place makes it easier to correlate HTTP/3 performance with other metrics and debug issues faster.

The Open Source Win

Community Benefit: This contribution benefits the wider Prometheus community, helping other organizations facing the same challenges with HTTP/3 adoption. By building this support, we have future-proofed our observability for the ongoing adoption of QUIC and HTTP/3.

Looking Ahead

While this is a major step, our work isn’t done. Future improvements could be made through adding advanced features, such as:

  • Server Name Indication (SNI) routing tests
    • Validating that the SNI extension is correctly handled by our edge infrastructure. This ensures that when a client requests a specific hostname over a shared IP (like a CDN or a multi-tenant load balancer), the gateway correctly routes the traffic to the intended backend and serves the matching SSL certificate, preventing misrouting errors.
  • end-to-end path visualization
    • Moving beyond simple “up/down” checks by mapping the entire network hop-by-hop from the monitoring agent to the service endpoint. This provides a visual representation of the network path, making it possible to pinpoint exactly where latency spikes, or packets are lost.

We invite others in the community to try out this new QUIC support in Prometheus Blackbox Exporter and join us in building the next generation of observability tools. You can find the HTTP/3 configuration in the configuration documentation in the Prometheus Black Box Exporter repository.

Conclusion

There were a few takeaways from this project:

1. Monitor first, and migrate second

This should go without saying, but getting observability right as a precursor to migration makes everything faster. We know that the industry is going towards QUIC, but proving to ourselves that it’s the right move long term enables us to invest more into its future.

2. Contributing open source pays dividends

It feels good to give back to open source communities who provide us so much. When a game changing protocol like QUIC comes through, and there’s a gap in existing technologies supporting it, everyone wins when we fill the gap, and we win when everyone decides to support it long term.

3. Bet on your interns

We were incredibly fortunate to have landed Sebastian as an intern for our team. His proactiveness and creativity in problem solving helped us push the QUIC migration across the line, and gave us tangible exposure to the benefits of black-box monitoring.

This journey from having an observability gap to an open-sourced solution perfectly illustrates our commitment to simplicity and scalability. As HTTP/3 adoption grows industry-wide, we’re committed to keeping our monitoring tools ahead of the curve. We welcome community feedback and contributions to help evolve these capabilities further.

Interested in taking on interesting projects, making people’s work lives easier, or just building some pretty cool forms? We’re hiring!

Apply now
show more
Managing context in long-run agentic applications
Feed: Engineering at Slack (https://slack.engineering/feed/)
Published: 2026-04-13 17:17:16 | Created: 2026-07-23 05:22:39

Excerpt

In complex, long-running agentic systems, maintaining alignment and coherent reasoning between agents requires careful design. In this second article of our series, we explore these challenges and the mechanisms we built to keep teams of agents working productively over long time spans. We present a range of complementary techniques that balance the conflicting requirements of continuity and creativity.


In our first article, we introduced our agentic security investigation service. We described how teams of AI agents collaboratively investigate security alerts. A Director orchestrates the investigation, many specialist Experts gather evidence, and a Critic reviews the Experts’ findings. We suggest you read the series in order.

To briefly recap, our investigation process proceeds through a series of defined phases. Each phase implements a distinct set of agent interactions. Within phases, we may have multiple rounds, where each round is one full iteration through the phase. There’s no preset limit on the number of rounds that make up an investigation: investigations continue until concluded by the Director agent.

The Challenge of Long-run Coherence

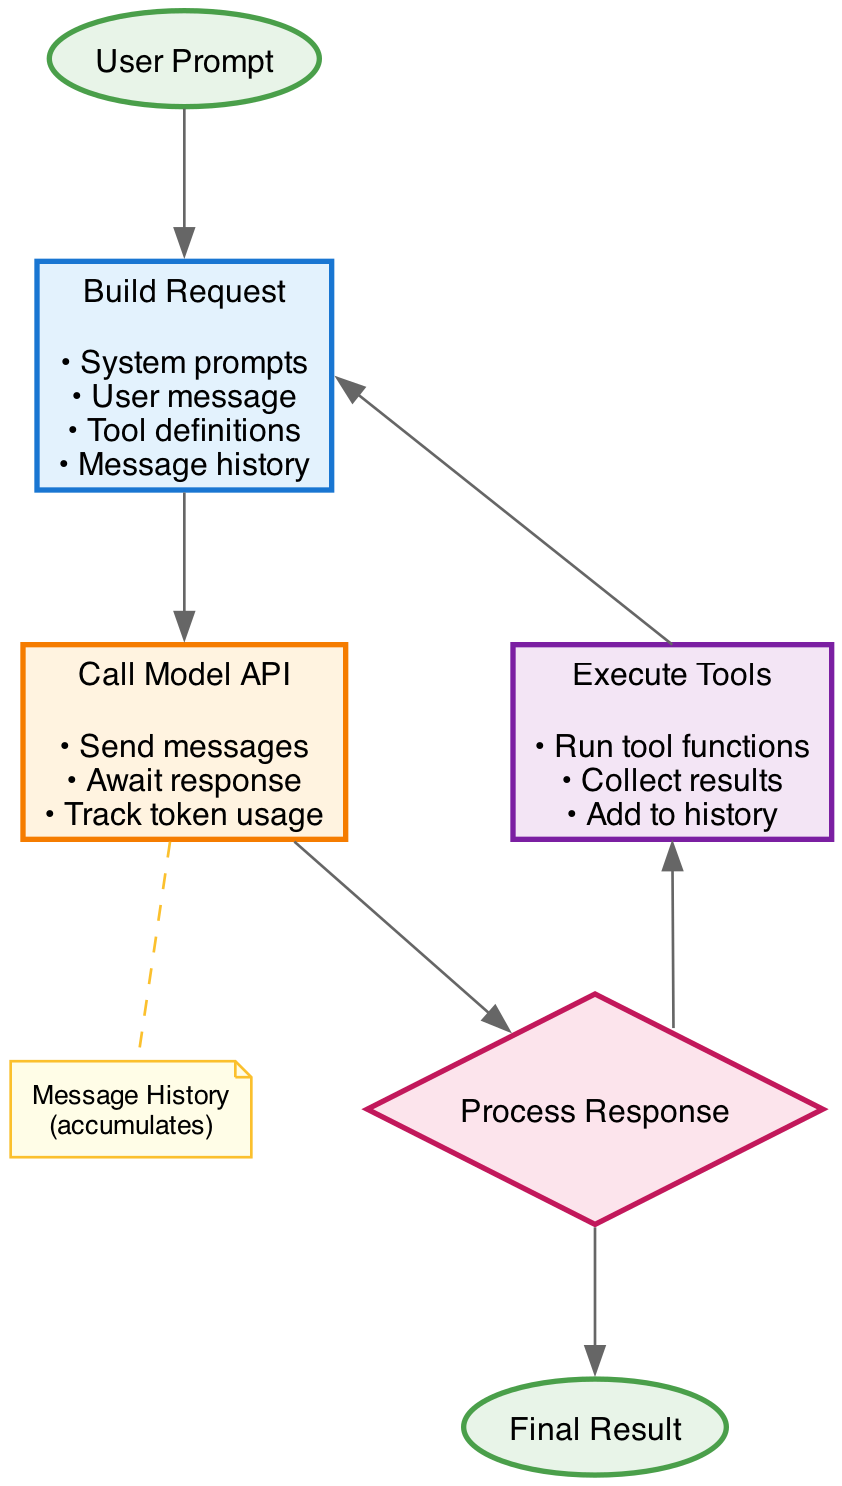
Language model APIs are stateless: to provide continuity between requests, the caller must provide the complete message history with each request. Agent frameworks solve the state management problem for users by accumulating message history between API calls. This fills the agent’s context window, which provides a hard limit on how much information the agent can handle. Even approaching an agent’s context window limit can degrade the quality of responses. For short-run applications, no extra context window management is typically required.

High-level overview of how agent frameworks manage context across inference API calls

Complex security investigations can span hundreds of inference requests and generate megabytes of output, requiring special handling. Multi-agent applications, like ours, add further complexities. For each agent to optimally execute its role, it requires a tailored view of the investigation state. Each view must be carefully balanced. If agents are not anchored to the wider team, the investigation will be disconnected and incoherent. Conversely, sharing too much information stifles creativity and encourages confirmation bias.

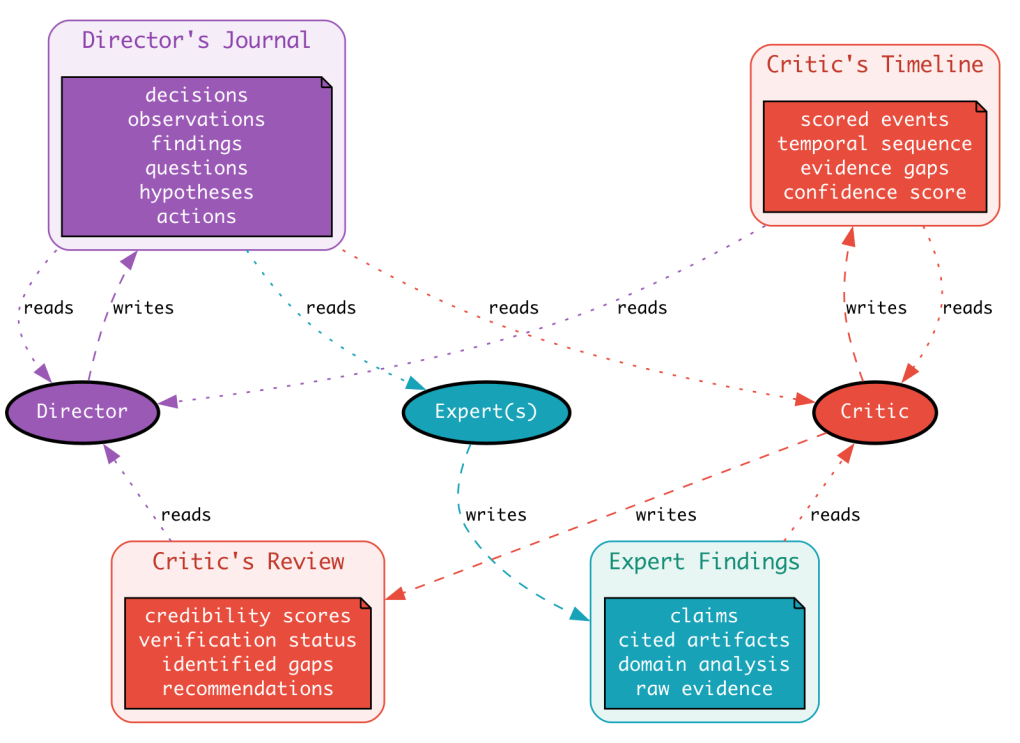
Our solution uses three complementary context channels:

  • Director’s Journal: The Director’s structured working memory
  • Critic’s Review: Annotated findings report with credibility scores
  • Critic’s Timeline: Consolidated chronological findings with credibility scores

Each channel serves a different purpose, and together they provide the context each agent needs without overwhelming any of them.

How our agents consume and produce different context sources

Specimen Content

We include edited extracts of the Journal, Review, and Timeline from one investigation in this article. These extracts should give a meaningful sense of what these context resources look like in practice. They have been edited to generalize the content, but they are derived from a real investigation. The alert was generated in response to the loading of a kernel module. In fact, the event was a false positive caused by a developer installing a package in a development environment, and the triggered detection rule being overly sensitive. Specimen extracts are shown in italics.

The Director’s Journal

The Director is responsible for orchestrating the investigation: deciding what questions to ask, which Experts to engage, and when to conclude the investigation. To make coherent decisions across rounds, it needs memory of what’s been discovered and decided. 

The Director has a journaling tool. The Director’s system prompt encourages it to update the Journal often and use it for short notes. The Journal captures decisions, observations, hypotheses, and open questions in a structured format. It serves as the Director’s working memory.

Entry Types

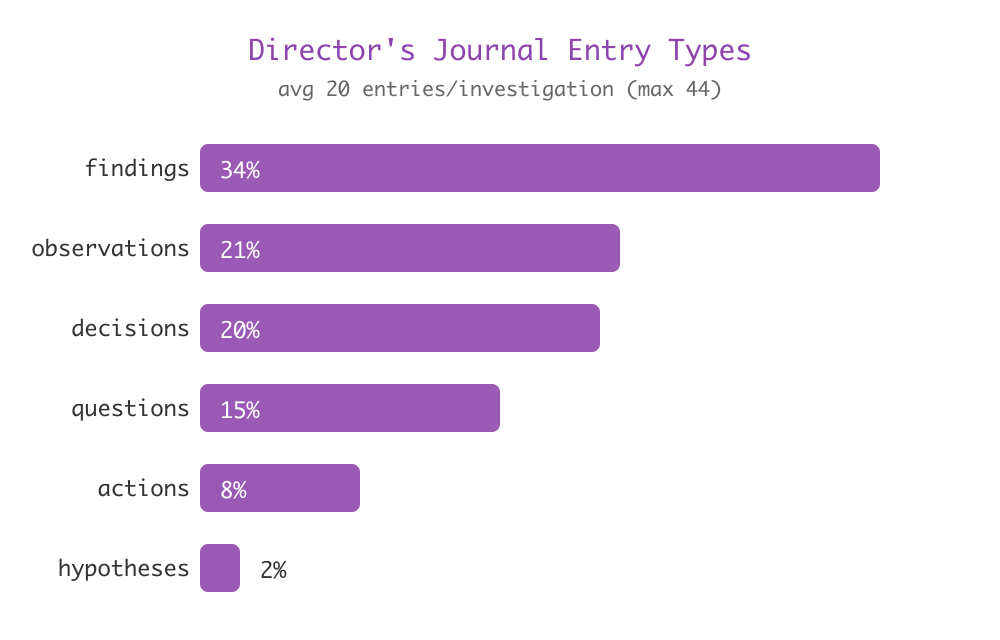
The Journal supports six entry types:

Type Purpose Example
decision Strategic choices “Focus investigation on authentication anomalies rather than network activity”
observation Patterns noticed “Multiple failed logins preceded the successful authentication”
finding Confirmed facts “User authenticated from IP 203.0.113.45, not in historical baseline”
question Open items “Was the VPN connection established before or after the suspicious activity?”
action Steps taken/planned “Requested Cloud Expert to examine EC2 instance activity”
hypothesis Working theories “This pattern suggests credential stuffing rather than account compromise”

In addition to classifying its entries, the Director can also assign priority, list follow-up actions, and include citation references to evidential artifacts. When the journaling tool is used, each entry is annotated with the investigation context: the phase, round number, and timestamp. The tool itself does nothing more than accumulate entries.

Every agent receives the current content of the Director’s Journal in their prompt, presented as chronology. Their system prompts include guidance that explains the Director’s role, their relationship to the Director, the purpose of the Journal, and how to interpret it.

How It Maintains Alignment

The Journal allows the Director to lead the investigation towards a conclusion, to observe and measure its progress, to identify dead-ends, and to make course corrections in response. It provides the common narrative that keeps other agents on track.

Breakdown of entry types in the Journal

Example Director’s Journal

Time: 09:32:21 | Priority: High

Identified event as endpoint process start, user running as root on dev workstation. Command is a package hook script (not direct modprobe). Listed key questions about user roles, host type, and log sources.

Time: 09:32:29 | Priority: Medium

Identified 4 relevant expert domains needed: endpoint telemetry, identity/access (user roles), configuration management (host config), user-behavior (activity patterns).

Time: 09:33:10 | Priority: Medium

Noted cgroup indicates user session, hostname suggests personal workstation. Realized command runs during package installation sequence, not actual module loading.

Time: 09:34:06 | Priority: High

Alert rule matching “kmod” in script path, not actual modprobe execution. Host identified as personal dev environment. Activity appears to be legitimate system administration.

Time: 09:35:15 | Priority: Medium

Confirmed dev environment grants root by design. Summarized investigation resources (endpoint queries, process ancestry, SSH cert logs). Preliminary assessment: false positive.

Time: 09:35:51 | Priority: High

Need to verify parent process chain, check for actual modprobe/insmod execution, reconstruct full session activity. Formulated targeted query for endpoint expert.

Time: 09:40:47 | Priority: Critical

Reviewed expert findings (6,046 events showing package install triggered event). All 4 experts agree: FALSE POSITIVE. Timeline confidence 0.83. Decision: advance to conclude.

Time: 09:41:15 | Priority: High

Summarized all findings. Root cause: detection rule matched pathname not actual operation. Recommended action: tune detection rule to distinguish hook scripts from real modprobe.

The Critic’s Review Tools

To progress the investigation, the Director poses questions to Experts. Each Expert has a subject domain and tools to allow them to interrogate relevant data sources. At the end of their run, the Experts produce findings, citing investigation artifacts (tool calls) to support their conclusions. Even with strict guidelines, this process is not, by itself, sufficiently robust. Language models are known to hallucinate, and a proportion of the Experts’ findings could either be invented or grossly misinterpret the data.

The Critic’s role is to assess the Experts’ work, checking that reported findings are supported by evidence and that interpretations are sound. To do this accurately, it needs to be able to inspect not only each Expert’s claims and the cited evidence, but the methodology. 

In the Review task, the Critic examines all the Experts’ findings in a single pass. Aggregating the findings together allows it to identify where the findings support or contradict each other. Due to the number of findings that can be produced, it’s not practical to provide all of the information to the Critic directly. Instead, the Critic receives a summary report and uses a suite of tools to examine the cited evidence.

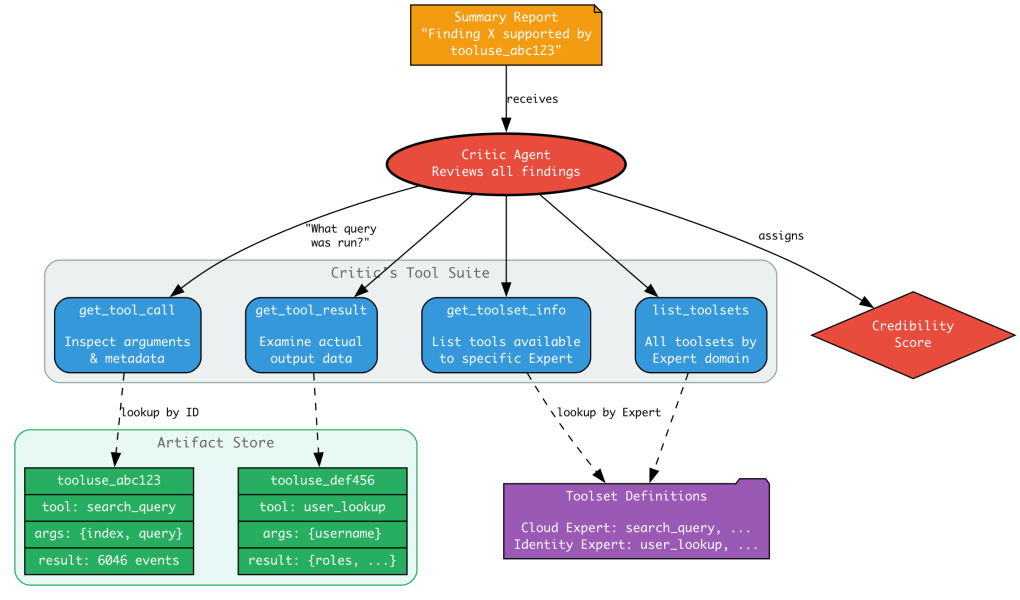
How Critic’s review tools are used

We provide the Critic with four tools:

Tool Purpose
get_tool_call Inspect the arguments and metadata of any tool call
get_tool_result Examine the actual output returned by a tool use
get_toolset_info List what tools were available to a specific Expert
list_toolsets List all available toolsets organized by Expert

Collectively, these tools allow the Critic to examine evidence and data gathering methodology. When an Expert cites tooluse_abc123 as supporting a finding, the Critic can use get_tool_call to examine the tool parameters used to obtain the result, and get_tool_result to see exactly what data the Expert was looking at. It can also use get_tool_info to access each tool’s inline documentation to determine if the tool was correctly used, and list_toolsets to understand if the Director made an error by posing a question to an Expert that was not properly equipped to answer, or if an Expert made a poor tool selection.

The Review Scoring System

The output of the Critic’s Review task is an annotated findings report containing an overall summary and scored findings. Not all findings are equally reliable. A finding corroborated by multiple sources deserves more weight than speculation based on partial data. By assigning numeric scores, we enable:

  1. Informed decision-making: Highly credible findings can be prioritized
  2. Timeline quality: Only credible findings make it into the consolidated timeline
  3. Audit trails: Staff can quickly identify which conclusions need scrutiny

Operational insights: Dashboards illustrating system performance

The Critic’s Rubric

We use a five-level credibility scale:

Score Label Criteria
0.9-1.0 Trustworthy Supported by multiple sources with no contradictory indicators
0.7-0.89 Highly-plausible Corroborated by a single source
0.5-0.69 Plausible Mixed evidence support
0.3-0.49 Speculative Poor evidence support
0.0-0.29 Misguided No evidence provided or misinterpreted

The following table shows the distribution of classifications over 170,000 reviewed findings. Slightly over a quarter of findings don’t meet the plausibility threshold.

Score Label %
0.9-1.0 Trustworthy 37.7
0.7-0.89 Highly-plausible 25.4
0.5-0.69 Plausible 11.1
0.3-0.49 Speculative 10.4
0.0-0.29 Misguided 15.4

It’s reasonable to question whether the Critic’s Review provides a false sense of assurance; it’s also conducted by model inference. We approach this problem from several directions with a range of mitigations.

The first mitigation is to use a stronger model for the Critic. Because the Critic only reviews submitted findings rather than the entire Expert run, the number of tokens required is kept within reasonable limits. While stronger models are still subject to hallucination, research suggests they err less frequently. Equally important is the capacity of the Critic to interpret nuances in the evidence, which is also improved with a stronger model.

The second mitigation is the formulation of the Critic’s instructions. Language models are more likely to hallucinate when posed larger, open-ended questions. The agent is instructed to only make a judgement on the submitted findings.

Example Critic’s Review

Cloud Expert delivered a strong investigation with a comprehensive search query retrieving 6,046 session events and correctly identifying: (1) legitimate package operations, (2) kernel regeneration during system updates, (3) modprobe –show-depends queries for boot ramdisk configuration (not actual module loading), and (4) false positive detection rule matching on hook script name rather than kernel operations.

Annotated Findings

[0.92] Package operations triggered legitimate kernel regeneration on the target development host. Comprehensive query shows package management operations with expected package names confirmed in process event fields.

[0.90] Parent process executed hooks including framebuffer, mdadm, and busybox scripts as part of normal operation. Parent process spawned multiple child processes executing hook scripts.*

[0.88] Modprobe operations were information-gathering queries (–show-depends –ignore-install flags) for thermal, dm-cache, raid0 modules, not actual kernel module insertion. Verified executable=/usr/bin/kmod with flags that query dependencies without loading.

[0.87] Activity is expected system maintenance on a personal development environment by an authorized user with expected roles and root access during business hours.

[0.85] Alert triggered on shell script name pattern rather than actual modprobe/insmod execution. Detection rule overly-broad: flagged dash interpreter running script with ‘kmod’ in pathname.

The third mitigation is the Critic’s Timeline task, which we will now describe.

Critic’s Timeline

The Critic’s Timeline task immediately follows the Review task in the investigation sequence. It is challenged to construct the most plausible consolidated timeline from three sources:

  1. The most recent Review
  2. The previous Critic’s Timeline
  3. The Director’s Journal

Whereas the Review task is token intensive and requires the correct use of many tools, Timeline assembly operates entirely on data in the prompt. The intuition is that the more narrowly scoped task leaves a greater capacity for reasoning in the problem domain, rather than methods of data gathering or judgements of Expert methodology.

Consolidation Rules

The Critic follows explicit rules when assembling Timelines:

  1. Include only events supported by credible citations – Speculation doesn’t belong on the Timeline
  2. Remove duplicate entries describing the same event – An event shouldn’t appear twice because two Experts mentioned it
  3. When timestamps conflict, prefer sources with stronger evidence – A log entry timestamp beats an inferred time

Maintain chronological ordering based on best available evidence – Events must flow logically in time

Gap Identification

Not every Timeline is complete. The Critic identifies significant gaps that should be addressed:

  1. Evidential gaps: Missing data that would strengthen conclusions
  2. Temporal gaps: Unexplained periods between events
  3. Logical inconsistencies: Events that don’t fit the emerging narrative

We limit gap identification to the top 3 most significant gaps. This focuses the Director’s attention on what matters most rather than presenting an exhaustive list of unknowns.

The Critic is instructed to score the Timeline using a narrative-building rubric.

Score Label Meaning
0.9-1.0 Trustworthy Strong corroboration across multiple sources, consistent timestamps, no significant gaps
0.7-0.89 Highly-plausible Good evidence support, minor gaps present, mostly consistent Timeline
0.5-0.69 Plausible Some uncertainty in event ordering, notable gaps exist
0.3-0.49 Speculative Poor evidence support, significant gaps, conflicted narrative
0.0-0.29 Invalid No evidence, confounding inconsistencies present

The Timeline task raises the bar for hallucinated findings by enforcing narrative coherence. To be preserved, each finding must be consistent with the full chain of evidence; findings that contradict or lack support from the broader narrative are pruned. A hallucination can only survive this process if it is more coherent with the body of evidence than any real observation it competes with.

Example Critic’s Timeline

Confidence Score: 0.83

False positive security alert triggered during legitimate system maintenance on a personal development environment. Detection rule 

incorrectly flagged a package hook script based on pathname string matching, rather than actual kernel module loading operations. All modprobe executions were dependency queries (–show-depends flags) for boot ramdisk configuration, not live kernel modifications. Activity occurred during business hours with proper audit trail preservation, consistent with the development environment’s intended use.

Event Sequence

09:29:01Z – User session begins on development workstation

09:30:39Z – Package management operations initiated by developer

09:30:48Z – Package management triggered system maintenance hooks

09:31:26ZALERT TRIGGERED – Hook script invoked

09:31:27Z – modprobe information-gathering for modules to determine ramdisk dependencies

09:31:29Z – modprobe dependency queries complete

09:31:29Z – Additional hook scripts executed as part of ramdisk regeneration process

Evidence Gaps

  • Exact session initiation timestamp unknown – session activity observed from 09:29:01Z but SSH login event not captured
  • Specific command that initiated apt/dpkg operations not identified – timeline shows package operations beginning at 09:30:39Z but triggering command not documented
  • Secondary analyst failed to locate parent process using incorrect field name and missed modprobe operations by searching wrong path – reduces confidence in independent verification

Message History

As we explained in the introduction, agentic frameworks manage message history by accumulating messages and tool calls through the chain of inference requests that make up each agent invocation. In long-run agentic applications, you cannot simply carry the message history forward indefinitely. As more of the model’s context window is consumed, costs and inference latencies increase, model performance declines, and eventually the accumulated messages will exceed the context window.

Our approach is to rely entirely on the context channels presented in this article: the Journal, Review, and Timeline. Besides these resources, we do not pass any message history forward between agent invocations. Collectively, these channels provide a means of online context summarisation, negating the need for extensive message histories. Even if context windows were infinitely large, passing message history between rounds would not necessarily be desirable: the accumulated context could impede the agents’ capacity to respond appropriately to new information.

Conclusion

Maintaining alignment and orientation in multi-agent investigations requires deliberate design. Each agent should have specific responsibilities, and a view of the investigation state tailored to its task. With proper design, context window limitations are not a major obstacle to building complex, long-running agentic applications.

We addressed these challenges with complementary mechanisms:

  • Journal: Structured, shared memory for investigation orchestration
  • Review: Credibility-scored findings that prune out inaccuracies and hallucinations
  • Timeline: Most plausible chronology, constructed from credible evidence

These mechanisms work together to maintain coherence across rounds, while preserving the benefits of specialized agent roles. The Director can make informed strategic decisions. Experts can build on previous understanding. The Critic can objectively evaluate findings. The result is investigations that are more thorough and more trustworthy than any single agent could produce alone.

In our next article, we’ll explore how artifacts serve as a communication channel between investigation participants, examining the artifact system that connects findings to evidence and enables the verification workflows described in this article.

Acknowledgements

We wanted to give a shout out to all the people that have contributed to this journey:

  • Chris Smith
  • Abhi Rathod
  • Dave Russell
  • Nate Reeves


Interested in taking on interesting projects, making people’s work lives easier, or just building some pretty cool forms? We’re hiring!

Apply now
show more
From SSH to REST: A Security-Driven Modernization of Slack’s EMR Data Pipelines
Feed: Engineering at Slack (https://slack.engineering/feed/)
Published: 2026-05-05 14:00:01 | Created: 2026-07-23 05:22:39

Excerpt

By 2024, Slack’s data platform had accumulated 700+ SSH-based operators orchestrating critical data pipelines. We’re talking daily search indexing that processed terabytes of data, analytics jobs powering business intelligence, the whole shebang. Every single one of these jobs required direct SSH access to production AWS Elastic MapReduce (EMR) clusters. We had a massive security surface, and we couldn’t move forward on any infrastructure modernization. Not ideal.

We needed to eliminate SSH entirely. The solution? Migrate all 700+ jobs to a REST-based architecture. This is the story of how we killed SSH entirely, across 8 data regions, with zero downtime.

How We Got Here

Slack’s data platform was built around 2017 with a straightforward pattern. Airflow, our data pipeline orchestrator, needed to run jobs on EMR clusters, and SSH was the most direct path. Connect to the EMR master node, execute a command, done. Simple.

# The old way - simple, but problematic
task = SSHOperator(
    task_id='run_spark_job',
    ssh_conn_id='emr_master',
    command='spark-submit /path/to/job.py',
)

This pattern proliferated across the platform. Teams built custom SSH-based operators for different use cases (because hey, if SSH works for Spark, why not everything else). By the time we took stock, we had 700+ jobs in production running everything from MapReduce jobs to AWS CLI commands to custom Python scripts.

It worked. But it came with some potential problems.

The Real Cost of SSH

Potential security risks included:

  1. Direct SSH access to compute clusters increases the potential attack surface
  2. Key distribution and rotation across orchestration workers adds operational overhead
  3. Achieving fine-grained audit granularity typically requires correlating logs across multiple systems
  4. Permission management can grow complex, often requiring dedicated security groups and custom configurations

Operations were painful:

  1. Jobs ran directly on EMR master nodes instead of being distributed, causing resource contention
  2. When Kubernetes pods restarted, SSH connections broke and jobs failed
  3. Long-running jobs became “zombies” that kept executing after their connections terminated
  4. No reliable way to determine if a job succeeded or failed when connections dropped (not ideal when you’re processing terabytes)

We were blocked:

  1. Couldn’t start the path for Spark on Kubernetes nor EMR on AWS Elastic Kubernetes Service (EKS) (required eliminating SSH dependencies first)
  2. Couldn’t complete our Whitecastle initiative because we needed to move the last main-account EMR clusters to child accounts
  3. Couldn’t implement proper job monitoring and observability

An example problem: 

The Search Infrastructure team’s pipeline builds Solr search indexes from terabytes of data daily. This pipeline powers Slack’s search functionality. Any disruption affects search quality for millions of users. And it was relying on SSH-based job submission with all the reliability problems mentioned above. Not great.

Understanding the Foundation: REST-Based Job Submission

Before diving into the solution, let’s establish what REST-based job submission actually means (and why it matters).

The Problem with SSH

When you SSH into a machine and run a command, you’re creating a direct, stateful connection. If that connection drops (say your Kubernetes pod restarts), the command might keep running, might fail, or might leave orphaned processes hanging around. You’ve got no reliable way to reconnect and check status. It’s like hanging up mid-phone call and hoping the other person finishes the conversation.

The REST Alternative

Modern compute engines (YARN, Trino, Snowflake) expose HTTP APIs for job submission. Instead of maintaining a connection, you:

  1. POST a job request → receive a job ID
  2. GET job status using the ID → check if it’s running, completed, or failed
  3. DELETE the job → cleanly cancel, if needed

The job lifecycle is managed server-side. Your client can crash and restart, and the job keeps running while you can still query its status. Much better.

The YARN Piece

For Hadoop workloads (MapReduce, Spark, Hive), YARN is the resource manager with a REST API for job submission. But here’s the catch: YARN’s API is designed for Hadoop jobs. What about the 300+ CLI-based jobs running arbitrary shell commands like aws s3 sync or hadoop distcp?

That’s where YARN Distributed Shell comes in. This was the key breakthrough that made this whole migration possible.

The Breakthrough: YARN Distributed Shell

Migrating Spark and Hive jobs was more straightforward. Spark has the Livy REST API and Hive has HiveServer2. But MapReduce jobs and the 300+ CLI-based jobs running arbitrary shell commands? Those were the hard parts. They didn’t have ready-made REST APIs.

We brainstormed multiple approaches. Our requirements were clear:

  • Simple REST-based solution: fits naturally into our architecture
  • Existing authentication and authorization mechanisms: no custom security layer to build and maintain
  • Open-source protocols: leverage standard YARN APIs, not proprietary solutions
  • Minimal complexity: no building and maintaining custom job execution infrastructure

Some ideas we considered:

  1. Building a custom wrapper service to execute commands remotely
  2. Using remote execution frameworks like Ansible or Salt
  3. Creating a new job type in YARN from scratch

All of these felt too complex, required custom security implementations, or introduced new dependencies we’d have to maintain. Not great options.

Then we discovered YARN’s Distributed Shell. It’s a little-known feature (org.apache.hadoop.yarn.applications.distributedshell.ApplicationMaster) that allows any shell script to run in a proper YARN container with resource allocation and lifecycle management. And here’s the kicker: it was already part of YARN, used the same REST APIs, and required no custom security layer. It was perfect.

Here’s how it works:

1. Upload your command to S3

For example, we could upload the following script (command.sh) to s3://bucket/

# command.sh
aws s3 sync /tmp/data/ s3://bucket/output/

2. Submit to YARN with Distributed Shell configuration

{
  "application-type": "MAPREDUCE",
  "am-container-spec": {
    "commands": {
      "command": "{{JAVA_HOME}}/bin/java org.apache.hadoop.yarn.applications.distributedshell.ApplicationMaster ..."
    },
    "environment": {
      "DISTRIBUTEDSHELLSCRIPTLOCATION": "s3://bucket/command.sh",
      "DISTRIBUTEDSHELLSCRIPTLEN": "548",
      "DISTRIBUTEDSHELLSCRIPTTIMESTAMP": "1768529627000"
    }
  }
}

3. YARN allocates a container, downloads the script, and executes it:

Yarn manages:

  1. Proper resource limits (memory, vCores)
  2. Container isolation
  3. Retry and fault tolerance
  4. Clean cancellation
  5. Proper logging through YARN UI

This architectural decision unlocked the migration of all SSH-based jobs. Not just Hadoop workloads, but any shell command. Whether it was aws s3 sync, hadoop distcp, or custom Python scripts, they could all run in proper YARN containers. Game changer.

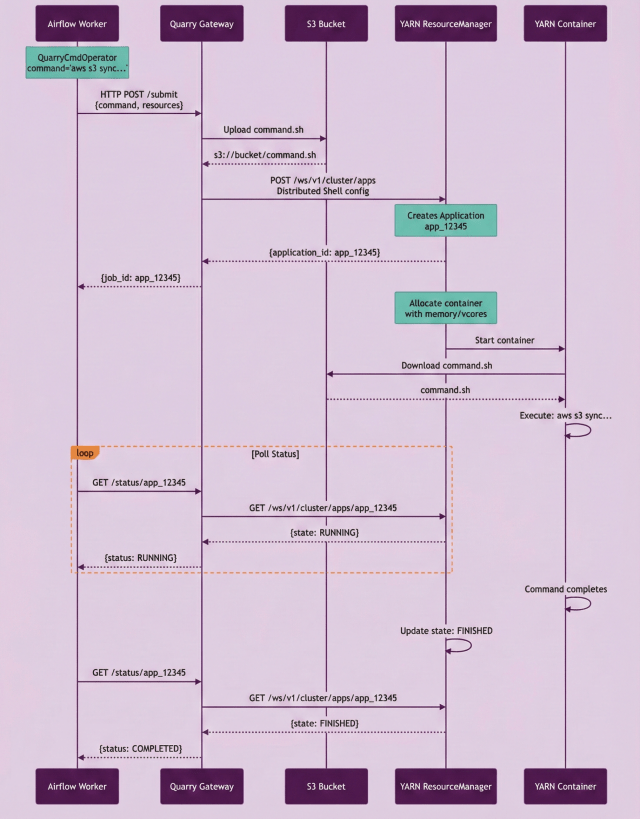
YARN Distributed Shell job submission flow

Figure 1: YARN Distributed Shell job submission flow showing how arbitrary shell commands are executed in YARN containers through Quarry.

The Solution: Quarry

Now that we understand the advantages of REST-based job submission and how we can migrate each existing job type, we’re just missing one thing: an orchestrator.

Enter Quarry, Slack’s REST-based job submission gateway. Quarry was originally built to provide a unified interface for submitting jobs across multiple compute engines (EMR/YARN, Trino, Snowflake). It already solved authentication, reliability, and observability challenges. For SSH deprecation, it turned out to be exactly what we needed.

What Quarry Does

Quarry sits between various services and compute engines (Airflow being the biggest user), handling:

  1. Authentication: Service-to-service tokens instead of SSH keys
  2. Job submission: REST APIs to YARN, Trino, and Snowflake
  3. State tracking: Server-side monitoring of job status
  4. Lifecycle management: Clean cancellation and cleanup through REST APIs
  5. Observability: Structured logs, metrics, and tracing for all job submissions

The Architecture Shift

Before:

Airflow → SSH Connection → EMR Master Node → Execute Command

After:

Airflow → Quarry REST API → YARN ResourceManager → EMR Container

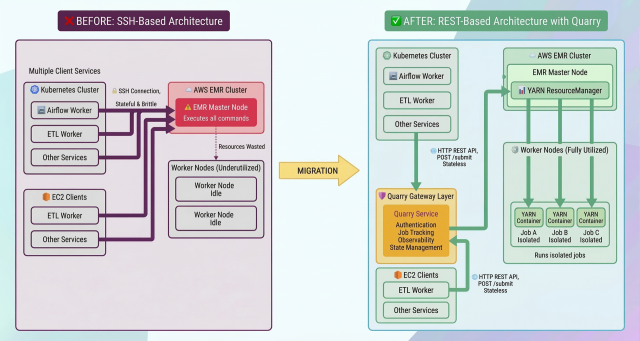
Instead of establishing SSH connections, Airflow operators make HTTP requests to Quarry. Quarry submits jobs to YARN and polls for status. If an Airflow pod restarts, the job keeps running, and Quarry maintains the connection.


Architecture comparison showing the shift from SSH-based direct execution to REST-based job

Figure 2: Architecture comparison showing the shift from SSH-based direct execution to REST-based job submission through Quarry and YARN.

The Quarry Advantage

With YARN Distributed Shell support, Quarry became our universal job submission gateway. Whether you’re running a Spark job, a Hive query, or a simple shell script, it all goes through the same REST API.

No SSH credentials. No direct cluster access. Just REST API calls with proper authentication and server-side job tracking.

The Migration Journey

We knew from the start this wasn’t going to be a quick fix. We had 700+ production jobs across 8 independent data regions, each with unique network configurations and data sovereignty requirements. Critical workloads, like search indexing, couldn’t tolerate any downtime. So yeah, we needed a plan.

The Approach: Incremental and Phased

Phase 1 – Proof of Concept: Started with pilot jobs to validate the Quarry-based approach. Built the first Quarry operators and tested in dev environments.

Phase 2 – Security Review: Engaged security teams to plan credential elimination and ensure the REST-based approach met security requirements.

Phase 3 – OKR-Driven Execution: Made it a Key Result with executive visibility. This created accountability and kept it prioritized. We hit the 80% migration milestone during this phase.

Phase 4 – Bulk Migration: Heavy cross-team coordination to migrate remaining workloads across all regions. Multiple teams (Search Infrastructure, Data Engineering & Analytics, ML Services) worked in parallel.

Phase 5 – Final Cleanup: Completed overlooked DAGs and deprecated all legacy SSH-based operators. Achieved 100% completion.

Migration by the Numbers

  • 700+ jobs migrated across 7 operator types
  • 8 independent data regions with coordinated rollouts
  • 5 teams transitioned to new operators
  • Zero downtime for business-critical services
  • Completed in 3 quarters, from initial pilot to 100% SSH elimination

The Challenges We Hit

No migration this size goes smoothly. Here are the biggest obstacles we ran into (and how we dealt with them).

Challenge 1: Virtual Memory Check Failures

During migration of a data export DAG, we hit unexpected failures. Jobs that’d been running fine via SSH were now failing with vmem (virtual memory) check errors. What gives?

The root cause: SSH commands ran directly on the master node, bypassing YARN’s resource enforcement entirely. Quarry submits jobs properly to YARN, which actually enforces resource limits. The vmem check was rejecting containers that exceeded virtual memory limits (which SSH had been quietly ignoring).

The fix: Following AWS best practices, we disabled vmem checks across all clusters:

"yarn.nodemanager.vmem-check-enabled": "false"

AWS explicitly recommends this because virtual memory accounting in Linux can be unreliable, and physical memory limits are sufficient. (Also, it’s worth noting that vmem checks have been a source of spurious failures for years in the Hadoop ecosystem.)

Lesson learned: When migrating from SSH to proper YARN submission, expect to encounter resource limit issues that were previously invisible. SSH hides a lot of problems. Test thoroughly in dev environments before production rollout.

Challenge 2: Network Segregation and EKM Connectivity

During migration of dev search infrastructure jobs from one dev cluster to a staging analytics cluster, a task failed with an EKM (Enterprise Key Management) connectivity timeout. Great.

Error: com.amazon.ws.emr.hadoop.fs.shaded.com.amazonaws.SdkClientException:

Unable to execute HTTP request: Connect to sts.amazonaws.com:443 failed: connect timed out

The root cause: the original cluster had network routing configured to reach the necessary key management endpoints. The staging analytics cluster, operating in a stricter network segment, did not have equivalent connectivity and correctly so. The failure surfaced a hidden dependency on network topology that wasn’t captured in the job’s configuration.

The fix: We moved search infrastructure tasks to a dev ETL cluster with proper routing to dev services. For tasks requiring production Hive catalogs, we kept them in staging. We also scaled up the dev ETL cluster to handle the additional workload.

Lesson learned: Network topology matters. Like, really matters. Understand network segregation and account boundaries before deciding which cluster runs which jobs. Dev jobs need dev network access, prod jobs need prod network access. The migration revealed hidden dependencies that SSH had been quietly papering over.

Challenge 3: Multi-Region Complexity

Slack operates EMR clusters across 8 independent data regions to support data sovereignty requirements. This meant the SSH deprecation wasn’t a single migration. It was effectively 8 parallel migrations, each with its own special set of challenges. Fun times.

The Complexity

  • Configuration management: Each region required separate Quarry configurations, cluster endpoints, and network routing rules
  • Testing overhead: Every code change needed validation across all 8 regions before production rollout (multiply your testing time by 8)
  • Staggered deployments: Couldn’t deploy to all regions simultaneously. Had to roll out region by region.
  • Region-specific issues: Network configurations, data sovereignty rules, and cluster versions varied by region

Our Approach

  • Validated changes in a single pilot region (typically US-based for faster iteration)
  • Documented region-specific configuration requirements
  • Built region-aware Quarry operators that could handle regional differences
  • Rolled out to remaining regions incrementally, learning from each deployment
  • Maintained separate tracking for each region’s migration progress

Lesson learned: Multi-region infrastructure significantly multiplies migration complexity. The effort isn’t just N times harder. It’s N times harder with unique failure modes for each region. Budget extra time for cross-region coordination and region-specific debugging. (Seriously, budget more time than you think.)

The Results

We achieved 100% SSH elimination. Every production job now runs through Quarry with REST-based submission. Here’s what we gained.

Security Wins

Eliminated SSH access to all production EMR clusters across 8 independent data regions, which massively reduced our attack surface. We replaced SSH key distribution with service-to-service token authentication, and gained proper audit trails through REST API logging. Every job submission now has structured logs through Quarry. No more “who ran that command?” mysteries.

This also enabled completion of our Whitecastle initiative by allowing us to migrate the last AWS main account EMR cluster to a child account. Bonus: we simplified compliance by removing special security group configurations and the complex permission management that SSH access required.

Operational Improvements

Master node resource contention: eliminated. All non-Hadoop jobs now run in distributed YARN containers with proper resource allocation instead of competing for resources on the master node.

Job reliability: dramatically improved. Jobs survive client Kubernetes pod restarts because Quarry maintains server-side job tracking. No more zombie processes. Jobs terminate properly when cancelled through REST APIs. We gained proper lifecycle management with clean cancellation and cleanup.

Observability: transformed. Structured job status, logs, and metrics are now available through Quarry’s API. We can track jobs across their entire lifecycle, see YARN container logs, and actually debug issues with proper tooling instead of SSH-ing into boxes and hoping for the best.

Future Enablement

The REST-based architecture unblocked critical initiatives:

  • Spark on Kubernetes migration now possible (no SSH dependencies to migrate)
  • Modern infrastructure patterns enabled (REST-based architecture aligns with cloud-native practices)
  • Easier team onboarding (simpler, more maintainable Quarry operators vs. complex SSH configurations)
  • Platform evolution (decoupled Airflow from EMR infrastructure details)
  • Standardized job submission (consolidated all job submission through Quarry, making future changes easier)

With two years of production experience since completion, the architectural decisions have proven sound. The REST-based approach delivered on its promises: better security, operational stability, and infrastructure flexibility. No regrets.

What We Learned

What Worked Well

  1. Incremental migration approach: Dev → GovDev/CommDev → Prod rollout minimized risk at every step. We migrated jobs by operator type rather than trying to convert everything simultaneously. This allowed us to learn from each migration and refine our approach for the next batch.
  2. Strong team collaboration: Multiple teams working together seamlessly across search, analytics, data engineering, ML, and marketing domains. Prompt code reviews kept momentum high. Regular communication in shared channels kept everyone informed.
  3. Analytics-driven progress tracking: We created an Analytics dashboard to track migration progress across all regions. Querying the Airflow database to identify remaining SSH-based tasks made it easy to see which teams/DAGs still needed migration. This data-driven approach kept the project moving.

What We’d Do Differently

  1. Earlier network topology mapping: We discovered network segregation issues (like the EKM connectivity problem) pretty late in the migration. Understanding Whitecastle account boundaries and network routing upfront would’ve saved us some pain. Next time: document network topology and dependencies before starting cluster migrations. Don’t assume SSH’s simplicity means everything will “Just Work” when you swap it out.
  2. Earlier resource limit testing: The vmem check issue caught us by surprise late in the project. We should’ve tested YARN resource limits against an SSH baseline way earlier in the process. Recommendation: Include resource limit testing in the initial pilot migration phase. SSH bypasses a lot of stuff, and you want to know what that stuff is before it bites you in production.
  3. Better communication about operator restrictions: When we restricted SSHOperator to prevent new usage during the final migration phase, some teams weren’t aware. Better advance notice to all Airflow users would’ve prevented confusion and friction. Internal communication is hard, but it matters.

Best Practices for Large-Scale Migrations

  1. Build monitoring before you migrate: Set up tracking dashboards early so you always know what’s left to migrate. Airflow database queries made it easy to identify remaining work. Progress visibility kept the project moving.
  2. Test in multiple environments: Dev, CommDev, and GovDev testing caught environment-specific issues before production. Network segregation issues only appeared when testing across account boundaries. Don’t skip environment-specific testing. Hidden dependencies will absolutely bite you.
  3. Progressive operator deprecation: We deprecated operators one at a time (CrunchExecOperator, then S3SyncOperator, etc.). Each deprecation was its own mini-project with testing and validation. While it was slower than migrating everything at once, it greatly mitigated the risk of the migration.

Acknowledgments

We wanted to give a shout out to all the people that have contributed to this journey:

  • Gage Gaskin
  • Deepak Agarwal
  • And to all the teams that successfully transitioned their pipelines to the new architecture


Interested in taking on interesting projects, making people’s work lives easier, or just building some pretty cool forms? We’re hiring!

Apply now
show more
Slack AI: The Path to Multi-Cloud
Feed: Engineering at Slack (https://slack.engineering/feed/)
Published: 2026-05-28 14:15:20 | Created: 2026-07-23 05:22:38

In early 2023, Slack faced a foundational challenge: serving Large Language Models (LLMs) at enterprise scale with the security, reliability, and performance our customers expect. Over three years, we evolved from basic infrastructure to orchestrating a sophisticated multi-cloud architecture. We didn’t just want shiny new models; we needed a system resilient to regional outages and GPU scarcity. Our journey moved through four distinct phases, shifting from reactive infrastructure management to proactive, multi-vendor orchestration.


Phase 1: The SageMaker Era

When we built the initial stages of Slack AI, AWS SageMaker was the natural starting point. It was a managed ML Serving platform that offered the key things that we were looking for: Security, FedRamp compliance, model availability and control. We were able to leverage a sophisticated escrow virtual private cloud (VPC) strategy to establish a strict zero-knowledge environment: our data remained private to Slack, and the provider’s proprietary model weights remained inaccessible to us.

To maximize uptime for a global user base, we deployed these containers across multiple AWS regions. This required our teams to manage the operational lifecycle, including cross-region IAM roles, balanced routing across model endpoints, proactive capacity planning, and auto-scaling logic.

The Operational Reality

While SageMaker provided the necessary security, the overhead was immense. We faced three primary taxes:

  • Scaling Latency: Initialization times prevented instantaneous scaling.
  • Hardware Scarcity: Enterprise-grade Nvidia GPUs, such as the A100 (Ampere architecture) and the emerging H100 (Hopper architecture) instances, were often unavailable.
  • Over-Provisioning: Maintaining idle resources to meet peak SLAs.

By early 2024, we mitigated these via On-Demand Capacity Reservations (ODCR) and proactive, cron-based scaling. However, this reinforced a hard truth: we were spending too many engineering cycles on plumbing. To scale, we needed automated capacity, not manual coordination.

Feature Lag

As the AI ecosystem and feature usage accelerated, newer and higher quality models emerged quickly. While we were maintaining a custom serving solution on SageMaker, AWS was heavily prioritizing Amazon Bedrock, its purpose-built managed LLM service.

Hosting Anthropic models via an escrow VPC led to a “catch-up” cycle. Model iterations and optimizations often debuted on Bedrock weeks or months before SageMaker availability. For Slack, where staying at the bleeding edge of model quality is a competitive necessity, this gap became a significant driver for our next architectural evolution.


Phase 2: Migrating to Amazon Bedrock for Agility and Access

By mid-2024, AWS Bedrock had matured significantly. It had achieved FedRamp Moderate compliance and also promised the same security posture that we required. The decision to migrate was a strategic pivot as it offered three immediate advantages:

  • Operational Simplicity: We moved away from having to scale individual GPU instances to a fully managed AWS service.
  • Immediate Model Access: We eliminated any LLM model feature lag by gaining access to the latest models very quickly after LLM Providers made them publicly available.
  • Infrastructure Efficiency: Bedrock introduced Provisioned Throughput (PT) and On Demand (OD) infrastructure options, allowing us to tailor compute to specific use cases. We utilized PT for interactive, latency-sensitive features like channel summaries, while leveraging OD for bursty, scheduled workloads like Recap to eliminate costs for idle compute.

Understanding Provisioned Throughput

In the Bedrock ecosystem, capacity is measured in Model Units (MUs). Each MU provides a deterministic amount of throughput, measured in tokens per minute. Shifting from GPU instances to MUs allowed us to abstract away the hardware and focus entirely on raw throughput. To minimize migration risk, we prioritized provisioned throughput infrastructure first, leaving on demand infra as a fast follow.

The Zero Incident Migration

We executed the transition through a multi-stage migration strategy:

  • Compliance: Secured Legal, Security, and FedRamp sign-offs before rerouting production traffic to maintain our existing high bar for data privacy.
  • Capacity: Conducted extensive load tests to map the exact number of Model Units (MUs) required to match our SageMaker baseline across diverse traffic profiles.
  • Quality: Used A/B testing and evaluation frameworks to compare environment outputs side-by-side, verifying both quality and latency parity.
  • Rollout: Implemented gradual traffic shifts via feature flags and instant rollback capabilities, ensuring 100% availability during the switch.

Achieving Operational Maturity

The migration to Bedrock delivered immediate, compounding wins for our engineering teams and our customers:

  • Engineering Efficiency & Enhanced Experience: By offloading the burden of self-managed infrastructure, we freed our engineers to focus on model performance and feature quality. Because Bedrock serves as the primary launchpad for new LLMs, we were able to deliver model upgrades and quality improvements to users weeks or months earlier than was possible on SageMaker, directly enhancing the user experience across the entire Slack AI suite. A prime example was our ability to quickly upgrade the AI Search features to new high-reasoning models, which led to more precise, context-aware answers.
  • Architectural Simplicity: We successfully moved away from the “infrastructure plumbing” of endpoint management, GPU instance lifecycle, and complex capacity reservation coordination. In this new model, we simply requested quota from AWS, they provisioned the MUs, and we served traffic. This allowed us to shift from reactive scaling to a strategic forecasting technique. By projecting our needs several weeks out, we gave our account teams ample time to secure capacity, ensuring we were always ahead of the demand curve.
  • The “Zero-Incident” Standard: Switching an entire backend while serving live traffic can sometimes be a recipe for disaster. We avoided that by being borderline obsessed with parity, and achieved zero customer-facing incidents. We didn’t just run unit tests; we ran massive load tests and shadow requests to find the exact “Model Unit” count that matched our old setup. We used feature flags to slowly bleed traffic over, so if anything looked even slightly off, we could yank it back in seconds. It wasn’t magic – it was just a lot of cautious plumbing.

This solidified a core Slack AI engineering principle: measure first, migrate gradually, and monitor continuously.

The Final Efficiency Gap

While Provisioned Throughput was a massive leap forward for predictable, consistent workloads, it wasn’t perfectly optimized for the workloads. We encountered two primary efficiency hurdles:

  • The Over-Provisioning Cycle: Our infrastructure needs are very closely aligned by the global workday traffic patterns. To ensure a snappy experience during the massive US East and West Coast morning surges – when users lean heavily on AI Summaries and Search to catch up on activity – we had to maintain a high baseline of MUs. While we saw steadier, lighter usage during the APAC and EU mornings, we had to provision for that absolute global peak. This meant we were often paying for significant underutilized capacity during the troughs between regional handoffs and over the weekends, creating a persistent efficiency gap.
  • The Commitment Lock-in: Provisioned Throughput often required commitments of one to six months. In the fast-moving world of LLMs, where a state-of-the-art model can be superseded in weeks, these commitments effectively slowed down our ability to upgrade. Even when a superior model was released, we often chose to wait for our existing commitments to expire before migrating.

These challenges led us to our next evolution: finding a way to balance the reliability of provisioned capacity with the economic and technical flexibility of On-Demand scaling.


Phase 3: Transitioning to Bedrock On-Demand

With high confidence in Bedrock and mature monitoring, we moved to close the final efficiency and quality gap. Historical analysis revealed that feature usage fluctuated with business hours, leaving some idle capacity overnight.

Rather than maintaining a static footprint for 24/7 peak capacity, moving to on-demand infrastructure allowed us to solve the idle capacity problem. It gave us the architectural agility to support highly variable workloads without the friction of manual over-provisioning. For features with a 10x variance between peak and off-peak hours, the efficiency gains were substantial. More importantly, it removed the technical bottleneck we faced in Phase 2: because we were no longer locked into multi-month commitments, we regained the freedom to migrate features to different models. This meant that as soon as a more performant model dropped and passed our internal quality and metrics bars, we could pivot our infrastructure to support it within a day, rather than waiting months for a contract to expire.

The Hybrid Strategy: Optimizing for Performance and Fluency

We didn’t simply flip a switch and move everything to On-Demand. To balance efficiency with a premium user experience, we implemented a Hybrid Routing strategy. We kept high-volume, latency-sensitive features on dedicated capacity (Provisioned Throughput) to ensure a consistent “snappy” feel. Simultaneously, we moved asynchronous, bursty workloads – like nightly Recaps – to On-Demand capacity. To bridge the gap, we engineered a Spillover Pattern: if a sudden surge pushed us beyond our reserved limits, excess requests automatically “spilled over” to on-demand endpoints, ensuring we never dropped a request due to capacity ceilings.

Navigating the Trade-offs of On-Demand

Shifting to On-Demand traded rigid pre-planning for architectural agility, eliminating manual capacity management. By utilizing Bedrock’s ability to route across different US regions based on real-time availability, we were able to find capacity dynamically while adhering to our regional data boundaries. However, this flexibility introduced a new set of variables that we had to solve for:

  • Service Level Variability: Unlike the dedicated nature of PT, OD operates on a shared-resource model, which typically carries different uptime characteristics.
  • Regional Capacity Orchestration: Success with OD relies on the cloud provider’s ability to manage demand across their entire customer base in specific regions, rather than having specific hardware units explicitly reserved for Slack.
  • Concentration Risk: Relying too heavily on a single provider’s on-demand pool meant that any service-wide blip could have the potential to impact entire Slack AI features simultaneously.

Engineering for Resilience

To mitigate these risks, we didn’t just accept the trade-offs – we built a more intelligent AI Platform abstraction. We developed a model hierarchy for every AI feature, allowing our system to automatically fall back to different models if the primary model reached a degraded state. Some examples of regressions are elevated time to first token latencies, throttling errors, and downward trend in customer feedback.

This hierarchy was a game-changer for model quality and reliability. If a specific model was underperforming or hitting limits in one region, the platform would reroute the request in real-time to another healthy endpoint. From the customer’s perspective, the experience remained seamless; they continued to receive high-quality results without ever knowing a complex failover had occurred behind the scenes.

While this internal fallback logic significantly increased our service resilience, it also highlighted two strategic gaps. First, no matter how many failovers we engineered within a single cloud, we remained susceptible to any potential provider-wide outage. Second, the AI landscape is moving with incredible velocity and remains highly fragmented. The state-of-the-art model for a specific task – whether it’s summarization, reasoning, or high-speed extraction – can change in a matter of weeks, and these leading models are often exclusive to specific cloud providers. Relying on any single vendor meant we might be artificially limiting our access to the highest-quality technology available. To ensure Slack AI always provides the best possible experience, we need the flexibility to go wherever the best models are while simultaneously meeting our security, compliance, and privacy standards.

As Slack AI scaled to millions of users, we realized that true enterprise-grade reliability and a “best-of-breed” model strategy required looking beyond any single provider. This realization was the primary catalyst for our latest evolution: the move to a Multi-Cloud architecture.


Phase 4: Expanding to a Multi-Cloud Strategy Ecosystem

We recognized that providing a world-class AI experience required the best of every ecosystem. By early-2026 we officially expanded our footprint to include Google Cloud Platform (GCP) Vertex AI, not just as a failover for redundancy, but as a strategic engine to accelerate product innovation through access to a broader catalog of state-of-the-art models. Our goal is simple: ensure Slack remains the most intelligent place to get work done. This move wasn’t done just for the sake of complexity, but rather a strategic shift driven by four key factors:

  • Infrastructural Redundancy & High Availability: For a mission-critical Digital HQ, uptime is the primary metric. While we continue to rely on third-party LLM models as a cornerstone for their consistency and reliability, a multi-cloud footprint eliminates provider-level large scale infrastructural disruptions as a single point of failure. If an entire cloud ecosystem experiences a regional or platform-wide disruption, our traffic can be rerouted to a separate, healthy stack without service interruption.
  • Model-to-Feature Optimization: The “one-size-fits-all” approach to LLMs quickly hits diminishing returns. By expanding our catalog to include multiple models, we gained the ability to match the specific latent strengths of a model to the specific requirements of a feature. This granular optimization led to immediate performance gains:
    • ~10% improvement in quality metrics for complex reasoning tasks.
    • ~67% reduction in latency for high-velocity, low-token workloads.
  • Access to Innovation: The AI landscape moves at extreme velocity with frequent vendor exclusivity. Multi-cloud ensures we are ready to integrate with the latest breakthroughs regardless of where they are hosted while upholding our compliance, privacy, and security promises.
  • Dynamic Workload Orchestration: Beyond simple failover, multiple providers allow for sophisticated traffic shaping. We can route requests based on real-time telemetry – evaluating not just provider health, but which endpoint offers the optimal performance profile for a given workload at that exact moment. This enhanced our infrastructure from a static resource into a dynamic, intelligent routing layer.

The Integration Journey

Building a production-ready GCP integration was a massive cross-functional effort. It required tight synchronization across teams such as Security, Risk and Compliance, Trust and Integrity, AI Quality, Legal, and Cloud Providers to ensure our data boundaries remained ironclad across the board. Expanding to GCP Vertex AI turned our infrastructure into a strategic engine for product innovation. Rather than being limited to any single provider’s catalog, we can now granularly match specific features to the models best suited for them – balancing factors like context window, latency, and reasoning capabilities. To make this a reality, we solved cold start engineering hurdles by implementing secretless authentication and an API Normalization layer that translates disparate provider signals into a unified language for our application logic.

Architectural Deep Dive: The Intelligent Routing Layer

The core technical challenge was building a system that abstracted away provider complexity. By enhancing our abstraction layer into an Intelligent Routing Layer, we ensured that users receive the fastest, highest-quality response available. If one model or provider slows down, the system instantly reroutes the request to a better-performing alternative, making the underlying complexity completely invisible to the user while maintaining a seamless experience. It contains:

    • Metric-Driven Model Selection: We use our internal quality metrics to determine the optimal model for each feature. For instance, if our benchmarks show a specific LLM outperforms others for “Recaps,” the router directs traffic accordingly. Crucially, we always designate backup models for every feature; if the primary choice doesn’t meet our performance or quality thresholds in real-time, the system knows exactly where to go next.


    • Experimental Rules & A/B Testing: This capability has fundamentally changed our release velocity. When we wanted to test the latest LLMs, after our security and compliance verifications, for our Recaps feature, we were able to route a percentage of traffic to the new model with minimal code changes and an incredibly fast turnaround time. This allowed us to validate performance in the wild and tighten our feedback loop from weeks to days.


  • Automated Circuit Breaker & Health Monitoring: To move beyond manual failovers, we implemented an automated Circuit Breaker pattern. This system acts as a real-time watchdog, constantly monitoring health signals at the endpoint level. If a specific provider or model begins to exhibit signs of distress – such as an elevated Time to First Token (TTFT), a spike in 5xx error rates, or crossing a latency p90 threshold – the circuit “trips.” Once tripped, the routing layer automatically diverts traffic to a healthy alternative model based on the use case and complexity. Crucially, the breaker enters a partial-open state, allowing a small, controlled trickle of requests to reach the degraded endpoint. As the endpoint demonstrates sustained health, the system dynamically expands this trickle, incrementally ramping traffic back up until the breaker is fully “closed” and normal operations resume. This ensures a graceful recovery without overwhelming a stabilizing service.

The Multi-Cloud Reality

Running a multi-cloud footprint at our scale is a major technical undertaking. It’s a conscious trade-off: we gain immense flexibility but it requires a much more sophisticated approach to how we manage our systems:

  • API and Behavioral Friction: Each provider has its own unique API patterns, proprietary error codes, and distinct rate-limiting behaviors. We had to build a robust normalization layer to ensure that a “Rate Limit Exceeded” from one provider and a “Throttling Exception” from another were handled identically by our application logic.
  • Operational Monitoring Complexity: To avoid blind spots, we couldn’t rely on the native dashboards of each cloud. We had to build a unified monitoring stack that integrates telemetry from the multiple clouds into a single view, ensuring our on-call engineers can diagnose issues without pivoting between consoles.
  • The Attribution Challenge: Accurately tracking the cost per feature internally becomes significantly harder when workloads are shifting dynamically between clouds. This required deep instrumentation across multiple billing systems to maintain financial transparency.
  • The On-Call Knowledge Gap: Our engineers can no longer be specialists in just one ecosystem. To support the platform effectively, they need to be provider agnostic, possessing deep expertise in the infrastructure patterns and networking nuances that span multiple major cloud environments. This shift requires a broader skill set to troubleshoot and maintain a distributed, multi-vendor footprint.

While multi-cloud increases operational overhead, the trade-off is a superior service. We have removed single points of failure, improved quality benchmarks by matching features to specific model strengths, and gained the strategic leverage to adopt new innovations the moment they hit the market.


Reflections on the Path to Multi-Cloud

We arrived at a multi-cloud architecture not for the sake of complexity, but to enhance Slack’s standards for product innovation and reliability. Looking back, five themes stand out:

1. Scaling safely requires XFN parity

The biggest hurdles in scaling AI aren’t just technical; they also include legal, risk, compliance, and security related tasks. Achieving deep alignment between these teams and engineering is what allowed us to scale to millions of users without compromising our trust standards.

2. The abstraction layer is a core requirement

As seen in our Phase 2 move, the most critical decision wasn’t which model to use, but how we built the logic around them. Agility and speed to market are our primary competitive edge.

3. Treat architecture as a living document

Managed services mature monthly. Because we remained provider-agnostic, we can now adopt breakthroughs in latency or reasoning without a total rewrite.

4. Reliability requires provider agnosticism

Internal failovers aren’t enough. Our move in Phase 4 to a multi-provider stack ensures Slack stays online even during any potential platform-wide cloud disruption.

5. Redefining the meaning of “Failure”

An LLM service that is “up” but slow is effectively broken. By treating different dimensions of data such as p90 spikes as soft failures and feedback trends, our routing layer ensures users have a snappy experience.


The future of enterprise AI is multi-cloud, multi-model, and dynamically orchestrated. By prioritizing portability and staying close to the market, we haven’t just built a way to use AI – we’ve built a platform that harnesses the best the industry has to offer the moment it arrives. We’re looking forward to seeing what we build next!

Interested in taking on interesting projects, making people’s work lives easier, or just building some pretty cool forms? We’re hiring!

Apply now
show more
Agentic Testing: Where Agents Fit in the E2E Testing Stack
Feed: Engineering at Slack (https://slack.engineering/feed/)
Published: 2026-06-11 14:15:28 | Created: 2026-07-23 05:22:38

Abstract

Agent-driven end-to-end (E2E) tests add a new exploratory layer to testing, but should they replace traditional deterministic tests? We ran more than 200 agentic E2E workflows using the Playwright MCP, Playwright CLI, and agent-generated Playwright tests in test workspaces using non-production data to find out how agentic testing could fit into both our and your testing stacks.

1. From Journeys to Goals

Traditional end-to-end tests validate a specific journey through the UI.

click → click → type → assert

Agent-driven tests instead validate whether a goal can be achieved, often expressed as an instruction (e.g. “send a thread message”):

goal → agent adapts → verify result

This difference can be summarized simply:

Tests enforce journeys. Agents verify goals.

Across our agentic test runs, the overall workflow remained consistent (e.g. login → search → result → clear), but the exact sequence of actions varied. In practice, agents took different paths to reach the same outcome:

  • Different input methods (clicking a search suggestion vs pressing Enter)
  • Different navigation patterns (reopening search vs reusing existing state)
  • Additional or skipped steps (extra clicks, snapshots, or intermediate actions)

Agents can still validate intermediate steps when needed, but this flexibility comes with tradeoffs in reliability, cost, and execution time, which we explore in the next sections.

The Problem

Agent-driven E2E testing looks promising, but it raises a real question: can something that costs $15–30 per run and takes over 10 minutes actually fit into modern testing workflows?

At first glance, the answer seems like no. But in 200+ runs, we found they are fundamentally different from traditional tests. They can be highly reliable and have a clear place in the testing stack.

This is largely due to recent advances in large language models, which enable agents to write code, debug failures, and interact directly with user interfaces. These capabilities introduce a new execution model for testing, but where they fit in existing E2E workflows is not always clear.

2. Our Experiment

To understand how agent-driven tests can fit into E2E workflows, we ran 200+ automated executions across multiple configurations to measure reliability, execution speed, and cost.

Execution models

We evaluated three different approaches:

  • Agent + Playwright MCP
    The agent interacts with the browser through the Playwright MCP, using predefined browser actions (clicking elements, typing input, reading DOM state, etc…) with persistent context (DOM snapshots and logs)
  • Agent + Playwright CLI
    The agent interacts with the browser by running Playwright CLI commands via the shell, executing one step at a time and deciding the next action based on the updated UI state
  • Generated Playwright Tests
    An AI agent generates deterministic Playwright test code from a natural language description, executes it as a standard E2E test, and iteratively refines it until it passes

Experiment Setup

  • Agent model (Playwright MCP / CLI): Claude Sonnet 4.5
  • Model used for generated Playwright tests: Claude Opus 4.6
  • Execution: non-interactive Claude Code (claude -p)
  • Browser tooling:
    • Playwright MCP
    • Playwright CLI
  • Environment setup: 
    • Slack Dev API MCP
    • All experiments were conducted in test workspaces using non-production data

Test flows

We used two flows to cover different levels of complexity. These flows were kept consistent across all experiments to allow for direct comparison.

  • Thread Reply (simple)
    A shorter workflow (~15–20 steps) involving creating a channel, sending a message, replying in a thread, and verifying thread state
  • Search Discovery (medium complexity)
    A longer workflow (~25–30 steps) involving entering search queries, navigating results, moving between views (search, channels, threads), and verifying expected outcomes

Input formats

For agent-driven approaches, we evaluated two input types:

  • Natural language (NL)
    Detailed, human-readable instructions describing the workflow and expected outcomes (e.g. “reply in a thread, and verify it appears in All Threads”), often written as step-by-step lists
  • Structured YAML
    The same workflow expressed in a structured format, with explicit steps, actions, targets, and expected outcomes

The difference is not the level of detail, but how that detail is represented: natural language requires the agent to interpret and map instructions to actions, while YAML defines that mapping more explicitly.

Each configuration was run 20 times. The experiment matrix below shows the full setup:

Experiment Matrix

Exp Execution Model Input Type Tools Thread Reply Search Discovery
1 Agent (Playwright MCP) NL MCP 20 20
2 Agent (Playwright MCP) YAML MCP 20 20
3 Agent (Playwright CLI) NL CLI 20 20
4 Agent (Playwright CLI) YAML CLI 20 20
5 Agent (Generated Tests) NL Code 20 20

3. What We Observed

Summary of Results

Before diving into individual metrics, here’s a quick look at how the different approaches performed overall across both natural language and YAML-based executions.

Approach

Failure rate 

(thread reply)

Failure rate 

(search discovery)

Avg runtime
Agent (Playwright MCP) 0% ~12% ~5–8 min
Agent (Playwright CLI) ~12% ~20% ~9–11 min
Generated Playwright Tests ~8% ~48% ~3 min

The following sections break down these results by individual metrics.

Reliability

One of the clearest patterns we saw was how reliability changed as flows became more complex. 

Across the agentic Playwright flows, the Playwright MCP was the more reliable configuration, consistently achieving near‑zero failure rates on simple scenarios and remaining within 0–12% on more complex flows. In contrast, the Playwright CLI showed higher failure rates (roughly 12–20%), with many failures caused by execution issues such as authentication handling, navigation timing, and session instability rather than model reasoning.

Generated Playwright tests performed reasonably well on simple flows (~8% failure rate), but degraded significantly on more complex workflows (~48%). These tests were not entirely wrong, as they typically progressed through 70-80% of the flow before breaking on a final interaction or assertion. Failures were primarily caused by variability in UI state and abstraction mismatches. These tests were generated from loosely specified natural language flows and reused existing page object abstractions, which sometimes interfered with precise element targeting in more complex scenarios.

Overall, the reliability gap widened with increasing complexity, suggesting that the agent-native execution models like MCP provide more stable behavior as flows get harder. One likely reason is how each model handles state. MCP keeps a live, stable view of the app, while CLI rebuilds state from snapshots at each step. As flows get longer, small inconsistencies in how the UI is interpreted or timed can accumulate and lead to failures. Another likely factor is in-session context. In MCP-based runs, the agent appears to reuse successful interactions from earlier steps in the same flow, while CLI can feel more like starting from scratch at each step. We didn’t explicitly measure this, but it may also contribute to the gap.

Speed

When it came to speed, generated tests were consistently the fastest.

Approach Average Duration
Generated Playwright Tests ~3 minutes
Agent (Playwright MCP) ~5–8 minutes
Agent (Playwright CLI) ~9–11 minutes

For generated tests, the runtime includes both test generation and execution. Each test was generated once and executed five times, and the numbers above reflect the average duration per run. In practice, the raw execution was much faster: ~32 seconds for thread reply and ~45 seconds for search discovery. In CI environments where tests run repeatedly, the one-time generation cost becomes negligible, allowing deterministic tests to scale more efficiently.

Agent-driven workflows pay this cost on every run. Each step typically involves:

  • Observing the UI state
  • Reasoning about the next action
  • Executing the action and validating the result

Adaptability

Another pattern we saw was how differently agents navigate the UI.

Only about 20% of runs followed the exact same sequence of actions. In most runs, the agent discovered different valid UI paths to reach the same goal.

For example, while still reaching the same final state, the agent might:

  • Open menus in a different order
  • Select slightly different UI elements
  • Use alternate navigation flows

To measure this, we compared action signatures across runs. An action signature is the ordered list of tool calls and UI actions performed by the agent (e.g. API calls, browser clicks, form interactions). Action signatures were normalized before comparison: parameters, wait/snapshot actions, and equivalent tool variants (e.g. fill vs type) were collapsed so that only meaningful differences in the action sequence were counted.

Across runs, most action sequences differed even when the final outcome was correct. This highlights a key difference between approaches: traditional E2E tests enforce a single deterministic journey through the UI, while agents explore the interface and verify whether the goal state can still be reached.

Cost and Where It Comes From

Cost stood out in our experiments. Agent-driven runs were typically $15–30 per execution, compared to much cheaper traditional test runs.

To understand where this cost came from, we analyzed token usage across different execution models by running the same search discovery flow.

Approach Tokens
MCP (Opus 4.6) ~3.8M
MCP (Sonnet 4.5) ~3.5M
MCP (Haiku 4.5) ~5.7M
CLI (Opus 4.6) ~6M
Code Gen (Opus 4.6) ~7M

The first thing that stood out was that how the agent was executed mattered more than which model powered it. Haiku did use more tokens than Sonnet or Opus in our runs, but all of the MCP-based approaches still used fewer tokens overall than the CLI and Code Gen approaches for the same flow.

To understand why, we looked at how Claude Code executes agent sessions. The underlying API is stateless and every turn re-sends the full system prompt plus the entire conversation history. This means cost is not driven by model output, which is negligible, but by how quickly context accumulates and how many turns the agent takes to complete the flow.

Approach Turns
MCP (Opus 4.6) ~40
MCP (Sonnet 4.5) ~40
MCP (Haiku 4.5) ~60
CLI (Opus 4.6) ~85
Code Gen (Opus 4.6) ~70

On average, CLI took 85 turns compared to MCP’s ~40-60 because each browser interaction was split across multiple commands, such as actions, waits, snapshots, reads, and element lookups. MCP combined interaction and state return into a single round trip. Each additional turn pays the full system prompt tax plus re-sends all prior conversation context.

What fills that context? For MCP and CLI approaches, browser snapshots are the primary payload. Playwright MCP returns accessibility tree snapshots as part of its browser interaction responses, and these accumulate in the conversation window across all subsequent turns. For Code Gen, the accumulated context comes from test runner output containing full error traces, assertion failures, and DOM state on each retry cycle.

In our analysis, the majority of the cost was retransmission of previously seen content. Only a small fraction of tokens represented new information per turn. The biggest factors affecting cost are turn count and context growth rate rather than model reasoning or output generation.

At this stage, we focused primarily on reliability and behavior, so token usage was not optimized. Opportunities to reduce cost include prompt caching, context compaction, and reducing snapshot frequency. 

Due to the cost, agent-driven testing may currently be better suited for targeted debugging or exploratory testing than for high-frequency CI execution, although cost may improve with future models and tooling.

Infrastructure Matters (MCP vs CLI)

Another important takeaway was how much the execution environment affected reliability, not just the model itself.

Approach Failure rate
Agent (Playwright MCP) 0–12%
Agent (Playwright CLI) 12–20%

Most failures in CLI-based runs came from authentication and navigation issues (sign-in errors, timeouts, and session instability), suggesting that many failures were caused by the execution layer rather than the agent’s reasoning.

The Playwright MCP provides structured browser primitives and tighter integration with the agent’s tool-calling workflow, while CLI-based execution introduces additional layers between the agent and the browser.

Parallelization also differed. MCP runs were easy to execute concurrently, while CLI-based runs were difficult to parallelize in our setup and were mostly executed sequentially.

These results suggest that reliability, speed, and cost depend not just on the model, but also on how stable and well-designed the execution environment is.

Execution Capability Boundaries

Our experiments focused on single-session UI workflows. More complex scenarios, such as cross-workspace flows or workflows that open multiple browser windows, introduce a different set of challenges where the choice of execution model may matter as much as the agent itself.

Both MCP and CLI-based approaches could support these workflows, but with different tradeoffs. MCP may run into cost issues as observation loops grow over longer flows, while CLI-based approaches may introduce additional coordination complexity when managing multiple browser sessions, on top of the higher token usage observed in our experiments. We did not explore these scenarios here, but they are an important consideration for teams evaluating agent-driven testing.

4. Where Agentic Testing Fits in the Testing Pyramid

So where does agent-driven testing actually fit?

Rather than replacing existing approaches, it adds a new capability on top of them.

Deterministic E2E Tests

Best suited for fast, repeatable regression checks in CI.

  • Human-written or AI-generated tests
  • Fast, repeatable, and CI-friendly
  • Low operational cost
  • Enforce a specific journey through the UI 

Agentic Testing

Agent-driven workflows operate differently from deterministic tests. Instead of executing a predefined script, agents operate from a goal: they observe the UI, reason about the current state, and determine how to reach the desired outcome.

  • Exploring complex UI behavior
  • Debugging flaky workflows
  • Reproducing production bugs

Testing Pyramid with Agentic Layer

Testing pyramid with four layers: Unit Tests, Integration Tests, E2E Testing, and Agentic Testing

From a system perspective, agentic testing still operates at the same level as E2E tests, validating real user workflows through the UI. The difference is in how those workflows are executed. 

For this reason, the most effective testing strategies of the future will combine both. Deterministic tests provide a stable foundation for CI, while agentic testing adds a distinct layer at the top of the testing pyramid for exploration, debugging, and validating complex behaviors.

5. Acknowledgements

Huge thanks to the DevXP AI team for building and supporting tools like Claude Code, as well as the metrics infrastructure that made these experiments possible. That foundation made it much easier to run, analyze, and iterate on hundreds of executions.

Special thanks to our managers, Dave Harrington and Vani Anantha, for supporting experiments at a scale that definitely kept the token counters busy, and briefly put us on our internal token usage leaderboard.

We also want to thank the Frontend Test Frameworks team for their help throughout the process, from early ideas to validation and feedback. Special thanks to Lucy Cheng, Natalie Stormann, Roopa Thanisraj, Ilaria Varriale, and Crescencio Zul for their thoughtful input and support along the way.

Interested in solving real problems, making developers’ lives easier, or just building some pretty cool tools? If this kind of work excites you, whether it’s pushing the boundaries of testing or building agent-driven systems and rethinking developer workflows, we’re hiring.

Apply now


show more
Shipyard: How We Built Slack’s Next-Generation EC2 Platform
Feed: Engineering at Slack (https://slack.engineering/feed/)
Published: 2026-07-14 16:10:08 | Created: 2026-07-23 05:22:38

Over the past few years, we’ve been on a journey to modernise how we run Amazon Elastic Compute Cloud (EC2) instances at Slack.

In our first post, Advancing Our Chef Infrastructure, we shared how we moved from a single Chef stack to a resilient, multi-stack setup with versioned cookbook deployments and safer promotion workflows. This afforded us far more reliability and operational control across tens of thousands of EC2 instances.

Subsequently, in Advancing Our Chef Infrastructure: Safety Without Disruption, we tackled deployment risk without the need for teams to rewrite their cookbooks. By introducing split production environments, signal-based Chef runs, and smarter rollout mechanisms, we dramatically reduced the impact radius of failures while keeping our legacy platform stable. These changes allowed us to safely operate our EC2 ecosystem at scale while we plan the future at a relaxed pace.

But as we kept improving, a bigger truth became clear.

Even with safer rollouts, better orchestration, and stronger guardrails, the old model—continuously updating long-lived EC2 instances—was hitting its limits. Service-level deployments were tricky, infrastructure drift was inevitable, and coordinating changes across multiple layers added complexity. Containers solved this for some classes of workloads, but not everything could migrate easily.

We needed a new approach—one that brought modern deployment practices like immutability, progressive rollouts, and automated safety directly to EC2 instances.

Enter Shipyard.

Shipyard is Slack’s next-generation EC2 platform. It treats infrastructure as deployable artifacts rather than endlessly mutable instances. It gives teams service-level deployment primitives, tight integration with our build and orchestration systems, and the confidence to update infrastructure with the same safety and predictability we expect from modern app delivery platforms.

In this post—the third chapter of our journey—we’ll explain why we built Shipyard, the principles behind its design, and how it represents a fundamental shift in how we think about running EC2 instances at Slack.

What Shipyard Provides

Shipyard is designed to bring modern infrastructure principles to EC2 instances while preserving the flexibility teams expect from EC2. Rather than focusing on configuration management as the center of the system, Shipyard shifts responsibility toward build pipelines, deployable artifacts, and automated safety mechanisms.

Some of the key capabilities of the platform include:

Multi-Architecture and Multi-OS Support

The platform is designed from the start to support multiple CPU architectures, including both AMD64 and ARM-based Graviton instances, with support for multiple operating systems such as Ubuntu, RHEL, and Amazon Linux. This flexibility allows teams to optimize for cost, performance, or compatibility without needing separate platform implementations.

Shipyard is particularly valuable for workloads that cannot migrate to containers, such as infrastructure components, Kubernetes worker nodes, and our egress network stacks.

Metrics-Driven Deployments with Safety Controls

Each service integrates with our deployment orchestration system called Gondola to enable progressive rollouts with metric based automated safety checks. Deployments can automatically halt based on service health signals, or automated rollback to previous known good versions.

Fast and Predictable Provisioning

Shipyard uses a layered image approach, inspired by how containers work. A shared “golden” base image provides common infrastructure components, and service-specific images are built on top of that foundation. This minimizes work at launch time, so instances can come online quickly and predictably across regions.

Simplified Configuration Management

One of the biggest architectural shifts is how we use configuration management.
Previously, instances would run scheduled Chef jobs that periodically checked and reapplied configuration, so any manual or unexpected changes would be reverted back to the desired state.

In the new model, configuration is applied during well-defined lifecycle phases like image baking and initial provisioning, rather than being continuously enforced in the background. Configuration tools are mainly used to deploy services, not to constantly modify the entire system. This reduces background load, avoids unintended overwrites, and makes system behavior much easier to reason about, since instances aren’t continuously changing over time.

Real-Time Inventory and Fleet Visibility

Shipyard comes with a new inventory system called Peekaboo, giving us near real-time visibility into the state of our EC2 fleet. Instead of relying on Chef Server as the source of truth, Peekaboo taps directly into cloud events and instance metadata, providing better telemetry across environments. It can even track instances from non-Shipyard deployments, giving us a complete view of the entire fleet in one place.

We built Peekaboo using AWS EventBridge, OpenSearch, and Lambda. It has everything teams need: a UI to explore the fleet, an API for integrations, and a command-line interface (CLI) for quick command-line checks. By centralising this information, it removes the guesswork and gives us a single place to view and manage EC2 instances.

Short-Lived, Continuously Refreshed Instances

To keep our EC2 instances secure and truly immutable, each instance has a limited lifespan and is automatically rotated on a regular schedule. This means our fleets are always fresh; potential vulnerabilities have less time to cause issues, and teams focus on replacing instances rather than making in-place changes.

Golden Base Images: Introducing slack-zero

At the foundation of the Shipyard is a shared base image called “slack-zero.” This is the core machine image built by Slack’s Compute Platform Team and maintained collaboratively with our security and monitoring teams.

The slack-zero image contains:

  • Operating system baseline and hardening
  • Networking and service discovery configuration
  • Monitoring and security agents
  • Common tooling and foundational system configuration

You can think of slack-zero similarly to how teams use a base Docker image or how we start from a vendor-supplied Ubuntu image and layer additional components on top. It provides a standardised, trusted foundation that every service inherits, while still allowing teams to customize their own runtime environment on top of it.

Base images are treated as immutable but ephemeral. When foundational components need to change—such as a security patch, monitoring update, or networking improvement—a new slack-zero image is produced. Downstream service images can then rebuild on top of the updated base to inherit the latest fixes and improvements.

To build slack-zero, we use AWS Image Builder rather than Packer. Image Builder provides several built-in advantages over our previous approach with Packer, including:

  • Lifecycle Management: Old AMIs are automatically cleaned up using lifecycle policies, helping reduce storage costs.
  • AWS System Manager (SSM) Parameter Publishing: Each new slack-zero image updates an SSM parameter that indicates the latest available AMI for an account. Service pipelines read this parameter to ensure they always build on the most up-to-date base.
  • Event-Driven Automation: When a slack-zero image finishes baking successfully, EventBridge and Lambda automatically trigger downstream pipelines in service owner accounts so dependent images can be rebuilt.
  • Built-in Testing: Before an AMI is published, Image Builder launches temporary instances and runs validation tests. This ensures every image is verified before distribution, reducing risk and increasing confidence in production rollouts.

Together, these capabilities allow us to continuously evolve the platform foundation while keeping adoption friction low for service teams.

Service Images

Each service team builds its own AMIs using slack-zero as the foundation. This allows teams to control their runtime environment while inheriting standardized platform components maintained by the platform organization.

Service image pipelines define:

  • What software is installed
  • How the service is configured
  • What happens during instance initialisation for this service

Because most configuration is baked directly into the image, instances launch quickly and consistently, minimizing configuration drift and ensuring predictable behavior across the fleet.

By combining the immutable slack-zero base with service-specific layers, Shipyard provides both platform stability and team-level flexibility, enabling services to innovate safely without sacrificing operational consistency.

Baking and Provisioning

Shipyard separates instance preparation into two distinct phases: baking and provisioning.

During the bake phase, we install packages and include configuration that is consistent across environments. This ensures every instance starts from a fully prepared, known-good state with the majority of work already completed before launch.

Environment-specific settings—such as secrets, regional configuration, or deployment metadata—are applied during the provisioning phase when the instance boots. This step is intentionally lightweight and typically involves only dropping configuration, retrieving secrets, and starting services.

By moving heavy operations like package installation into the bake phase, instances can become operational in seconds rather than minutes. This fast startup time is critical for scaling events, rolling deployments, and automated instance replacement.

This provisioning model provides a strong balance of consistency, speed, and flexibility: images deliver a stable baseline, while minimal provisioning adapts instances to their runtime environment without introducing drift.

Deployments and Fleet Updates

When teams need to roll out changes, they build a new Amazon Machine Instance (AMI) and then run their deployment pipeline to roll it out. Instead of patching existing instances, fleets are updated through controlled replacements, keeping everything consistent and predictable.
For Auto Scaling Groups (ASGs), we use AWS Instance Refresh, and Kubernetes worker fleets use Karpenter for lifecycle-driven updates. Services with special deployment needs can use alternative rollout executors. Our global deployment orchestrator, Gondola, supports these patterns, giving teams flexibility while keeping a consistent deployment experience.

Emergency Fixes and Rapid Deployment Pathways

For urgent situations, the platform allows targeted configuration changes on running instances, but these are meant for emergencies only. Affected instances are expected to be replaced afterward via regular deployment pipelines.
Our emergency workflows use AWS Systems Manager with a predefined document to run selected Chef recipes, letting teams quickly apply critical fixes. Once stable, instances are cycled to return to the intended immutable state.

What Do Customer Pipelines Look Like?

Customer pipelines in Shipyard can have multiple stages, giving teams flexibility to design them around their service and operational needs. Each stage in Gondola represents a deployable unit, such as an ASG, a Kubernetes cluster, or a group of EC2 instances.
For example, the Egress Team runs separate canary and production ASGs in each availability zone, with deployment stages ordered so updates flow sequentially. Gondola updates each stage, monitors key metrics, and rolls back automatically if problems are detected, preventing issues from spreading.
This staged approach, combined with Shipyard’s fast provisioning and immutable AMIs, lets teams safely deploy complex updates at scale while maintaining observability and control.

What Happens in the Gondola Stage?

When Gondola builds an artifact, it produces a deployable package for a service with two main parts:

  • The AMI to roll out across the fleet
  • The Chef artifact containing versioned recipes associated with a Git commit

Gondola treats these together as a single deployable unit. Each stage uses a service-defined executor to perform the rollout:

  • ASG-based deployments: The executor updates the launch template with the new AMI and configuration. Chef code is packaged to Amazon Simple Storage Service (S3), and new instances use a baked-in bootstrapper to fetch the correct artifact and run the relevant recipes. Configuration metadata ensures only the right configuration is applied.
  • Kubernetes worker fleets: The executor tells Karpenter which AMI to use and provides the same configuration metadata. Nodes bootstrap in the same way, ensuring consistent provisioning.

For services with special deployment needs, Gondola makes it easy to add new executors. This lets Shipyard support different deployment models while keeping artifact handling and provisioning consistent and predictable.

By combining AMI updates, versioned configuration artifacts, and metadata-driven bootstrapping, Gondola ensures every instance gets the correct software and configuration for its role, no matter how it’s deployed.

Simple Pipeline

Shared Responsibility

Shipyard’s layered image model is built on a clear shared responsibility between platform teams and service teams. The Compute, Security, and Monitoring teams manage the base layer, making sure it includes all global infrastructure components, security patches, and essential configurations. Service teams then build their own AMIs on top of this base, adding the software and settings specific to their service.

Whenever the Compute team rolls out a fix or update—whether it’s a security patch, a monitoring agent update, or a networking change—service teams are responsible for incorporating the updated base into their own AMIs. This way, every service image automatically benefits from the latest improvements and security fixes from the shared base.

This approach lets each team focus on what they do best while keeping the fleet consistent, secure, and reliable. The diagram below illustrates how the base and service layers work together and highlights where each team’s responsibilities lie.

Flow diagram showing the division of responsibilities between global service teams and service owners. The diagram highlights which tasks and processes each group owns, clarifying the points where responsibilities are separate and where collaboration is required.

A Caveat on Immutability

While Shipyard instances are mostly immutable, there is an important exception: secrets. Each instance runs the Consul Template service, which allows us to roll out updated secrets from Vault without cycling the fleet. This means that, although packages and configurations are fixed at bake time, sensitive data like credentials or certificates can still be updated dynamically. Our infrastructure is semi-immutable: the core system and service layers remain consistent, but critical runtime secrets can be refreshed safely as needed. This approach balances stability, predictability, and security across the fleet.

The Reaper

The Reaper evaluates two primary inputs. First, it consumes signals from external systems—such as security tooling or AWS EC2 events—that indicate an instance may no longer be in its desired state and should be considered “tainted.” Second, The Reaper performs periodic checks to identify instances that have been running for longer than their allowed lifespan. When either condition is met, the instance is scheduled for replacement according to its service policies.

This approach helps reduce configuration drift, limit exposure to vulnerabilities, and reinforce the principle that infrastructure should be updated by redeploying rather than modifying systems in place. The result is a platform that is more reliable, auditable, and predictable.

For example, while manual remote access remains available for emergency scenarios, manually accessing a production-class node will generate a signal that marks the instance for eventual replacement, supporting our immutable infrastructure goals.

The Reaper also integrates with Peekaboo to track instance age across the fleet. Once a node reaches its maximum lifespan, it follows the same graceful replacement workflow.

Looking ahead, we plan to make the system more context-aware so that only meaningful changes—such as software updates or configuration drift—trigger replacement, while read-only or low-risk actions do not create unnecessary churn.

Taming the Reaper

The Reaper is designed not only to enforce lifecycle policies, but also to give teams control over how replacements occur. Built-in rate limiting allows service owners to define how many instances can be replaced at a time, scoped by service, region, or availability zone, preventing sudden capacity impacts.

For emergency situations, we provide a global pause mechanism—the “big red button.” By placing a control object in S3, teams can temporarily halt all Reaper activity across the fleet. This provides a safe and immediate way to stop instance cycling during incidents or periods of elevated risk.

We also provide a CLI that allows service owners to manage rate limits, inspect configuration, and activate or release the global pause when needed.

In addition, controlled access mechanisms such as short-lived SSH certificate workflows can be used for break-glass scenarios where deeper investigation is required, while still maintaining overall lifecycle safety commitments.

Together, these capabilities make the Reaper both predictable and controllable—enforcing instance immutability by default while giving teams the visibility and safeguards they need to operate confidently.

How Do We Test Changes?

Both platform teams and service owners need a safe way to test cookbook changes before merging a pull request, so we built a system called Ship Quick—a developer workflow that runs a realistic bake-and-provision test on real infrastructure.
Developers run a CLI command from their cookbook repo, where a YAML file defines the test cases. Ship Quick packages the cookbook, uploads it to S3, and sends a workflow message to a queue. A fleet of worker instances—managed by a lightweight process called Longshoremen—picks up the job, detaches from its Auto Scaling Group, runs the Chef workflow, streams logs back to the CLI, and then terminates (unless the developer chooses to keep it for debugging).
We run Longshorem in two separate worker fleets because of how our bootstrapping works. The vanilla Ubuntu fleet is used to bake and test the base slack-zero image—it can’t build on top of itself, so starting from a clean Ubuntu AMI is required. The slack-zero fleet is for service team cookbooks, which depend on the pre-baked slack-zero AMI. Running tests from this fleet ensures provisioning is validated against the same foundation used in production.
Splitting the fleets this way helps ensure each layer is tested against the correct base. Both fleets scale automatically with demand, and slack-zero workers are continuously updated to the latest images so tests always reflect the current production environment.
Teams that build images in their own AWS accounts can also provision dedicated worker fleets and route Ship Quick jobs to them, ensuring isolation while keeping the same workflow.

Diagram of the Shipyard Longshorem instance test workflow. It shows the Shipyard API triggering test instances, messages flowing through SQS queues, and Auto Scaling Groups managing the test instances, illustrating how these components coordinate to run and validate tests.

What’s Next?

So far, Shipyard has been working really well for short-lived services, and we’re actively onboarding teams from the legacy EC2 platform. Our next challenge is long-lived instances—things like Slack’s data nodes, singleton services like GitHub Enterprise, or third-party business technology instances such as Atlassian JIRA. These can’t be cycled quickly, so we need ways to patch and update them safely while ensuring the Reaper handles them correctly.

We’re collaborating closely with service teams to develop new deploy executors in Gondola for these longer-lived workloads. As more teams adopt Shipyard, we’ll keep iterating on tooling, developer workflows, and the overall deployment experience to meet the platform’s diverse needs.

Future posts in this series will cover the challenges we encounter as Shipyard evolves and take a closer look at its components—including the Shipyard API, image pipelines, developer workflows, and our inventory system. Stay tuned!

show more
Page 1 of 1 (8 total items)