RSS Feeds

The Grails Plugin Has a New Home: Apache Grails
Feed: The JetBrains Blog (https://blog.jetbrains.com/feed/)
Published: 2026-09-01 12:02:33 | Created: 2026-09-01 12:34:55

The Grails plugin for IntelliJ IDEA (which provides framework-aware coding assistance, GSP tooling, and GORM integration) has moved to the Apache Grails project. The Apache Software Foundation (ASF), which already stewards the Grails framework, now owns the plugin’s source code, which lives in its new GitHub repository. On JetBrains Marketplace, the plugin is listed as Apache Grails, with the ASF as the official vendor.

Why Apache Grails

The people closest to a framework are in the best position to build its tooling. Both teams agreed that the Apache Grails project was the right home for the plugin, with the Apache Grails Project Management Committee (PMC) now overseeing development. With development in the Grails team’s hands, the plugin can evolve in line with the framework’s roadmap (including GSP tooling, GORM integration, and build toolchain updates) and follow a release cadence that the team controls. JetBrains can stay focused on core IDE and platform work while continuing to feature the plugin on Marketplace.

What’s changed

The release cadence and IDE compatibility are set by Apache Grails PMCnow, not by IntelliJ IDEA releases. Updates ship on the framework’s roadmap, and the Grails team builds, signs, and publishes them straight to Marketplace under its own vendor credentials. The PMC and community contributors are already reviewing PRs, merging fixes, and shipping releases independently. Build 262.0.0, which supports IntelliJ IDEA 2026.2, is already available.

What this means for you

Already using the plugin from Marketplace? No migration is required: Updates will continue to come from the new maintainers, and the plugin ID stays the same for now. Starting with 2026.2, however, the plugin is no longer bundled with IntelliJ IDEA Ultimate by default. If you cannot find the plugin in your IDE, install it from the Marketplace under its new Apache Grails listing. At JetBrains, we will continue to collaborate with the Apache Grails team and give them early notice of platform API changes.

Get Involved

Follow the project in the repository on GitHub, or visit the Apache Grails plugin listing on JetBrains Marketplace. Got feedback? Open an issue in the new repository or leave feedback on the Marketplace page.

We’ll keep featuring the plugin on Marketplace, and we’re looking forward to seeing where the Apache Grails team takes it from here.

show more
Authenticating TeamCity Builds to External Services With OIDC
Feed: The JetBrains Blog (https://blog.jetbrains.com/feed/)
Published: 2026-09-01 06:58:08 | Created: 2026-09-01 08:33:56

Static credentials in CI/CD environments are a significant source of security risks and operational overhead. They can be accidentally leaked through logs and build artifacts. And you can never be sure who’s copying, saving, or sharing them with others during the CI/CD setup process. In addition, they require regular rotation to meet security requirements.

That’s why many services, including major cloud providers, now support authentication with short-lived OIDC identity tokens, allowing CI/CD pipelines to authenticate without storing static credentials.

In this article, we will explain how OIDC authentication works and show how the new TeamCity OIDC JWT plugin enables your build configurations to authenticate securely to AWS, Google Cloud, and other services that support OIDC.

What is OIDC?

OpenID Connect (OIDC) is an authentication standard originally designed to verify user identities. However, many popular cloud providers and services, such as AWS and Google Cloud, use parts of the OIDC specification to authenticate workloads. This article focuses only on those parts.

The authentication flow starts when an identity provider (IdP) issues a cryptographically signed JSON Web Token (JWT) containing information about a workload. Each piece of information in the token is called a claim. Each token contains a validity period, an intended audience (the service or services the token was issued for), and an issuer URL. The issued token can then be presented to a third-party service (such as a cloud provider), which we will refer to as a token consumer.

When a token consumer receives a token, it uses the issuer URL to retrieve the metadata document ({issuer_url}/.well-known/openid-configuration). Among other information, this document includes a link to the issuer’s JSON Web Key Set (JWKS), which contains public keys used to verify token signatures. OIDC issuer URLs must use the https scheme, so the metadata document can only be served over HTTPS. Some consumers also support validation against a preconfigured set of keys instead, in which case the issuer does not need to serve the metadata document over the internet.

After retrieving the public keys, the consumer verifies the token signature against them. If the signature is valid, the consumer checks whether the token was issued for an expected audience and is currently valid (not expired). The validated token’s claims are then used by the consumer to authenticate the workload.

Some consumers accept IdP tokens directly. Others perform a token exchange and return service-specific temporary credentials for workloads to use.

To enable this authentication method for TeamCity builds, the server needs to act as an identity provider and issue tokens for them.

Introducing the TeamCity OIDC JWT Plugin

The new OIDC JWT plugin adds IdP capabilities required to issue tokens for third-party services that support OIDC, such as AWS and Google Cloud.

The tokens are signed using algorithms based on RSA or ECDSA. Signing keys can be rotated either from the web UI or with an authorized request to an HTTP endpoint. By default, key rotation does not affect running builds or invalidate previously issued tokens.

For publicly accessible TeamCity instances, the plugin provides the .well-known/openid-configuration document and a JWKS with the issuer’s public keys. It also features a configurable issuer URL for instances that are not accessible from the internet, allowing you to host these documents on a public HTTPS host without exposing the TeamCity instance itself.

Finally, the plugin provides an API that allows other plugins to add new ways to sign tokens. By implementing a simple interface, plugin authors can add support for external hardware security modules (HSMs) or other key management services, such as Google Cloud KMS.

Getting started

To use the plugin, install it from JetBrains Marketplace. The plugin requires Java 17 and supports TeamCity 2025.11 and later versions. 

The installed and enabled plugin can be configured via Admin | Integrations | OIDC Tokens. You can set the issuer URL (for instances inaccessible from the internet), configure signing settings, and manage signing keys.

Configuration changes may disrupt existing integrations. We recommend configuring the plugin before you set up OIDC for your builds. Once the plugin is configured, you can add build features that provide OIDC tokens.  

The OIDC Token (in build parameters) build feature is the easiest way to issue a token. It generates a token at the start of the build and stores it in the specified build parameter. The lifetime of the token is configurable. By default, it equals the build timeout or 10 minutes if no timeout is specified.

The feature allows you to issue a token for one or more audiences. When different services require separate single-audience tokens, add a separate build feature for each token.

With long-running builds, tokens issued at the start of a build may remain valid for longer than necessary. For such builds, there is the OIDC Token (on demand via HTTP request) build feature. It allows build scripts to obtain short-lived tokens during the build with an HTTP request. The lifetime of issued tokens is always 5 minutes and cannot be changed.

The build can then present the issued token directly to the target service or use it as part of that service’s authentication flow. 

The correct audience and token lifetime depend on the service you are integrating with. Consult the service’s official documentation for instructions on setting up OIDC authentication. You can also follow the setup guides we have for AWS and Google Cloud.

Learn more

Visit the plugin’s JetBrains Marketplace page for more information:

👉Check out the plugin👈

You can also explore the plugin’s GitHub repository, which contains the source code, an example JWT payload, and detailed usage documentation.

show more
Ensuring Code Compliance in Public Sector Software Projects
Feed: The JetBrains Blog (https://blog.jetbrains.com/feed/)
Published: 2026-09-01 07:54:55 | Created: 2026-09-01 08:33:56
Code compliance in the public sector

The public sector handles sensitive citizen data, which is why software projects built with secure coding are imperative to deliver high trust levels. Code compliance with data protection laws, financial governance standards, and various regulations and policies is an obligation that must be consistently met to maintain trust and accountability.

According to IBM’s Cost of a Data Breach Report 2026, the global average cost of a data breach is $4.99 million. That’s a lot of money for any organization in the public sector. Similarly, the Ponemon Institute and Globalscape’s report, The True Cost of Compliance with Data Protection Regulations, determined that the cost of non-compliance is 2.71 times higher than being compliant. Hardcoded credentials or insufficient input/output validation are common, costly issues, often caused by working at speed and incomplete validation checks.

Many issues create compliance problems, and poor code security is one of the biggest risks, which code maintainability can mitigate. Ensuring compliance also helps avoid the costs associated with productivity loss, financial penalties, legal fees, and settlements that can quickly add up after a breach.

Understanding the risks of non-compliance in the public sector when building and updating software and taking steps to ensure code compliance helps avoid financial and reputational damage.

Try Qodana

Public sector software compliance cheat sheet

Strict standards apply across public sector software for data protection, security controls, accessibility, and supply chain transparency. Compliance with specific regulations, frameworks, and standards is mandatory, but may vary depending on your location and the applicable policies.

Our cheat sheet helps developers working on public sector software understand potential compliance risks, the considerations to make, and how using a code quality tool can help ensure compliance. It outlines common issues for public sector software, so your development team can review its code quality against each factor before deployment to minimize any risks. 

Save time, stay safe, and ensure you’re not breaking any rules.

Compliance RiskDev ConsiderationCode Quality Tool Use
Non-uniform delivery quality breaches contract standards, resulting in disputes over “whose code failed”Inconsistent coding standards across contractors and subcontractorsAutomatic enforcement of centrally configured quality profiles across all teams
Institutional knowledge loss leading to undetected regressions in critical systemsDev teams change over long lifecycles, causing quality driftBaking continuous inspection into the CI/CD pipeline, regardless of who writes the code
Rising maintenance costs and risks breaching long-term supportability commitments in contractsUnchecked code smells, duplication, and complexity accumulateTrack technical debt metrics on an ongoing basis
Breach of secure development lifecycle mandates with potential data breaches exposing citizen dataInjection flaws, insecure deserialization, and unsafe input handlingStatic application security testing (SAST) detects known vulnerability patterns
Violation of identity and access management standards causes a credential leak riskHardcoded credentials or secrets in source codeSecret detection built into code scans
Non-compliance with data protection laws (e.g. GDPR), which require appropriate security measuresWeak or outdated cryptographyFlags insecure crypto implementations
Supply chain security failure, which breaches vulnerability management requirementsVulnerable open-source dependenciesDependency vulnerability scanning
Breach of procurement restrictions on acceptable licenses that cause IP/legal exposureLicense conflicts in dependenciesAutomated license compliance checks
Unsupported components in production mean incident response and patching obligations aren’t metOutdated libraries are no longer supportedDependency freshness tracking
Failing to produce evidence during compliance audits or contract milestone sign-offA lack of objective audit evidence for code quality/securityAutomated and time-stamped historical reports
Audit findings cite inadequate or inconsistent quality assurance processRelying on manual reviews as the sole compliance gateTool-generated reports replace subjective sign-off
Deliverable acceptance criteria breach and contractual SLA non-conformanceNon-compliant code progressing through the pipeline uncheckedQuality gates block merges/releases below the threshold
Business continuity risks during vendor/contractor handoverInherited/legacy code with unknown risk areasComplexity and risk for unfamiliar codebases surfacing
A breach of government IT policy restricts external SaaS/cloud dependenciesA need for on-prem/air-gapped toolingSelf-hosted deployment option

Code compliance risk 1: Security and data protection compliance

Failing to comply with security and data protection standards and regulations puts sensitive and personal information at risk of exposure. Public sector software processes large amounts of personal data. Aligning it with applicable security and data protection standards, such as the UK General Data Protection Regulation (UK GDPR) and the Data Protection Act 2018, is vital.

Requirements vary by country, too. For example, public sector bodies in EU countries must abide by General Data Protection Regulation (GDPR), a strict data privacy and security law, while UK central government departments and agencies are subject to the National Audit Office (NAO) standards. 

US agencies work within Federal Acquisition Regulation (FAR), Defense Federal Acquisition Regulation Supplement (DFARS), and Federal Risk and Authorization Management Program (FedRAMP).

The real-world impact for developers 

Developers must build privacy and defense procedures into the software development lifecycle (SDLC) from the start to protect sensitive data. Leaving it too late or considering security too close to testing and deployment can jeopardize privacy protection.

Using weak and outdated cryptography is another compliance risk, as it leaves public sector software vulnerable to attacks. Weak cryptography can also breach controls required under frameworks like ISO/IEC 27001 (Information Security Management), risking loss of certification and reputational damage.

Considering supply chain vulnerabilities and the accountability for personal data handled by third-party vendors is important, too. Third-party dependencies must be treated as active risks. Integrating a code compliance tool like Qodana into the IDE and CI/CD pipeline brings automated SAST checks, secret detection, and cryptography scanning directly into developers’ existing workflow, catching issues before they reach production.

Secure credential storage, explicit user-consent handling, penetration testing before deployment, and ongoing automated testing help with security and data protection compliance. This can ensure public sector software retains NCSC Cyber Essentials certification.

Code compliance risk 2: Contractual and procurement compliance

Public sector software can automate government purchasing and supplier agreements. This improves efficiency but may introduce compliance risks, such as service level agreement (SLA) non-conformance. Failure to comply with an SLA can result in contract termination and financial penalties.

Various regulatory guidelines cover contractual and procurement compliance. These include the FAR in the US and the UK Public Contracts Regulations 2015 (procurement law). Government departments can add specific rules and regulations, like the DFARS and the Cabinet Office Technology Code of Practice.

Potential risks include non-compliant code progressing through the pipeline unchecked, like committing an active API secret key to a feature branch and not running SAST, which can lead to a breach of deliverable acceptance criteria. Vague requirements and missing edge cases may cause this. It may also result in disputes over delivery quality across contractors due to siloed teams.

Open-source dependencies, risks and actions

Open-source dependencies often carry licensing terms too, such as copyleft clauses and commercial-use restrictions. These may conflict with procurement rules on acceptable software. An undetected license conflict can expose the public sector body to IP disputes or breach of contract. Automated license compliance scanning flags these conflicts at the dependency level, before they become a legal problem.

Developers should embed automated quality gates into the CI/CD pipeline, so non-compliant code can’t progress toward a contractual deliverable. This replaces manual sign-off with an objective and repeatable check that provides useful evidence if a dispute over delivery quality arises.

Code compliance risk 3: Audits and accountability

Failing to produce evidence during compliance audits results in unverified controls being treated as non-existent. For public sector software, this can lead to failed certifications and financial penalties. A digital paper trail is essential for objective audit evidence of code quality and security, ensuring accountability.

A reliance on subjective, manual sign-off alongside inconsistent findings from the quality assurance process risks audit failure. Lacking objective audit evidence for code quality and security also exposes public sector software to compliance failure and technical debt. Automated tools can replace subjectivity to help ensure compliance with relevant regulatory guidelines and audits.

The National Institute of Standards and Technology (NIST) provides guidelines for federal information systems and organizations, which apply to some public sector software in the US. There are also audit requirements of ISO/IEC 27001 and the National Audit Office (NAO) standards for public spending accountability in the UK.

Developers must automate audit reports, embedding automated controls within the SDLC to ensure compliance with audits. This also mitigates any risk from manual sign-off. Integrating testing and traceability into CI/CD pipelines creates a digital audit trail to help produce evidence during any compliance audit.

Code compliance risk 4: Long-term supportability and continuity

Public sector software projects, women on phone with paperwork

Public sector software failures can lead to critical citizen service outages. Long-term supportability enables the continuity of such software and the effective application of updates over time to maintain performance and security levels. It also helps compliance with relevant regulations and global standards, such as ISO 22301 (Business Continuity Management System)

Any public sector software that relies on open-source code is also at risk of being built on libraries that become outdated. Incident response and patching obligations won’t be met due to unsupported components. There are also business continuity risks during vendor or contractor handovers, as teams may inherit code with unknown risk areas, where the complexity of an unfamiliar codebase can hide problems until it’s too late.

Prioritizing quick fixes can create technical debt and breach long-term maintenance commitments. A short-term patch that isn’t built for long-term support often needs revisiting later. That future fix is usually costlier and more time-consuming than doing it properly the first time.

Developers should implement dependency freshness tracking to identify and use the latest stable version or patch release. This minimizes potential security risks due to using outdated libraries and ensures public sector software is up-to-date.

Keeping the number of external dependencies to a minimum also makes long-term supportability easier. Automated unit and integration tests help catch bugs before deployment, while static code analysis catches code errors early, making it easier to address them and ensure long-term supportability.

Code compliance risk 5: IT governance and infrastructure policy

Public sector software must meet security baselines and comply with various regulatory guidelines for IT governance. For example, the UK’s Government Cloud First policy ensures public sector organizations use public cloud services as the default when procuring new or existing IT and software solutions.

Government IT policy often restricts the use of external SaaS or cloud dependencies. Using non-compliant tooling puts sensitive public sector data at risk. This can violate FedRAMP (Federal Risk and Authorization Management Program), a standardized approach based on NIST guidelines that ensures cloud providers meet strict federal data protection rules.

IT infrastructure is also at risk of erosion due to institutional knowledge loss linked to the governance of long-running systems. When developers and staff leave without documenting context, workarounds, and the rationale for decisions, it can make understanding and maintaining the infrastructure difficult. 

Digital audit trails

A digital audit trail helps with ongoing infrastructure maintenance. Development teams can also consider on-premises and air-gapped tooling as a self-hosted deployment option for better code compliance.

These secure systems require no external cloud dependencies. Embedding automated guardrails into the SDLC helps achieve compliance through continuous scanning and policy-as-code.

Discover more about using Qodana for DevOps to help ensure code compliance in public sector software projects or try Qodana for 30 days.

Try Qodana

show more
Fine-Tuning SOTA Object Detection Models on Real-World Datasets
Feed: The JetBrains Blog (https://blog.jetbrains.com/feed/)
Published: 2026-08-31 13:50:29 | Created: 2026-08-31 14:33:55

In our previous blog post in this series, we discussed state-of-the-art models for object detection: the architectures, the theory, and what makes YOLO12, YOLO26, and RF-DETR tick. If you want the theoretical background on these models, start there.

This post is the practical follow-up: how to actually use these models, how to fine-tune them on diverse, specialized datasets that look nothing like their training data, and how to evaluate the results – all within PyCharm.

Why fine-tune at all?

Every pretrained detector you download was trained on some distribution of images, almost always COCO, which is ~118k training images of everyday scenes containing 80 common object categories (people, cars, dogs, chairs, etc.).

Real-world deployment data rarely looks like COCO. Things that object detection might actually be applied to, such as damaged industrial cables, bone fractures on X-rays, or densely stacked soda bottles on a shelf, are:

  • Out of vocabulary: “Bone fracture” is not one of COCO’s 80 classes, so the model literally has no output category for it.
  • Out of visual distribution: X-ray imagery, industrial close-ups, and heavily occluded shelf scenes differ drastically from consumer photos in texture, viewpoint, and object density.

Deploying a detector on off-distribution data therefore requires fine-tuning. But before we break the models, let’s establish that we get similar results on our hardware to the ones reported by developers.

The models

For the purposes of this experiment, we’ll focus on three current SOTA object detection families and examine two sizes of each model:

FamilyVariantsImplementation
YOLO12yolov12n, yolov12mOriginal authors’ repo
YOLO26yolo26n, yolo26mUltralytics PyPI package
RF-DETRRFDETRNano, RFDETRBaseRoboflow PyPI package

Sanity check: Reproducing COCO val2017 baselines

We’re going to be working with six pretrained checkpoints: Two different sizes of each of the three models. To check that these models are behaving as expected, we evaluated all of them on the full 5,000-image COCO validation dataset (val2017) to verify the numbers reported in the previous post:

ModelParams (M)mAP50mAP50-95Latency (ms)
YOLOv12-N2.550.55480.402123.9
YOLO26-N2.570.54980.395212.3
YOLOv12-M19.670.69530.525972.4
YOLO26-M21.900.69060.518113.9
RF-DETR Nano30.470.67500.483512.4
RF-DETR Base32.170.72100.532512.9

Three things stand out even before we leave COCO behind:

  1. Larger models (mostly) have better performance. RF-DETR Base leads (0.5325 mAP50-95), but the medium YOLOs get remarkably close (0.5259 / 0.5181) with ~10M fewer parameters.
  2. YOLO26’s NMS-free design pays off in throughput. YOLO26-N is the fastest model in the lineup (12.3 ms latency) at essentially the same mAP50-95 as YOLOv12-N, which, despite being the smallest model here, is considerably slower (23.9 ms latency). Attention is expensive. (If you want more detail on the model architectures and how they affect performance, see the previous blog post in this series.)
  3. RF-DETR Nano is not “nano” by parameter count (~30M – more than YOLO26-M), but it is well-optimized: With 12.4 ms latency, it is the second-fastest overall.

Published papers report optimized inference latency: That is, they measure the model’s forward pass in isolation, stripped of the surrounding stages of the object detection pipeline. We deliberately skipped that aggressive optimization so our numbers reflect what you’d actually see when deploying these models.

As a result, our latency figures don’t line up with the benchmarks in the models’ white papers. There are two main reasons for this:

  • Hardware: We used different hardware from the NVIDIA T4 GPU that serves as the de facto standard in object detection benchmarking.
  • Unoptimized computation graph: We ran the models in their native framework rather than converting them to TensorRT. TensorRT compiles a network into a hardware-specific engine, fusing layers, selecting the fastest kernels for the target GPU, and optionally running in reduced precision. That can cut latency substantially, but the resulting engine is tied to one GPU and requires an extra build step, so it doesn’t represent how these models perform out of the box.

Accuracy is a different story: While our latencies diverge from the published ones, our mAP50-95 results fall within reasonable noise bounds of the reported figures.

Now that we’ve seen what our pretrained models can do on COCO, the dataset they were trained on, let’s see what happens when they’re tested off distribution.

The datasets

For evaluation, we used RF100-VL, a large-scale collection of 100 multimodal datasets covering concepts deliberately chosen to be rare in object detection models’ pretraining data. These datasets contain exactly the off-distribution targets we care about. These targets also mirror common real-life applications for object detection, giving us a realistic test of these models’ capabilities out in the wild.

We picked three datasets that stress test the models in different ways:

DatasetDomainWhy it’s hardClasses
cable-damageTechnical/industrialFine-grained damage types on visually similar backgroundsbreak, thunderbolt
bone-fractureMedical (X-ray)Entirely different imaging modality; subtle featuresangle, fracture, line, messed_up_angle
soda-bottlesRetailHeavy occlusion, many near-identical instances per imagecoca-cola, fanta, sprite

Tutorial: Fine-tuning all three models in PyCharm 🙂

Step 1: Setting up the project

One of the first challenges we had to overcome in this project was that the three implementations do not share a compatible set of dependencies. In particular, the two different generations of YOLO require different versions of the ultralytics package. PyCharm offers a clean solution for this: one PyCharm project with three isolated uv environments – one per model family.

We’ll run our computations on a remote GPU. Configuring a remote interpreter in PyCharm follows the same workflow as a local one: the same dialog and the same dropdown as in the local case. Note that remote interpreters require PyCharm Professional; Community Edition supports local environments only.

Firstly, we need to instantiate our three uv virtual environments via:

cd yolov12 && uv venv .venv --python 3.11 

cd yolov26 && uv venv .venv --python 3.11 

cd rf-detr && uv venv .venv --python 3.11

Once your uv virtual environments exist, register each one as an existing interpreter. Go to Settings | Python | Interpreter, click Add Interpreter → Add Local Interpreter, choose Environment as Select existing, and point the interpreter field at that environment’s bin/python. PyCharm doesn’t create anything here, it just picks up the environment uv already built.

Repeat for each environment. From then on, switching is a matter of picking one from the Settings | Python | Interpreter dropdown, or from the interpreter widget in the bottom-right-hand status bar.

You can find the full list of dependencies required for each model in their respective project repositories. You can either install all the projects’ dependencies in PyCharm’s built-in Terminal tool window or install individual packages using the Python Packages tool window (including selecting specific versions of packages). You can access both of these tool windows by clicking the relevant icons in the lower left-hand corner of the PyCharm toolbar. 

For a step-by-step guide on setting up the environments for all three models, see our GitHub implementation of this tutorial.

Step 2: Getting the datasets

To obtain the out-of-COCO-distribution datasets, we can install our datasets via the rf-detr virtual environment, since it has roboflow as one of its core dependencies. We then set the Roboflow API key as an environment variable so that it is available to the API when downloading the datasets.

pip install roboflow

export ROBOFLOW_API_KEY="your_key_here" # you can get API key here: https://docs.roboflow.com/reference/authentication/authentication/find-your-roboflow-api-key 

After setting everything up, now you can run the Python script below to get the three datasets we’re going to use in our tutorial:

import os
from roboflow import Roboflow

api_key = os.environ.get("ROBOFLOW_API_KEY")

if not api_key:
    raise RuntimeError("ROBOFLOW_API_KEY is not set")

DATASETS = [
    "bone-fracture-7fylg",
    "cable-damage",
    "soda-bottles",
]

VERSION = 2          # RF100 projects are generally published at version 2
FORMAT = "yolov8"    # or "coco", "voc", "yolov5"
rf = Roboflow(api_key=api_key)
workspace = rf.workspace("rf100")

for slug in DATASETS:
    print(f"Downloading {slug} ...")

    try:
        project = workspace.project(slug)
        dataset = project.version(VERSION).download(FORMAT)
        print(f"  -> {dataset.location}")

    except Exception as e:
        print(f"  !! failed: {e}")

This script connects to the Roboflow cloud service via its Python API client and downloads three specified RF100 datasets in YOLOv8 format. It loops through each dataset, reports where successful downloads are saved, and prints an error if any download fails.

Step 3: Getting a zero-shot baseline by using pretrained models on custom data

Before fine-tuning, we’re going to evaluate the COCO-pretrained checkpoints directly on our three datasets, to see whether the fine-tuning is actually necessary. The result was unambiguous: The models predicted essentially nothing.

Zero-shot mAP50-95 on the test splits of our three datasets:

Modelcable-damagebone-fracturesoda-bottles
RF-DETR Nano0.00040.00000.0027
RF-DETR Base0.00050.00000.0004
YOLOv12-N0.00070.00000.0266
YOLO26-N0.00000.00000.0033
YOLOv12-M0.00000.00000.0160
YOLO26-M0.00000.00000.0012

This is to be expected; it’s not a bug! As the models are closed-vocabulary detectors, that is, they have a finite number of predefined target classes, they physically cannot output a class like fracture that isn’t in their 80-class COCO head. 

This is the punchline of this whole post: A model scoring 0.72 mAP50 on COCO scores 0.00 on bone fractures. Pretrained ≠ deployable, even when the model is state of the art. Basic machine learning principles still apply, even in the age of AI!

Step 4: Fine-tuning

All models were fine-tuned on a single A100 GPU for 10 epochs. We used standard Ultralytics/RF-DETR fine-tuning pipelines in order to fine-tune the models on our three datasets. We fine-tuned a model for each dataset. The full fine-tuning pipeline can be found in finetune_rf100.py scripts in the project repo, under the folders for each model.

You can see the core of the training setup below. Both YOLO and RF-DETR are built on PyTorch under the hood, but the training loops are abstracted behind higher-level library APIs: Ultralytics’ YOLO.train() for the YOLO models, and RF-DETR’s own train() functionality.

YOLO12 and YOLO26

train_model = YOLO(args.model)

train_res = train_model.train(
                data=str(yaml_path),
                epochs=args.epochs,
                imgsz=args.imgsz,
                batch=args.batch,
                device=args.device,
                project=args.project,
                name=run_name,
                exist_ok=True,
                verbose=False,
            )

RF-DETR

ModelClass().train(
                dataset_dir=str(coco_dir),
                output_dir=str(output_dir),
                epochs=args.epochs,
                batch_size=args.batch_size,
                grad_accum_steps=args.grad_accum,
                lr=args.lr,
                resolution=resolution,
                early_stopping=True,
                checkpoint_interval=1,
            )

Step 5: Results

Fine-tuning transforms the picture. You can see the results on the test set after training:

On the left, we have the pretrained models’ results for the COCO validation dataset. As we showed earlier, accuracy (mAP50-95) fell between 0.39 and 0.53, and all models except for YOLOv12-M showed low latency. The fine-tuned models on the right showed a similar range of accuracy for the cable-damage and soda-bottle detection tasks, only falling lower for the bone-fracture task. Moreover, the fine-tuned models were comparable in latency to the pretrained models for their intended tasks, and for YOLOv12-M, they were even faster. This suggests that, after fine-tuning to the target domain, the models achieve performance that’s broadly comparable to the pretrained performance on their original training domain.

Let’s now have a closer look at the fine-tuned models’ performance, breaking it down by mAP50 and mAP50-95 for the three separate RF-100 datasets:

Modelcable-damagebone-fracturesoda-bottles
RF-DETR Nano0.9195 (0.4391)0.2317 (0.1136)0.9617 (0.6223)
RF-DETR Base0.9281 (0.4456)0.4474 (0.1915)0.9688 (0.6332)
YOLOv12-N0.9236 (0.4378)0.0911 (0.0532)0.9677 (0.6343)
YOLO26-N0.8165 (0.3681)0.0193 (0.0064)0.9148 (0.5896)
YOLOv12-M0.8266 (0.3649)0.1500 (0.0635)0.9706 (0.6422)
YOLO26-M0.8707 (0.3896)0.2194 (0.1038)0.9596 (0.6304)

What the numbers say:

  • The soda-bottles target is the easy win. Every model lands in the 0.91–0.97 mAP50 band. This is likely due to the fact that the domain (consumer products in photos) is visually close to existing classes in COCO, so only the vocabulary was new. Interestingly, the attention model family does great here, with YOLOv12-M taking the top spot (0.6422 mAP50-95).
  • cable-damage: Detection is easy, but localization is hard. mAP50 reaches 0.93, but mAP50-95 tops out at 0.446. It appears that the models find the damage reliably, yet they struggle to box thin, elongated defects precisely. If your application needs tight boxes at high IoU, this gap would be a significant issue.
  • bone-fracture remains genuinely hard. The best model (RF-DETR Base, 0.447 mAP50) is far from production-ready, and the performance spread across models is huge. The modality shift from photos to X-rays means the pretrained backbone features transfer poorly. The different image modality and small, sometimes almost indistinguishable bone fractures make the detection task way harder than the one employed on common objects identification. This is the dataset that would most benefit from domain-specific pretraining, more data, or longer fine-tuning. 
  • RF-DETR Base is the most consistent performer, winning on two out of three datasets and challenging seriously for the third. The DETR-style architecture seems to transfer more robustly to unfamiliar domains. 

Qualitative results

To visually assess how these models perform, we can overlay the predicted bounding boxes on the images. Let’s look at the objects our models detected in six random images per class:

We can see this confirms the accuracy values we saw above: The noisy images of soda bottles in fridges are labeled accurately, with tight bounding boxes for each object. The cable damage is identified less consistently, with some models failing to find the damage altogether, and others creating unnecessarily large bounding boxes. Finally, the images of broken bones contrast sharply with the other two, with less than half of the images having any break identified, and different models identifying different potential breakage points.

Conclusions 

Pretrained object detectors are powerful, based on advancements in model architecture over the past five years, but as we’ve seen here, pretrained does not necessarily mean deployable. All six models performed well on COCO, yet when we applied those same checkpoints directly to our specialized datasets, their performance fell close to zero. However, fine-tuning completely changed that picture.

After only 10 epochs of fine-tuning, all three model families were able to adapt well to both the cable-damage and soda-bottle datasets. As we noted, the soda-bottle task was particularly transferable, likely because it contained objects similar to those contained in COCO. cable-damage was also detected relatively reliably, although the larger gap between mAP50 and mAP50-95 showed that precisely locating these tiny defects was still challenging for all of the models. However, bone-fracture was a completely different story, likely because moving from the sort of natural images contained in COCO to X-rays is a much larger domain shift. While RF-DETR handled this jump best, even its performance shows the limits of fine-tuning, and there are times when you might need to consider more data, longer training, or even domain-specific pretraining.

The broader takeaway is that there is no single “best” detector: It is dependent on the task. Model size, latency requirements, licensing restrictions, and most importantly, the similarity between the model’s pretraining data and your target domain all affect the outcome. It is important to refrain from unquestioningly trusting the numbers reported by model providers and explore the fit of a specific model for your own particular task.

Get started with PyCharm today

In this post, we’ve gone from validating pretrained YOLO12, YOLO26, and RF-DETR checkpoints on COCO to testing them zero-shot on specialized data, to fine-tuning them on three very different object detection tasks, and then finally, comparing the resulting accuracy and latency. Along the way, we’ve seen how PyCharm can help manage the practical side of a project like this, where multiple model families require different dependency sets and training environments.

PyCharm helps you keep these workflows together in a single project while using isolated Python environments for each model family. Its interpreter management, built-in terminal, Python Packages tool window, and support for remote development make it easier to move between environments and run training on remote GPU hardware without having to manage each part of this workflow separately.

If you’d like to try these experiments yourself, maybe look into fine-tuning these models for your own specific object detection use case! PyCharm is available to download and try. You can use the accompanying project code to reproduce our COCO baselines, download the RF100 datasets, fine-tune the models, and evaluate them using the held-out test splits.

You can find the full code for this project on GitHub. And if you’d like to learn more about object detection, including the architectures behind the models we used in this post, check out the previous post in this series.

show more
From Leaderboards to Model Profiles: A Deep Dive Evaluation of LLMs for Agentic Coding
Feed: The JetBrains Blog (https://blog.jetbrains.com/feed/)
Published: 2026-08-31 10:44:48 | Created: 2026-08-31 12:33:55

Felix Plantenberg

Felix Plantenberg is a ML Engineer intern at JetBrains, working on improving Junie evaluation pipelines Beyond that, his work extends to satellite imagery processing, data analytics and process automation. builds and evaluates data-driven software. His background spans computer science, management and machine learning. LinkedIn

Marco Damonte

Marco Damonte is a ML Scientist at Jetbrains. He loves finding answers to difficult questions and mentoring junior scientists. LinkedIn

Beyond the resolve rate

Imagine plugging two LLMs from different frontier labs into the same coding agent and finding that they solve exactly the same number of benchmark tasks. If the evaluation stopped there, you might conclude that the models are interchangeable and simply choose the cheaper one.

This is what also happened on one of our private benchmarks: Claude Opus 4.7 and Gemini 3.5 Flash solved the same number of tasks. But the tie concealed two very different execution profiles. Opus used an average of 184 steps and cost USD 2.79 per run, while Gemini took an average of 271 steps but cost only USD 1.24. The final result was identical, but the way each model reached it was not.

This difference is invisible in the metric most often used to compare coding agents, which is the resolve rate. It measures how many tasks the evaluation tests pass, expressed in percent. While resolve rate answers an important question, namely whether the agent solved the task, it says little about how the solution was reached.

A coding agent such as Junie is more than the LLM behind it. Given an issue and a repository, Junie lets the model inspect files, search for symbols, edit code, run commands, and execute tests. These observable actions form the agent’s trajectory. A trajectory does not reveal the model’s private reasoning, but it does show how the model worked with the repository. We can see whether it localized the problem before editing, repeated the same searches, tested its assumptions, and kept the final patch focused.

We built an evaluation pipeline that analyzes both the result and the path that produced it. It combines four perspectives: functional outcome, execution efficiency, patch quality, and process quality. Functional correctness remains the starting point, while additional metrics explain what lies behind the final score.

What current evaluations miss

A recent JetBrains Research post describes the benchmark meaning gap, identified in a recent research paper: a benchmark measures performance under a particular setup, but its score is often treated as evidence of a much broader coding ability. Performance gains may not transfer to other tasks, even within the same codebase, and model rankings can change with the task type.

Our work looks at a related gap within individual agent runs. Passing tests does not fully describe the patch quality. Two patches may implement the required behavior while differing greatly in scope, complexity, and fit compared to the existing architecture. For example, one may change a single relevant function. Another may add helpers, state, branches, or unrelated files – and still pass the same tests.

A failed outcome is equally ambiguous. The agent may never find the relevant code, may instead misunderstand the cause, edit the wrong layer, implement only part of the fix, or stop without adequate validation. These failures all require different actions. For example, a repeated search may call for better repository navigation or more focused prompting. Another example is a correct diagnosis of the issue followed by an incomplete patch. This suggests a problem in implementation or task completion.

Cost and latency add another dimension. As mentioned above, two successful runs can differ substantially in tokens, runtime, model calls, and tool use. A long trajectory is not necessarily bad if the task requires broad investigation. The important distinction is whether the extra work contributed to the solution, or it came from repeated and unproductive actions.

For model selection, the more useful questions are which model suits a particular kind of task, where it spends its effort, and how it tends to fail. This can be answered by a fine-grained analysis of both the trajectory and the patch through our pipeline.

Evaluating the outcome and the process

For each benchmark task, the pipeline combines the issue, repository context, generated patch, test result, and execution trace. It then evaluates the run from four perspectives, which ask the following questions:

  • Outcome: Did the patch resolve the task, and which tests passed or failed?
  • Efficiency: How many tokens, model calls, tool calls, and seconds did the run require, and what did it cost?
  • Patch quality: Did the change touch the relevant files and symbols, remain contained, and avoid unnecessary complexity?
  • Process quality: How did the agent move through exploration, implementation, and validation? Did it reproduce the problem, repeat work, or stop without testing the final change?

We propose a pipeline that combines deterministic metrics with semantic evaluation. The deterministic layer derives reproducible measurements from logs and repository data. These include test outcomes, runtime, token use, tool calls, modified files and symbols, code complexity changes, repeated file reads, unchanged command retries, and tool failure loops.

Rules alone cannot interpret every action. Opening a file twice may be wasteful, or it may be necessary after a related edit. A large patch may be unfocused, or it may be appropriate for a change that spans several components. For these questions, LLM judges receive structured evidence from the issue, patch, trajectory, and bounded repository context. They assess milestones such as finding the relevant code, reproducing the defect, identifying the root cause, addressing it in the patch, introducing unnecessary complexity, and validating the result. This combination gives us a clearer account of progress. It shows not only whether a run failed, but whether it failed during localization, implementation, or validation. Below figure serves as an illustration of the aforementioned components, inherent in our evaluation pipeline.

What the agent trajectories reveal

We used the pipeline to compare Claude Opus 4.7 and Gemini 3.5 Flash in Junie across four benchmark datasets containing 523 tasks. The results are shown below:

As you can see in the figure above, Claude Opus resolved 267 tasks, or 51.1 percent, while Gemini Flash resolved 254, or 48.6 percent. The models produced the same outcome on 430 tasks: both solved 214 and both failed 216. Only 93 tasks separated them. The overall scores were close, but the trajectories and patches showed different behavioral profiles. 

Identical outcomes via divergent trajectories

A same-task comparison makes the different behavioral profiles concrete. One Opus run and one Gemini run both solved the same task. Both first opened a relevant file at step 15, were judged to have identified the root cause, and performed thorough validation. However, they had progressed in varying increments d by that point. Opus used a targeted search within the file and began implementation 13 steps later. Gemini initially inspected the large module more broadly. It ran its first executable check at step 30, but did not make its first production edit until step 88. Opus finished in 53 steps, moving between exploration, implementation, and validation six times; Gemini needed 192 steps and thirty-four such switches. The following figure depicts the different paths.

Gemini’s additional investigation was partly useful, but it also widened the scope and led to an unrequested change. Both runs passed the evaluation tests, and both changed the same file and symbols that the reference solution changed. Opus touched nothing else. Gemini’s patch also reached four further files, making edits there. It was assessed as sprawling, with significant redundancy and moderate hallucination.

This single example is illustrative rather than statistical. It shows how the same benchmark success can come from a direct, contained run or a longer path with unnecessary expansion.

Failure can occur at several stages

A successful run usually progresses through four stages: locating the relevant code, identifying the root cause, implementing the complete fix, and validating the result. Resolve rate compresses this entire process into a single binary outcome, whereas trajectory analysis shows where the agent succeeded and where it fell short.

As trajectory analysis separates them, we can better analyze the 216 tasks that both models failed. We can see the results of the analysis in the figure below.

For both models more than 85 percent were assessed as having at least partially identified the root cause. For example, in one task, both agents recognized that text exceeding a token limit caused the error, but truncated the text instead of splitting it into valid chunks. In another, both corrected a faulty download parameter in one code path and missed the same problem in a companion path. A binary failure treats these runs like cases in which the agent never found the relevant component, although they were much closer to a correct solution.

The models were not completely lost. They had reached the relevant mechanism but implemented the fix incompletely, changed the wrong layer, or missed the task’s exact contract.

This is not simply a question of matching the golden patch. The reference solution is useful, but it is not the only possible valid implementation. A candidate may change a different file or architectural layer and still address the same mechanism. Structural comparison therefore needs to be combined with semantic assessments of diagnosis, completeness, and validation.

From leaderboards to model profiles

By using these outcomes it is possible to construct model-specific profiles that give more information about their strengths and weaknesses. In the following we list exemplary ones for Claude Opus 4.7 and Gemini 3.5 Flash.

Claude Opus 4.7: Strong diagnosis, weaker completion

Opus was more likely to identify the underlying cause of ambiguous defects. It often reached the correct mechanism or architectural layer and solved 53 tasks that Gemini missed. These results make Opus a useful starting point when the main challenge is understanding an unfamiliar repository or separating a visible symptom from its source.

The main weakness appeared after localization. Some runs found the right mechanism but stopped with a reproduction test, missed a companion branch or call site, or implemented a plausible custom solution instead of following an existing repository pattern. In 123 runs, Opus performed no executable validation, including 68 runs that still resolved the task. Skipping executable validation means a patch’s correctness is never actually confirmed, so even a resolved task carries undetected risk of regressions or edge-case failures that only running the code would surface.

Overall, Opus’ profile suggests a strong diagnostic model that benefits from an explicit transition to implementation, completion, and testing.

Gemini 3.5 Flash: Stronger validation, weaker grounding, and convergence

Gemini was more likely to run an executable check and use its output to refine the solution. These features were useful when the expected behavior was explicit, the responsible component was reasonably clear, and feedback was readily available.

The main risks we found with Gemini were convergence and repository grounding. Gemini often continued searching after reaching relevant code, repeated equivalent commands, or spent many steps on build infrastructure. It was also more likely to rely on unverified APIs, dependencies, paths, or test fixtures: 195 of its runs, or 37.3 percent, were assessed as containing moderate or severe hallucination, against 130 runs for Opus. Some patches expanded beyond the issue or included unrelated artifacts, and 80 runs, or 15.3 percent, showed significant or severe redundancy, more than twice the Opus rate of 6.5 percent. 

Overall, Gemini benefits from precise task contracts, symbol verification, clear stopping rules, and a final review of the diff.

A Wider set of models

We also ran the pipeline over a wider set of models. We evaluated GPT-5.5, Claude Opus 4.7, Gemini 3.5 Flash, and Qwen 3.6 27B FP8 on the same four benchmark datasets, and the table below compares them on the 522 tasks all four of them share. The same four perspectives separate them as well: GPT-5.5 reached the highest resolve rate at 51.5 percent and was the only model that always ran an executable check, Opus led every patch quality metric, and Qwen 3.6 27B FP8 resolved 38.9 percent of the tasks at three percent of GPT-5.5’s cost per run. 

GPT-5.5 and Opus finish four tenths of a point apart on resolve rate and within a cent of each other per run, so a leaderboard would treat them as interchangeable. Their patches are not: Opus was assessed with moderate or severe hallucination in 24.7 percent of its runs against 33.7 percent for GPT-5.5, and with significant or severe patch redundancy in 6.3 percent against 13.2 percent, while producing the shortest trajectories of the four models. What GPT-5.5 offers in return is process discipline, since it never ended a run without an executable check while Opus skipped validation in 23.6 percent of its runs. 

Qwen 3.6 27B FP8 is a third kind of trade-off: 12.6 points behind on resolve rate and the weakest of the four at identifying the root cause, but inexpensive enough that a failed run costs little. Which model is preferable therefore depends on whether the expensive part of the work is diagnosis, patch review, or the run itself.

Limitations and conclusions

In this post, we inferred profiles for Claude Opus 4.7 and Gemini 3.5 Flash. These inferences are based on a specific Junie scaffold used in this evaluation, and they should not be used to generally describe the model themselves. Moreover, The LLM judge assessments are diagnostic signals rather than ground truth, and are heavily based on a single golden patch, which in most cases, as typical in the coding domain, is not the only viable solution. The judges may be therefore inclined to score negatively valid solutions if they differ from the reference one.

Resolve rate remains the foundation of coding agent evaluation, but it becomes more useful when paired with evidence about efficiency, patch quality, and process. Our overall goal is not to replace a leaderboard with another aggregate score. We would like to understand what produced each result and use those patterns to improve model selection, prompting, and agent design. From an industry perspective we can better refine agent design, by moving beyond aggregate success rates to fine-grained scores and behavioral profiles. On the other hand, from a user perspective, we can now empower Junie users to choose the right model for the job.

show more
Sunsetting of the JetBrains Teacher Pack for Bootcamps
Feed: The JetBrains Blog (https://blog.jetbrains.com/feed/)
Published: 2026-08-31 08:52:39 | Created: 2026-08-31 10:33:55

After careful consideration, we’ve decided to sunset the JetBrains Teacher Pack for Bootcamps.

If you’re planning to run a bootcamp and would like support from JetBrains, you can submit one final application by September 30, 2026, 11:59 pm CET. Starting October 1, 2026, we will no longer accept new applications.

Although the bootcamp program is coming to an end, we continue to offer a range of JetBrains education programs designed for different teaching and learning needs.

Read on to learn more about the timeline and available alternatives, as well as to find answers to frequently asked questions.

Why are we retiring the program? 

Over the past few years, we’ve expanded our education programs to better support teachers, students, classrooms, and independent learners.

Thanks to these expanded offerings, educators can now choose from dedicated programs for different teaching and learning scenarios, making a separate bootcamp program unnecessary.

Key dates

September 30, 2026, will be the last day to apply for a JetBrains Teacher Pack for Bootcamps.

Bootcamps that submit an application on or before this date will receive one final set of student coupons, valid for up to six months.

Starting October 1, 2026:

  • We will no longer accept new applications.
  • No additional student coupons will be issued.
  • Instructors will no longer receive free access to JetBrains IDEs through the bootcamp program. Any existing instructor licenses will remain active until they expire. 
  • Previously approved student coupons will remain valid until their expiration date. 

The bootcamp program will be fully retired on April 1, 2027. By then, all student coupons provided via the bootcamp program will have expired, and the graduation discount will no longer be available.

What alternatives are available?

Depending on how you teach or learn, there are several other ways to access JetBrains products.

Teaching at a university or school?

If you teach at an accredited educational institution, the JetBrains Teacher Pack is the best place to start.

Depending on your role and needs, you can apply for:

  • Teacher Pack for Individuals – This provides individual educators with free access to JetBrains IDEs and additional educational features and benefits.
  • Teacher Pack for Classrooms – This enables institutions to equip teachers and students with JetBrains tools and educational features through centralized license management and flexible cloud or on-premises deployment.

Creating programming courses? 

If you publish your programming courses on platforms like Coursera, Udemy, Moodle, edX, or LinkedIn Learning, or even your own platform, the JetBrains Course Creators Program is a great option for you.

Studying at a school or university?

Students at accredited educational institutions can apply for the JetBrains Student Pack.

The Student Pack includes free access to all JetBrains IDEs, in-IDE courses, a two-year graduation discount after your student license expires, and more.

For everyone

If you don’t qualify for an educational license, you still have the following options:

No matter how you learn or teach, we’re committed to making professional development tools accessible to you.

Thank you to our bootcamp community

We’d like to thank every bootcamp instructor and learner who has been part of the JetBrains Teacher Pack for Bootcamps program.

While the bootcamp program is coming to an end, our commitment to education remains the same. We look forward to continuing to support educators, students, course creators, and educational organizations through our evolving educational programs.

Your JetBrains Academy team

FAQ

Can my bootcamp continue using its existing student coupons?

Yes. Student coupons already issued through the bootcamp program will remain valid until their expiration dates. However, after October 1, 2026, you will not be able to request additional student coupons beyond the quantity originally approved with your application. 

Can we request additional coupons after October 1, 2026?

It will not be possible to request student coupons or free IDE access for bootcamp instructors after October 1, 2026.

Can I continue using my free access to JetBrains IDEs as a bootcamp instructor?

Yes. Your access will remain active until its expiration date.

What if my course ends after the program stops accepting applications?

Bootcamps that apply and are approved before October 1, 2026, can receive a final pack of coupons for their students. This should allow eligible organizations to complete courses that begin before the application deadline.

If your course runs beyond the validity of the final license, please review the alternative JetBrains programs listed above.

Can students still receive the Graduation Discount?

Students remain eligible for the Graduation Discount until April 1, 2027.

Who can I contact with questions?

For questions about an existing bootcamp program license or the transition to another JetBrains offering, please contact bootcamps@jetbrains.com.

show more
The State of Django 2026: Boring is so back
Feed: The JetBrains Blog (https://blog.jetbrains.com/feed/)
Published: 2026-08-28 14:17:28 | Created: 2026-08-28 16:09:54

Welcome to the highlights from the fifth annual Django Developers Survey, a collaboration between the Django Software Foundation and PyCharm. This year’s report draws on responses from nearly 3,500 Django developers across more than 40 countries — from students in their first year to veterans with decades of experience.

In software, “boring” is a compliment. It means a technology works so reliably you can stop thinking about it. By that standard, Django in 2026 is thriving: PostgreSQL has been the database of choice for 76–79% of respondents for five consecutive years, Django’s template engine has held steady at around 80%, and nearly half of developers upgrade with every stable release — 43% are already on Django 6.0, months after it shipped. The core is boring in the best possible way. Mature, but not static.

Everything around that core, though, is moving fast. AI is now an everyday tool for most developers, and agents are beginning to move beyond answering questions to editing files, running commands, and completing larger tasks. Newer tools are consolidating workflows that once required several separate utilities, typing is becoming standard practice, and the boundaries between editors, terminals, automation, and AI are getting blurrier.

That may be Django’s particular advantage in 2026: it is mature enough to be dependable, active enough to keep moving, and stable enough to give developers room to change almost everything else.

As an open-source framework, Django depends on its community and needs funding to remain healthy and secure. The PyCharm team runs an annual fundraiser to support Django.

Until September 10, get PyCharm at 30% off, and JetBrains will donate 100% of your purchase amount to the Django Software Foundation.

1. AI is mainstream, but no workflow has won

AI has become part of the normal Django development workflow. Only 10% of respondents said they regularly use no AI tools for coding, while 58% of AI users use them every day and another 27% several times a week.

What remains unsettled is how developers use them. The interfaces are split almost evenly across the browser, the IDE, and the command line, and no tool dominates: Claude Code leads at 35%, with ChatGPT just behind at 33% and GitHub Copilot at 23%. And for all the attention on agents, a majority of AI users — 56% — still use it purely for chat and advice.

2. Dominating AI workflow is still supervised

Nearly half of AI users already work with AI through an IDE integration. But despite the growth of coding agents, the dominant workflow is still supervised: 59% have AI generate code and then apply the changes themselves, 44% let it edit files or run commands when instructed, and only 27% use it to autonomously complete multi-step tasks.

The emerging pattern is therefore less “replace the IDE with an agent” and more “bring the agent into the development environment.” Developers are adopting AI quickly, but the editor remains their home base for understanding the codebase, reviewing changes, and deciding what makes it into the project.

Nowhere is the shift clearer than in how developers learn. Django’s official documentation remains the top resource at 67%, but AI tools are now second at 51% — ahead of YouTube, reading source code, and Stack Overflow.

AI is already routine for writing code, debugging, research, and learning. But developers are still experimenting with where it belongs: in the browser, inside the IDE, at the terminal, or increasingly, acting directly on the codebase.

AI is changing the IDE faster than it is replacing it.

3. Python tooling is consolidating fast

Two tools that barely existed a few years ago are already near the top of the survey.

uv, released in February 2024, is already used by 43% of respondents for managing Python environments—second only to venv at 63% and ahead of Docker at 31%.

Ruff tells a similar story. At 43%, it is now the most widely used code-quality and formatting tool in the survey, ahead of IDE inspections at 27%, Black at 25%, pre-commit at 20%, and Flake8 at 17%.

The shift is not that Python’s older tools have disappeared. It is that newer tools increasingly cover jobs that once required several separate utilities. The result is a Python toolchain beginning to consolidate around fewer, faster, more capable tools.

4. Type hints are winning. The type checker race is wide open.

Type hints are becoming the norm in Django development: 57% already use them, and another 26% plan to. What is much less settled is how developers check those types.

Among developers who use type hints, the most popular option isn’t a standalone type checker at all: 40% rely on the checker built into their IDE. Mypy follows at 32%, Ruff at 29%, and Pyright/Pylance at 22%. Newer entrants are already appearing too, with Astral’s ty reaching 12% and Meta’s Pyrefly at 4%.

The practice, in other words, is converging faster than the tooling. Django developers increasingly agree that types are useful, but there is still no consensus on which tool should enforce them—or whether a separate tool is necessary at all.

That makes type checking an interesting space to watch in 2027: will one of the newer standalone tools break away from the pack, or will type checking increasingly become something developers simply expect their IDE to provide?

5. As AI writes more code, verification matters more

AI is moving beyond suggestions and into the codebase. That makes automated verification more important, not less.

The survey can’t tell us whether AI is driving greater adoption of tests or CI. What it does show is that most Django developers already have the infrastructure agents need: pytest is used by 45% of respondents and unittest by 43%, with pytest-django at 34%.

That testing culture sits alongside widespread CI/CD adoption — GitHub Actions is now used by a majority of respondents at 51%, with GitLab CI/CD at another 26%. Together, these create a natural feedback loop for agentic development: an agent can make a change, run the test suite, respond to failures, and hand the developer a result that has already passed the project’s checks.

Not everyone has that loop in place: 19% of respondents write no automated tests at all. As more code is delegated to agents, that fifth of developers is working without the safety net that makes delegation trustworthy.

The emerging agentic workflow may depend as much on verification as generation. The more code we delegate, the more valuable it becomes to have tests and pipelines that can quickly tell both developers and agents whether a change actually works.

Agents can generate code. Tests and pipelines tell them whether it works.

6. One framework, two ways to build

Two distinct ways of building with Django are now firmly mainstream: letting Django render the interface, or using it as the backend for a separate frontend. 72% of respondents use server-rendered templates, while 53% use Django for API-only applications and 46% use it as the backend for a single-page application or dedicated JavaScript frontend.

The balance is even clearer when developers are asked for their primary approach. Half primarily build server-rendered applications, while 44% primarily use Django for either APIs or dedicated JavaScript frontends.

The JavaScript numbers tell the sharper story. React has barely moved in five years — 37% in 2021, 38% today. What’s changed is everything around it: jQuery has fallen from 37% to 23%, Vue from 28% to 17%, while htmx has climbed from just 5% to 34%. htmx isn’t taking share from React — it’s modernizing the server-rendered side of the divide that jQuery used to own.

That flexibility is one of Django’s strengths. The same framework can sit at the center of a hypermedia application or behind an API consumed by React, mobile apps, or other clients.

Django remains unusually comfortable on both sides of the frontend divide.

Conclusion

Across the survey, the pattern is consistent: developers are changing their tools and workflows far faster than they are changing the framework underneath them. The parts of Django they value most remain familiar — models, the admin, authentication — and even deployment stays defiantly unfashionable, with 54% shipping monoliths and 44% self-hosting.

Even where Django itself is evolving, it does so deliberately: 33% of respondents use its async features and another 40% plan to — change offered as an opt-in, not a rewrite.

That stability is increasingly valuable. Developers can experiment with a new agent, replace several tools with Ruff or uv, add htmx to a template, or adopt a new type checker without having to rethink the framework underneath their application.

Django’s advantage in 2026 is not that it is the newest thing. It is that it gives developers a solid, dependable — yes, boring — place from which to try the newest things. Boring is so back.

PyCharm for Django Fundraiser

Get a new PyCharm Pro license or renew your existing one at 30% off, with 100% of your purchase amount going to the Django Software Foundation.

Explore the complete 2026 Django Developers Survey Results.

show more
Security Incident Affecting JetBrains Cadence
Feed: The JetBrains Blog (https://blog.jetbrains.com/feed/)
Published: 2026-08-28 09:50:14 | Created: 2026-08-28 10:09:55

We are investigating a security incident affecting JetBrains Cadence. Cadence is a JetBrains-hosted service that integrates with PyCharm through an optional plugin, and lets you run your projects on cloud compute resources. Our investigation has confirmed unauthorized access to the service and the exposure of customer data associated with its use.

We have contacted affected users directly and have taken steps to contain the incident.

This post provides the latest information about the incident, its potential impact, and the actions we recommend Cadence users take. We will update it as our investigation progresses and additional information becomes available.

Last updated: September 1, 2026, 12:05 CEST

September 1, 2026, 12:05 CEST

Our investigation is nearing completion, and most mitigation and response actions are now finalized. We have not identified any additional compromised resources or data since our last update, and we are wrapping up a small number of remaining verification activities. The recommended actions for affected users remain unchanged.

August 31, 2026, 12:56 CEST

Our investigation remains ongoing. At this time, we have not identified any additional compromised resources or data.

We have confirmed that the threat actor accessed data contained in the Cadence server backup from 2024. At this time, there is no evidence to suggest that the threat actor extracted data, including secrets, from the current Cadence environment.

The recommended actions described below remain unchanged.

August 28, 2026, 11:50 CEST

Cadence is a JetBrains-hosted service integrated with PyCharm through an optional plugin, that lets you run your projects on cloud compute resources. Cadence uses JetBrains TeamCity to orchestrate this work. We recently disclosed CVE-2026-63077, a critical vulnerability in TeamCity that can allow an unauthenticated attacker to execute arbitrary commands on a vulnerable server.

We have since confirmed the Cadence environment was vulnerable to CVE-2026-63077 and was exploited through this vulnerability.

Cadence users should immediately revoke or rotate all credentials and secrets that may have been used to run their Cadence executions. They should also treat all executions, including their inputs and outputs in your Cadence project, as potentially untrusted.

Actions required immediately

We strongly recommend that Cadence users:

  • Revoke and rotate all credentials and secrets that may have been used to run Cadence executions.
  • Review connected systems for suspicious activity, particularly AWS accounts, S3 buckets, deployment environments, package/container registries, and other systems accessible using credentials mentioned above.
  • Review source code repositories for unauthorized changes made during the affected period.
  • Review any source code or project files synchronized to Cadence from PyCharm and rotate any credentials, tokens, or other sensitive information contained within them.
  • Treat all executions, including their inputs and outputs in your Cadence project, as potentially untrusted.

Cadence users can contact us to request an inventory of the credentials and secrets associated with their Cadence usage. This may help users identify which credentials need to be revoked or rotated, but the inventory should not be considered exhaustive.

We have collated a list of Indicators of Compromise (IoCs) below. These indicators are not exhaustive, and the absence of these indicators does not confirm that an account or system was unaffected:

  • Activity occurring from August 8, 2026, onwards, particularly authentication or activity using credentials previously stored in or accessible through Cadence.
  • IP addresses associated with observed exploitation activity:
    • 150.109.230.104
    • 43.153.227.206
    • 62.210.127.48
    • 210.247.242.190
    • 15.235.225.205
    • 152.233.30.18
  • Authentication or other activity from unexpected IP addresses or locations.
  • Unexpected repository clones or downloads, and unexpected commits to repositories.
  • Changes to repository secrets, webhooks, collaborators, or permissions.
  • New or modified personal access tokens, API tokens, or SSH keys in external services.
  • New service accounts created in external services.
  • Unexpected changes to cloud IAM roles, policies, or permissions.
  • Unexpected access to cloud storage, including S3 buckets and objects, in services such as AWS and Google Cloud.
  • Unexpected publication or modification of packages or releases.

Affected server

We have confirmed that the following Cadence server was successfully exploited: api.cadence.jetbrains.com.

Affected period

August 8, 2026, to August 24, 2026.

What happened

The Cadence server used TeamCity to orchestrate workloads and was vulnerable to CVE-2026-63077. Threat actors exploited the vulnerability and gained unauthorized access to the affected Cadence environments, with activity identified from August 8, 2026. We discovered the exploitation on August 23, 2026, and took the affected server offline on August 24, 2026, while we continued our investigation.

What we know

Our investigation is ongoing, but we have confirmed that the threat actors:

  • Accessed personal data and extracted it from the affected environment. Confirmed affected personal data includes usernames, real names, email addresses, last-login timestamps, and last accessed IP addresses.
  • Compromised a full backup of the Cadence server dating from 2024. This means credentials, configuration, artifacts, logs, or other data present in that backup must also be treated as potentially exposed.
  • Compromised multiple AWS IAM users and associated credentials/secrets used with Cadence, including IAM users belonging to JetBrains employees who used the service. These credentials were present in the compromised 2024 backup.
  • Accessed files stored in S3 buckets within JetBrains AWS accounts used by Cadence. We are still determining the full scope of the data accessed. We do not currently know whether the threat actors accessed storage buckets in customer accounts. However, some users may have configured Cadence to access their own storage buckets, and the credentials used for those connections may have also been exposed.
  • May have accessed source code synchronized from PyCharm projects to the affected server. If you used PyCharm to upload or synchronize project files for execution in Cadence, you should treat that code, and any credentials or configuration contained within it, as potentially compromised.

The likely consequences of the personal data exposure include an increased risk of targeted phishing, social engineering, impersonation, and other unsolicited or malicious communications using the affected names and email addresses.

As the threat actors gained access to the Cadence server, any credentials or secrets stored in Cadence, contained in the compromised backup, or made available to executions on the affected server should be considered compromised and must be revoked or rotated.

This includes but is not limited to:

  • Cloud credentials, including AWS, Azure, and Google Cloud.
  • Source control credentials and tokens, including GitHub, GitLab, and Bitbucket.
  • Package repository credentials, including npm, Maven, NuGet, PyPI, and similar services.
  • Container registry credentials, including Docker Hub, ECR, GCR, ACR, and other registries.
  • Slack tokens, webhooks, API tokens, SSH/deployment keys, service account credentials, signing keys/certificates, and credentials for any other external systems used by your Cadence executions.

Actions JetBrains has taken

We took the Cadence server offline on August 24, 2026, while we continue to investigate the incident. At present, we have confirmed that the incident is limited to data associated with the Cadence host mentioned above.

The server should have been patched as part of our response to the vulnerability, but it was not. We sincerely apologize for this failure and the impact it may have on you.

We have invalidated all access tokens used by the JetBrains Cadence plugin in PyCharm to connect to Cadence, and took the server offline on August 24, 2026.

We are also notifying the relevant authorities and taking the necessary steps to protect the data of Cadence users.

Further updates

We will publish further findings and guidance here as our investigation progresses. We recommend checking this page frequently for the latest information. We will also contact affected users directly if we identify any important new information that may require action on their part.

For more information about the underlying vulnerability, please see our original security advisory to TeamCity customers and users.

If you previously used Cadence and need assistance identifying which credentials may have been exposed or have any questions regarding this incident, contact the JetBrains Security team at security@jetbrains.com.

We recognize the seriousness of this incident and apologize again for the impact.

show more
Project Loom in IntelliJ IDEA: Virtual Threads, Scoped Values, and Structured Concurrency
Feed: The JetBrains Blog (https://blog.jetbrains.com/feed/)
Published: 2026-08-28 05:03:34 | Created: 2026-08-28 06:09:55

Java concurrency is a powerful feature, but it can be difficult to get right. Writing correct multithreaded code requires a deep understanding of thread pools, synchronization, cancellation, and error propagation. Even experienced developers regularly introduce subtle bugs like thread leaks, swallowed exceptions, and race conditions that only surface under specific circumstances.

Traditionally, Java concurrency has had several limitations: 

  • Scalability and resource costs from blocking threads.
  • Difficulty sharing contextual data between threads safely.
  • Problems managing threads such as leaks and cancellation delays.
  • Concurrent code that is hard to understand, debug, and maintain.

Project Loom aims to eliminate the tradeoff between simplicity and efficiency in concurrent Java code, making it easier to write, debug, profile, and maintain code that is correct, readable, and scalable. It does this through three features that work together:

  • Virtual Threads (JEP 444, stable since Java 21) – Platform threads are expensive and limited in number, making highly concurrent applications resource-heavy and hard to scale. Virtual threads are lightweight and managed by the JVM, allowing many more threads to run concurrently without the same overhead.
  • Scoped Values (JEP 506, stable since Java 25) – ThreadLocal variables are mutable, hard to reason about, and prone to memory leaks. Scoped values provide immutable, automatically cleaned-up data sharing that scales efficiently with virtual threads.
  • Structured Concurrency (JEP 533, seventh preview in Java 27) – Unstructured concurrency leads to thread leaks, cancellation delays, and code that is difficult to debug and maintain. Structured concurrency treats a group of related threads as a single unit of work, making cancellation and error handling predictable and consistent. It also provides a clear parent-child thread hierarchy that improves observability and makes concurrent code easier to trace and inspect.

In this post, we’ll give you an overview of these features, explain some of the problems they solve, show how they work together, and demonstrate how IntelliJ IDEA supports you along the way.

Problems with Java concurrency before Project Loom

To illustrate some of the problems with concurrency and how Project Loom can solve them, let’s look at an example of how we could write concurrent code without using any of the features of Project Loom. We’ll then rewrite this code to take advantage of these features and see how they compare.

As an example, we will use an application that loads a customer profile. It fetches order history and product recommendations for a customer in parallel. You can find the project’s source code here.

The method getProfile() in the CustomerProfileService (which you can find here) loads the customer profile using CompletableFuture to run the calls concurrently:

public CustomerProfile getProfile(String customerId) throws OrderServiceException, RecommendationServiceException {
        CompletableFuture<List<Order>> orderFuture =
                CompletableFuture.supplyAsync(() -> orderServiceClient.getOrders(customerId), executor);
        CompletableFuture<List<Recommendation>> recFuture =
                CompletableFuture.supplyAsync(() -> recommendationServiceClient.getRecommendations(customerId), executor);

        CompletableFuture<Void> allFutures = CompletableFuture.allOf(orderFuture, recFuture);

        try {
            allFutures.get(2, TimeUnit.SECONDS); // single timeout covering both futures
            return new CustomerProfile(customerId, orderFuture.join(), recFuture.join());
        }

        // catch block 

The catch block handles any exceptions. This code does what it is supposed to do: It runs the independent calls in parallel, has a timeout, and makes an effort to cancel remaining tasks on failure. But there are still several potential problems:

  • Thread leaks. cancel(true) marks the future as cancelled, but for CompletableFuture the interrupt flag is ignored and the work already running in the pool continues to completion unless it was explicitly wired to a cancellation signal.
  • Awkward error handling. ExecutionException wraps the real cause and must be unwrapped manually (shown in the code snippet below and also available here). The unwrapping chain will need to be updated every time a new exception type is introduced.
        catch (ExecutionException e) {
            Throwable cause = e.getCause();
            orderFuture.cancel(true);
            recFuture.cancel(true);

            if (cause instanceof RestClientResponseException ex && ex.getStatusCode().value() == 503) {
                if (orderFuture.isCompletedExceptionally()) {
                    throw new OrderServiceException("Order service unavailable", e.getCause());
                }
                if (recFuture.isCompletedExceptionally()) {
                    throw new RecommendationServiceException("Recommendation service unavailable", e.getCause());
                }
            }
            throw new RuntimeException("Unexpected error", e.getCause());
  • Duplicated cancellation logic. The cancel() calls are repeated across both the TimeoutException and ExecutionException catch blocks. If any additional parallel call is added later, it needs a cancel() call in both catch blocks, which is easy to forget. These blocks could drift out of sync as the code evolves.
  • Fragile context propagation. Passing contextual data such as a logged-in user’s session or a trace ID across threads using ThreadLocal is fragile. ThreadLocal variables are mutable, their values persist for the lifetime of a thread unless explicitly removed, and child threads do not automatically inherit them unless you use InheritableThreadLocal, which has its own pitfalls.
  • Poor observability. A thread dump shows a flat list of pool threads with no indication of which threads belong to which request, or which are still waiting on something that already failed. To see running threads, you can get a thread dump in IntelliJ IDEA when the program is suspended (either stopped at a breakpoint or paused). In the Debug tool window, click More and select Get Thread Dump while the service is handling a request.
Pause output and Get Thread Dump

Sidenote: To add the Get Thread Dump button to your Debugger tool window, right-click the Debugger tool window and select Customize Toolbar. In the popup, click Add, search for and select Get Thread Dump, and click OK.

Customize Toolbar with the Get Thread Dump button

Let’s take a look at how Project Loom addresses these problems.

Virtual Threads (JEP 444, stable since Java 21)

The first feature of Project Loom is Virtual Threads, which drastically improve throughput in Java applications with blocking code.  

Traditionally, the number of available threads in a Java application is limited because platform threads wrap operating system (OS) threads, and the number of OS threads is limited. Platform threads are also expensive; creating them can take milliseconds, each one consumes significant memory, and context switching between them has considerable overhead. To manage these costs, applications use thread pools – a fixed set of reusable threads managed by an ExecutorService.

In contrast, virtual threads are lightweight threads. They are cheap to create (taking microseconds instead of milliseconds), and since they are not tied to OS threads, they are not limited in number; you could run millions of them. When a virtual thread blocks, the underlying platform thread is released for other work and reassigned when the virtual thread is ready to continue. This means that virtual threads can significantly improve throughput for blocking workloads, such as I/O (anything that waits on databases, network calls, or file access), pauses, or synchronization.

In Java 24, an additional improvement was made to improve the scalability of Java code. With JEP 491: Synchronize Virtual Threads without Pinning, virtual threads that block in synchronized methods and statements release their underlying platform threads. You can see this in action in the What’s New in IntelliJ IDEA 2025.2 livestream.

We already briefly discussed virtual threads in Java 25 LTS and IntelliJ IDEA. For more information about using virtual thread dumps, have a look at Thread Dumps and Project Loom (Virtual Threads).

To debug problems with concurrent threads, check out the new, improved logpoint functionality described in Println Debugging Done Right.

Scoped Values (JEP 506, stable since Java 25)

The second feature of Project Loom is Scoped Values – a safer, more scalable alternative to ThreadLocal variables, designed with virtual threads in mind. They solve the problem of sharing contextual data across threads cleanly and safely.

To share data between components of an application, we can use thread-local variables, but these have several downsides. A ThreadLocal variable is mutable and, therefore, hard to reason about. Data persists for the thread’s lifetime unless manually removed (risking memory leaks and security issues), and child threads inherit copies that increase memory footprint.

ScopedValue provides a better model: A value is bound once within a defined scope, automatically available to all code running within that scope, and cleaned up automatically when the scope ends. The binding cannot be changed from within the scope, eliminating the risk of accidental mutation and guaranteeing that any code reading the value will see the same one. When used with structured concurrency, scoped values require no explicit propagation to child threads, making context sharing both safer and simpler.

Note that even if your code does not explicitly use ThreadLocal, frameworks like Spring use it under the hood.

For more details, see the section on Scoped Values in Java 25 LTS and IntelliJ IDEA.

Structured Concurrency (JEP 533, seventh preview in Java 27)

The third feature of Project Loom is Structured Concurrency, which is currently still in preview. Java 27 again brings some changes to this preview feature. As we have already added some support for this feature in IntelliJ IDEA, now is the perfect time to try it out.

Structured concurrency is designed to promote a style of concurrent programming that reduces common problems such as thread leaks and cancellation delays, duplicated cancellation logic, and awkward error handling. The core idea is that a group of related concurrent tasks is treated as a single unit of work with a clear owner, a clearly defined lifetime, and clear rules. Subtasks cannot outlive their scope, failures propagate cleanly, and cancellation flows automatically from parent to children.

The StructuredTaskScope lets you break a task down into concurrent subtasks that are coordinated as a single unit. Subtasks are forked to run on their own thread and joined as a unit when the work completes.

StructuredTaskScope has a factory method StructuredTaskScope.open(). This method has several overloads that allow you to provide a Joiner and/or a configuration callback. This lets you define the failure policy, a name for observability, and a timeout all in one place when opening the scope.

In our example, we want both methods (fetchOrders() and fetchRecommendations()) to succeed in order to correctly assemble the customer profile. We can provide a name for our scope and set a timeout for how long we are willing to wait on the results. If either of them fails, the other is cancelled. When a subtask fails or the timeout expires, join() throws an ExecutionException with the underlying cause. We switch on that cause to handle each case explicitly – including CancelledByTimeoutException, which is what the joiner uses to signal a timeout.

What if we don’t need results from all methods called in parallel? For example, imagine recommendations are available from two different caches and you only need the result of one of the calls to succeed. If one task succeeds, the other can be shut down. To accomplish this, we can use a different Joiner, anySuccessfulOrThrow(). As soon as one cache returns a result, the scope shuts down and the other task is cancelled automatically. If both fail, the join() method throws an ExecutionException with the exception of one of the failed subtasks as the cause.

To quickly scaffold a StructuredTaskScope in IntelliJ IDEA, use the built-in live template sts

Use the live template sts to create and open a StructuredTaskScope.

Structured concurrency is still a preview feature in Java 27, so it is not yet recommended for production use. That said, the feature has been relatively stable in its broad shape for several preview rounds, with some changes to the API, and now is a great time to experiment with it. To identify where you could use structured concurrency in your code, look for places where the code performs multiple tasks in parallel and awaits the results. This code is a candidate to be rewritten using structured concurrency.

Rewriting CustomerProfileService using Project Loom features

The “modern” branch of our demo project contains the same application rewritten using the features from Project Loom. The structure follows the same pattern as before: Orders and recommendations are fetched in parallel inside the scope.

The updated method getProfile() in the CustomerProfileService (which you can find here) now uses a StructuredTaskScope:

public CustomerProfile getProfile(String customerId) throws InterruptedException, TimeoutException {
        try {
            return ScopedValue.where(CUSTOMER_ID, customerId).call(() -> {
                try (var scope = StructuredTaskScope.open(
                        Joiner.awaitAllSuccessfulOrThrow(),
                        config -> config.withName("customer-profile").withTimeout(Duration.ofSeconds(2)))) {
                    var orderTask = scope.fork(() -> orderServiceClient.getOrders(CUSTOMER_ID.get()));
                    var recTask = scope.fork(() -> recommendationServiceClient.getRecommendations(CUSTOMER_ID.get()));
                    scope.join();
                    return new CustomerProfile(customerId, orderTask.get(), recTask.get());
                } catch (ExecutionException e) {
                    switch (e.getCause()) {
                        case StructuredTaskScope.CancelledByTimeoutException _ -> throw new TimeoutException("Request timed out");
                        case OrderServiceException ose -> throw ose;
                        case RuntimeException rte -> throw rte;
                        default -> throw new RuntimeException(e.getCause());
                    }
                } catch (InterruptedException e) {
                    Thread.currentThread().interrupt();
                    throw new RuntimeException("Interrupted", e);
                }
            });
        } catch (InterruptedException | TimeoutException | RuntimeException e) {
            throw e;
        } catch (Exception e) {
            throw new RuntimeException(e);
        }
    }


Notice that we no longer need the duplicated cancel() calls in two catch blocks. If either task fails or the timeout is exceeded, all remaining subtasks are cancelled automatically. There is no longer any need for manual cancel() calls.

The code now clearly expresses its intent: Fetch orders and recommendations in parallel, wait up to two seconds, and fail cleanly if anything goes wrong. Because the pattern of what the code does is clearly captured in the code, this code is easier to read, understand, and reason about.

To see the difference structured concurrency makes, run the updated service in IntelliJ IDEA and take a thread dump while requests are being processed. You can create a thread dump, as described earlier. From IntelliJ IDEA 2026.1, virtual threads forked within a StructuredTaskScope are grouped into containers representing their scopes. The IntelliJ IDEA debugger now shows you the structure in structured concurrency.

Get Thread Dump with StructuredTaskScope

Using Java 27 (EA) in IntelliJ IDEA

To try out the features described in this post, you will need Java 27. You can download it from inside IntelliJ IDEA via Project Structure | Project Settings | Project, and then open the SDK dropdown and select Download JDK. Set Version to 27 and select the Early-Access version. 

Download the JDK from IntelliJ IDEA

If you are using a different way to download JDKs, you can point IntelliJ IDEA to your installation. Go to Project Structure | Project Settings | Project, open the SDK dropdown, select Add JDK from disk, and point IntelliJ IDEA to your installation of Java 27.

If you’re using command-line tools like SDKMAN! or asdf, you can use inlay hints to make version management easier. If your .sdkmanrc or .tool-versions file specifies a JDK version that is not yet installed, an inlay hint will appear that allows you to download it directly. 

Download the JDK via .sdkmanrc

If the JDK is already installed but not configured for the project, you can use the inlay hint to set it as the project JDK.

Set the JDK via .sdkmanrc

For more information, see the documentation.

To get support for new language features, like structured concurrency, when using an early access version of the JDK, set the Language level to X – Experimental features.

If Java 27 has already been released when you’re reading this post, download the Java 27 distribution you want to use from IntelliJ IDEA or, if you already have Java 27 installed, point the IDE to your installation. To use structured concurrency, you also need to enable preview features. Set the Language level to 27 (Preview) – Primitive types in patterns, instanceof, and switch (5th preview) in Project Structure. IntelliJ IDEA will flag usage of preview features in the editor, so you are always aware which features are not yet stable.

Conclusion

Virtual threads, scoped values, and structured concurrency are designed as a cohesive system, each addressing a different dimension of the problem:

  • Virtual Threads improve scalability. They remove the need to manage thread pool sizes and make it practical to run one thread per task, even at high concurrency.
  • Scoped Values improve context propagation. This JEP solves some of the downsides of ThreadLocal (and framework workarounds), giving all tasks in a scope automatic, safe access to shared immutable context.
  • Structured Concurrency solves the structural problems in concurrency by giving concurrent tasks a clear lifetime, a clear owner, and a clean failure model, thus eliminating thread leaks, duplicated cancellation logic, and ExecutionException unwrapping.

Together, they let you write concurrent code that is much easier to read than traditional concurrent code, while being safe and scalable. The boilerplate that currently may take multiple steps to get right is replaced by code that is more concise and reads exactly like the problem it is solving.

You can use these features in IntelliJ IDEA. If you have questions or feedback, please let us know in the comments below.

show more
Differential Privacy for Hugging Face Trainers – Without Rewriting Your Training Loop
Feed: The JetBrains Blog (https://blog.jetbrains.com/feed/)
Published: 2026-08-27 15:31:12 | Created: 2026-08-27 16:08:54

It is a well-known problem by now that training LLMs on sensitive data raises serious privacy concerns. In a recent blog post, we talked about membership inference attacks and our research on mitigating them. 

At JetBrains Research, we are deeply concerned about user privacy and continually developing new methods and tools to improve privacy protection. In this post, we present DPTrainer, a new library we’ve developed and now open-sourced. DPTrainer smoothly integrates Opacus and Hugging Face Trainer so that you can train privacy-preserving models without rewriting training loops or modifying trainer source code.

The importance of differential privacy

It’s been widely observed that the quality of a model scales along three axes: size, compute, and data. Larger models offer more capacity but suffer from less efficient training and costlier inference. More compute used during training naturally incurs higher costs and takes more time. The data axis, on the other hand, is mostly constrained by the ability to acquire it in sufficient quality and quantity. 

Differential privacy is our solution to the data-gathering hurdle. Basically, differential privacy is a mathematical framework that protects individual data points used for training. The core guarantee: a model trained with differential privacy behaves almost identically whether or not any single example was included in the training set. For LLMs, which are known to memorize training data and can reproduce it in response to adversarial prompting, this is the strongest known defense against leakage. Even sophisticated Membership Inference Attacks, given access to model weights, confidence scores, and the base model architecture, cannot determine whether a specific example protected by this method was included in the training set.

In practice, differential privacy is applied to neural network training through what is known as the differentially private stochastic gradient descent (DP-SGD). Rather than computing a single gradient over the entire batch, the DP-SGD computes one gradient per sample, clips it to bound outliners, aggregates the gradients in the batch and than injects noise making the footprint of any single example indistinguishable.

By guaranteeing the privacy of our training method, we can exploit previously unavailable channels and use data generated every day through our IDEs (see our data collection policy and a recent post on data sharing for AI). This gives us high data quantity due to the size of our user base, as well as high data quality, as the data is generated in the process of writing code, not just extracted from the final product. Such advantages guarantee that our upcoming models will hit above their weight (pun intended).

The gap it closes

Opacus is the go-to library for DP-SGD in PyTorch. It provides everything you need: per-sample gradient computation, a DPOptimizer, privacy accountants, and Poisson-sampled data loaders. The catch is that it’s designed around a manual PyTorch training loop, which is inconvenient and not well integrated into the Hugging Face platform.

Hugging Face Trainer and Transformers Reinforcement Learning (TRL)’s alignment trainers (e.g. SFTTrainer, DPOTrainer) are the top high-level training APIs for transformers. They handle distributed training, checkpointing, evaluation, callbacks, and many other things you don’t want to reimplement. However, they have zero awareness of differential privacy.

Wiring Opacus into a Trainer-based workflow requires touching model wrapping, optimizer creation, data loading, loss computation, checkpointing, and callback management. These interact in subtle ways, and getting any one wrong can break your privacy guarantee, and do it silently.

To fix this, our researchers Evgeny Grigorenko and David Stanojevic created DPTrainer; and Mihajlo Linic now maintains it. DPTrainer handles these issues with care.

A genuine drop-in replacement

A key concept in differential privacy is the privacy budget. This concept represents the maximum theoretical risk of information leakage we are willing to accept. In other words, it is the maximum amount that any single datapoint could shift the output distribution. An important property of the privacy budget is that its expenditure is cumulative, forcing a trade-off between privacy and performance as higher privacy necessitates higher injection of noise into the gradient.

DPTrainer extends transformers.Trainer, and incorporates the privacy budget with an added PrivacyArguments dataclass.  Every standard training argument, callback, checkpoint, and evaluation workflow works unchanged, as can be seen in the following code:

from dptrainer import DPTrainer, PrivacyArguments

privacy_args = PrivacyArguments(
    target_epsilon=8.0,
    per_sample_max_grad_norm=1.0,
)

trainer = DPTrainer(
    model=model,
    args=training_args,
    train_dataset=train_dataset,
    privacy_args=privacy_args,
    data_collator=data_collator,
)

trainer.train()

Set a target_epsilon to match your privacy budget, and DPTrainer will handle the rest. The internal accountant keeps track of the budget expenditure, and the remaining budget is saved during checkpointing so the run can be easily resumed.

Privatizing TRL and other specialized trainers

The real power comes from privatize_trainer. Many workflows use Trainer subclasses: e.g. DPOTrainer for preference learning, SFTTrainer for instruction tuning, and Seq2SeqTrainer for generation. These all add task-specific loss functions and generation logic on top of the base class. Rewriting those to inherit from DPTrainer would be invasive and fragile.

privatize_trainer patches any Trainer-based class at runtime, injecting DPTrainer into its inheritance chain without touching the class’s own logic:

from trl import DPOTrainer
from dptrainer import PrivacyArguments, privatize_trainer

privatize_trainer(DPOTrainer)  # one line

trainer = DPOTrainer(
    model=model,
    args=training_args,
    train_dataset=train_dataset,
    processing_class=tokenizer,
    privacy_args=PrivacyArguments(target_epsilon=8.0, per_sample_max_grad_norm=1.0),
)
trainer.train()

The patched trainer keeps all its original behavior (e.g. reward computation, DPO loss, generation), while gaining DP-SGD. 

What DPTrainer handles, so you don’t have to

DPTrainer automatically manages the following:

  • Noise addition. Adds calibrated Gaussian noise to the aggregated gradients via DPOptimizer.
  • Gradient clipping. Clips each sample’s gradient individually before aggregation, not the batch gradient. Supports flat, adaptive (AdaClip), and per-layer strategies via clipping and per_sample_max_grad_norm.
  • Gradient computation. Wraps the model in Opacus’s GradSampleModule for per-sample gradients, which is required for DP-SGD correctness.
  • Optimizer creation. Intercepts create_optimizer to wrap the Hugging Face-created optimizer with DPOptimizer.
  • Data loading. Overrides get_train_dataloader to return a DPDataLoader with Poisson sub-sampling, which is what enables privacy amplification by sampling.
  • Noise calibration. Given a target_epsilon and your training configuration, DPTrainer computes the correct noise_multiplier automatically – no manual binary search.
  • Privacy accounting. A DPCallback hooks into the optimizer step and tracks the running privacy budget after every update.
  • Checkpointing. Saves and restores accountant state alongside model weights, so your privacy budget tracking remains correct after resuming.
  • Early stopping. A privacy-budget-aware stopping mechanism halts training automatically when the entire budget is exhausted.

Flexible configuration

PrivacyArguments exposes the knobs you’d expect:

  • target_epsilon / noise_multiplier: set one or the other – they’re mutually exclusive.
  • clipping: choose "flat" (standard), "adaptive" (AdaClip), or "per_layer".
  • poisson_sampling: toggle Poisson sub-sampling for privacy amplification.
  • grad_sample_mode: "hooks” (default).
  • accountant: privacy accountant type (RDP by default).
  • epsilon_log_mode: log budget expenditure at training steps, eval, both, or not at all.

Try our DPTrainer

Differential privacy is increasingly a compliance requirement, not just a research nicety. Regulations around training on personal data, and the growing awareness of membership inference attacks against LLMs, mean that teams need practical, auditable differential privacy training. The hard part has never been the math; it’s been the engineering. And DPTrainer removes that barrier.

If you’re training transformers on sensitive data and using any part of the Hugging Face ecosystem, this is worth a try.

show more
The CLion Roadmap: What’s Coming Between Now and Late 2026
Feed: The JetBrains Blog (https://blog.jetbrains.com/feed/)
Published: 2026-08-27 11:49:51 | Created: 2026-08-27 12:08:54

This blog post covers the updates we plan to introduce over the next four months in the upcoming minor releases (2026.2.x) and the next stable release (2026.3).

After reviewing your feedback and our strategic goals, we’ve decided to focus on improving agentic workflows, embedded development support, and the debugger. Here are some of the highlights:

Read on for the full list of planned updates.

Our team is committed to delivering an IDE that makes development smooth and productive. The roadmap below is preliminary, and we can’t guarantee that every issue or feature listed will be addressed or implemented in CLion 2026.2. Priorities may shift, and unexpected circumstances could require us to adjust our plans or timelines.

AI features

In the last release, we improved the agentic workflow for general debugging with a new skill. Next, we want to extend agentic debugging capabilities for embedded developers. We also plan to make it easier to set up a project with agent assistance, which can be especially helpful for those just getting started with CLion.

HardFault debugging skill

A hard fault occurs when an ARM Cortex-M MCU encounters a serious runtime error that it cannot recover from. Common errors include jumping to an invalid address, stack overflow, and dereferencing a bad pointer. HardFault_Handler can usually catch a hard fault, but it tells you nothing about what actually faulted. Debugging a hard fault means inspecting the CPU state at the moment of the crash, including registers, stack frame, fault status registers, and sometimes disassembly.

We want to let agents handle this for you.

Since the MCP debugging feature was introduced in the previous release, we’ve continued improving agentic debugging in CLion by adding more skills and exposing more IDE tools to agents. The new skill, planned for a future minor release, will be tailored specifically for embedded systems prone to hard faults. To support this, agents will have access to additional tools to enable more effective debugging of C and C++ code – including in embedded projects. Agents will have access to memory, register, and disassembly views alongside the already available stepping, breakpoints, and more. This skill will make it easier to develop and validate embedded projects with real hardware attached.

Agent-assisted project setup

There are several reasons why setting up a project in CLion may fail, ranging from a build system misconfiguration to missing toolchain components. For some highly customized projects, it may not be easy to investigate the root cause, even with the built-in IDE assistance. To fix configuration issues more quickly, CLion will offer your agent’s help. Once an issue occurs, the IDE will identify which agents you have installed, offer to pick one you prefer, and launch it in the terminal. The bundled skill will direct the agent to the required IDE tools to handle setup issues faster.

Debugger

Many of the planned debugger updates focus on embedded development workflows involving the DAP integration and debug profiles. We’ll also add support for LLDB 21 for Windows and update GDB for all platforms.

Debugger updates for embedded development

DAP support

Since we added support for the Debug Adapter Protocol (DAP) last year, we’ve been extending its capabilities. Embedded development will be the focus for the next DAP-related updates. Among those are support for the peripheral view, as well as debugging RTOS threads and FreeRTOS objects.

Debug profiles

JSON configuration: With debug profiles introduced in CLion 2026.2, configuring and switching debuggers is now much easier and more straightforward. For the next release, we want profiles to become more flexible, configurable for broader use cases, and with more options. We’ll add the ability to save a debug profile as a JSON file and to configure it manually or with the help of an AI agent. This will provide you with more configuration options than CLion’s UI currently exposes. You’ll also be able to import your existing JSON debug configuration, for example, from VS Code, so you get the same debugger settings in CLion without the need to reconfigure everything from scratch. This flexibility will be especially beneficial for embedded and agentic development.

Customized profile for Lauterbach TRACE32: Currently, configuring the TRACE32 debugger requires a generic DAP profile, which may not be convenient for everyone. We plan to add a debug profile template specifically designed for TRACE32, with customized fields and options to simplify configuration.

Moving embedded run configurations to debug profiles: Having separate run configuration templates, such as Embedded GDB Server or OpenOCD Download & Run, with debug profiles is redundant and may be confusing. Our plan is to move the necessary configuration options to embedded-related debug profiles so that you have all the required settings in one place.

General debugger updates

LLDB 21 support for Windows: Currently, the only LLDB-based debugger available for Windows is the JetBrains fork of LLDB for the MSVC toolchain, tuned for PDB and Natvis. However, we understand that some CLion users would prefer to use a newer LLDB version, and we want to give them that option. 

In the next stable release, we plan to add LLDB 21 support for Windows. MSVC toolchain users will be able to select this option in the debug profile settings – the IDE will suggest downloading the LLDB 21 build. The PDB and Natvis optimizations from the old bundled LLDB will carry over to the new one. The old bundled LLDB will also remain available as a separate selectable option.

Bundled GDB will be updated to v17.2 for all platforms.

CMake / Debug Profiles switcher improvements: We want to improve the UI of the profile switcher in the main toolbar. The goal is to make it easier to detect problems in CMake and debug profile configurations by adding helpful notifications. For example, when a selected debug profile is incompatible with an active CMake profile, you’ll see a warning in the switcher’s UI, and hovering over it will show a tooltip with a detailed explanation.

Embedded development: Support for QNX projects

QNX is a Unix-like real-time operating system used mostly in embedded, safety-critical systems. Today, there’s no built-in support for QNX in CLion. For example, the IDE doesn’t fully support QNX’s QCC compiler, so files often aren’t indexed correctly and developers lose code assistance.

We want to make CLion a solid tool for QNX development, providing essential IDE functionality. This includes support for the QCC compiler and the x86-64 and AArch64 target architectures, a dedicated debug profile, and agent-assisted configuration and debugging.

Build tools and project formats

We’re going to focus on improving code insight for projects with unsupported build systems.

Default resolve configuration: CLion resolves your code and provides smart features by relying on project-level information from your toolchain configuration. Currently, if you add a new file to your project but don’t update the toolchain configuration file accordingly – for example, CMakeLists.txt – CLion might not resolve the code in this file correctly. This means you don’t get proper highlighting, auto-completion, inspections, and other smart features. In other cases, a new file may never need to be part of your project at all – for instance, a header you’re just viewing – but you’d still benefit from smart features while working in it. For such cases, we want CLion to find an appropriate resolve configuration from the available toolchains and use it as the default one. If no such configuration exists, the IDE can use the toolchain from PATH. This mechanism will allow CLion to provide smart features for files outside your project configuration in most cases.

Bundled CMake will be updated to v4.4.2.

Language updates: Support for ISPC

ISPC (Intel SPMD Program Compiler) is a C-based language and compiler for writing high-performance parallel code that runs on the SIMD vector units in CPUs and GPUs. It is often used in performance-critical C/C++ codebases, such as physics simulations, rendering, and game engines.

CLion doesn’t currently recognize .ispc files, so mixed ISPC/C++ codebases lose code insight features on the ISPC parts. For the next release, we plan to add support for ISPC, including proper syntax highlighting, code analysis, and completion (CPP-23363).

Performance, stability, and decluttering

For the next release, we’re also focusing on maintenance – improving CLion’s performance, stability, and user experience.

IDE responsiveness: Several users have reported UI freezes and long indexing times in certain workflows and project configurations. We’re actively working on these issues and plan to improve IDE responsiveness by v2026.3.

Last stable version of the Classic engine: In v2026.2, we unbundled our legacy language engine, CLion Classic, and moved it to a separate plugin. This was another step in the transition to the new, more powerful CLion Nova engine, which is now the default. As announced in our blog, in v2026.3, we’ll release the last stable version of the Classic plugin compatible with the IDE. This will allow us to allocate more resources to Nova development and improvement. If your team still depends on Classic-specific behavior or workflows, please contact your customer success engineer, account manager, or our support team.

Unbundling the JavaScript and TypeScript plugin: Based on our internal statistics, almost no CLion users have used JavaScript or TypeScript support in their projects in recent years. Maintaining this built-in support requires resources and increases the CLion package size, with little benefit to most users. Therefore, we’re going to unbundle the JavaScript and TypeScript plugin in v2026.3.

If you do need JavaScript or TypeScript support, you’ll still be able to install the plugin via Settings | Plugins | Marketplace or from the JetBrains website.

Improvements to Dev Container support: We’re investing in Dev Container integration as CLion’s primary approach to container-based development and refining its current support. The goal is to make it easier to configure and expand what it can do.

Conclusion

The Early Access Program is just around the corner and will give you the chance to try all of the new features planned for the next major release for free. In the meantime, upgrade to CLion 2026.2 if you haven’t already done so, and let us know what you think!

DOWNLOAD CLION

show more
How Much Code Do Developers Really Let Agents Write?
Feed: The JetBrains Blog (https://blog.jetbrains.com/feed/)
Published: 2026-08-26 17:17:37 | Created: 2026-08-26 18:07:55

“100% of my code is written by [insert whichever AI coding agent is popular right now]!”
You’ve probably heard this claim many times this year.

We wanted to find out how many developers have actually fully outsourced code writing to agents and how the share of agent-generated code differs across regions, tech stacks, and seniority levels.

Luckily, our large-scale, globally representative Developer Ecosystem Survey 2026 gave us the perfect opportunity to uncover the trends. In May–July 2026, we asked over 15,000 professional developers worldwide:
“What percentage of the code that you produced last month for work was …?

  • Fully generated by AI agents
  • Written by you with some AI assistance
  • Fully written by you without any AI assistance”

The answer options were: 0%, 1%–20%, 21%–40%, , 81%–99%, 100%, and I don’t know.

Here is what we found:

Expectedly, manual coding is disappearing quickly, but not everybody has made the leap to a fully agentic development workflow yet.

On average, professional developers report that:

  • ~47% of their code is fully written by agents.
  • ~38% is written with some AI assistance.
  • ~27% is written fully manually.

However, adoption varies wildly across the board. Over half of all developers now write less than 20% of their code manually, and one in five writes literally zero code without AI help. At the same time, the group that relies almost entirely on coding agents (over 80% agent-generated code) remains a minority of around 22%. Most developers are sitting somewhere in the middle.

Agentic coding by professional experience

Interestingly, senior developers are among the first to hand coding over to agents. About a quarter of senior developers generate the vast majority of their code (over 80%) using agents, compared to a smaller fraction of juniors who tend to lean more toward AI-assisted workflows rather than fully agentic coding.

That said, not all seniors are agentic-first yet. Adoption varies widely within this group. See the charts below.

Agentic coding by most-used AI coding tools

About 32% of developers who report Claude Code as their most-used AI coding tool generate over 80% of their code with agents.

Interestingly, among developers who use Codex, this share is notably higher at 42%. The share of developers who don’t write code without AI assistance at all is 37% among Codex users, which is tangibly higher than among users of other AI coding tools.

Our interpretation is that while Claude Code is increasingly becoming the mainstream AI coding tool (already the de facto standard, with 39% adoption at work), its audience no longer consists predominantly of advanced users of agents. Codex, on the other hand, is catching up in terms of awareness and adoption, and its user base might have more advanced users seeking better value for money (Codex has historically offered higher quotas).

Cursor users are similar to Claude Code users – on average, 58% of their code is agent-generated, and for 28% of its users, coding agents generate over 80% of their code.

Agentic coding by main programming language

There is a clear split in agentic coding adoption by tech stack. Developers with Go, JavaScript, and TypeScript as their main programming languages report the highest shares of agent-generated code, averaging 54%–55%.
On the other end of the spectrum, C and C++ developers remain the least agentic, maintaining a much higher proportion of manually written code – 38% on average.

Java and Python developers sit in the middle with 48%–51%.

Agentic coding by regions

The geographic differences are remarkable. Developers across East Asia, particularly in China, Japan, and South Korea, are leading the charge in agentic coding: About twice as many developers there (32%–35%) generate the vast majority of their code (over 80%) with agents, compared with around 16% of developers in Europe and the UK.

Segments of developers by AI usage

We explored whether developers fall into recognizable groups based on how they write code today. Three profiles emerged: Agentic coders, AI-assisted coders, and manual coders.

See the methodology notes for more details on how we did this.

We deliberately use the word “coders” here to highlight that this is about the code generation process, not development as a whole.

Agentic coders (~31% of developers) mostly write code with agents nowadays:

  • On average, 84% of their code is fully agent-generated.
  • ~15% is written with some AI assistance.
  • ~6% is written manually without AI at all. 

Despite being the locomotives of agentic coding, only 46%57% of heavy users of Claude Code and Codex are agentic coders.

AI-assisted coders (~47% of developers) haven’t gone full agentic yet, but already write a large portion of their code with agents. They still prefer an AI-assisted development workflow and don’t hesitate to write some code manually if needed:

  • On average, 40% of their code is fully agent-generated.
  • ~60% is written with AI assistance.
  • ~20% is written manually.

Manual coders (~23% of developers) write most of their code manually, though they use AI sometimes, mostly in an AI-assisted rather than fully agentic manner:

  • On average, ~10% of their code is agent-generated.
  • ~25% is AI-assisted.
  • ~75% is manually written.

Whether you are all-in on agentic workflows or prefer hands-on coding, the shift is clear: Purely manual coding is quickly becoming a thing of the past.

In our previous blog post, based on the same survey data, we explored trends in AI coding agent adoption across the industry and the main players in this market.

We plan to share more materials on agentic development from the Developer Ecosystem Survey 2026 with the community soon. 

Stay tuned and subscribe to JetBrains Research blog updates below!

Methodology notes

Unrealistic responses – where the sum of the lower bounds of selected answers exceeded 150% or the sum of the upper bounds of selected answers fell below 80% – were not used in this analysis. This filter was applied on top of the regular data-cleaning filters used for Developer Ecosystem Survey data.

We used the midpoint of each answer bucket (0%, 10.5%, 30.5%, 50.5%, 70.5%, 90%, 100%) to calculate averages. The averages across the three categories of how code is written within the same group (e.g. seniors) could exceed 100% because of the bucketed nature of the answers, and respondents’ self-reports may not always be fully accurate.

We employed hierarchical cluster analysis with the Ward method and Euclidean distance on unstandardized bucket midpoints (e.g. 0%, 10.5%, 30.5%) to clusterize developers into homogeneous segments based on how they write code.

In this report, “professional developers” refers to respondents who reported being involved in coding or programming in any of the following job roles:

  • Developer / Programmer / Software Engineer
  • AI / ML Engineer
  • DevOps Engineer / Infrastructure Developer
  • Architect
  • Data Scientist / Data Engineer / Data Analyst
  • QA Engineer

Roughly 90% of the sample falls into the Developer / Programmer / Software Engineer job category.

The Developer Ecosystem Survey is localized into eight languages: English, Spanish, Chinese, Japanese, Korean, German, French, and Portuguese. We apply quotas on the required number of responses by region to help achieve accurate global representation. The quotas are proportionate to the number of developers in each region, based on estimates by our Data Science team. The detailed methodology of these estimates is described here.

The Developer Ecosystem Survey has been statistically reweighted to better represent the global developer population by region, employment status, programming language, and familiarity with JetBrains products (to avoid data skewed toward an excessively JetBrains-familiar audience). You can read about the weighting methodology for the Developer Ecosystem Survey here.

show more
Compose Multiplatform 1.12.0 Released
Feed: The JetBrains Blog (https://blog.jetbrains.com/feed/)
Published: 2026-08-26 13:28:41 | Created: 2026-08-26 14:07:54

Compose Multiplatform 1.12.0 is out! This version brings new tooling for AI assistants, improvements to web resource management, and finer control over desktop window states.

Here are the highlights of this release:

For a complete overview of the changes, check out What’s new in Compose Multiplatform 1.12.0 or the release notes on GitHub.

Get Started with Compose Multiplatform

MCP server for AI agents in Compose Hot Reload

Compose Hot Reload now ships with an experimental Model Context Protocol (MCP) server that connects AI coding agents to your running application.

Using the MCP server, an agent can trigger reloads, take screenshots, inspect the semantic tree, simulate clicks and text input, and read application logs. In practice, this means the agent can verify the results of its own edits. It can confirm that the reload succeeded, inspect the rendered UI, catch a runtime exception, and iterate – all without you describing what’s on screen.

AI agent uses the MCP server

For the full list of available tools and instructions on connecting your agent, see the Compose Hot Reload documentation.

Try Compose Hot Reload

Automatic font fallback for web

Compose Multiplatform for web now handles characters that your application’s fonts don’t cover. When it encounters an unresolved character during rendering, it downloads the matching Noto font subset on demand and recomposes the affected text. As a result, Japanese, Arabic, Devanagari, and emoji render correctly without you having to bundle fonts for them.

Testing fonts

Window and dialog API v2

This release introduces an experimental v2 of the API for WindowState and DialogState in the androidx.compose.ui.window.v2 package. It gives you finer control over how windows and dialogs are positioned and sized. You can:

  • Select the screen a window appears on.
  • Provide custom positioning and sizing logic, including logic based on the content’s intrinsic size.
  • Set minimum and maximum window sizes.
  • Position dialogs relative to their parent window.

The enhanced API also makes the asynchronous nature of window state changes explicit: It distinguishes the state you request from the state the window currently has.

For example, to center a window and give it a fixed size, use WindowPositionProvider and WindowSizeProvider:

val windowState = rememberWindowState(
    initialBoundsProvider = WindowBoundsProvider(
        positionProvider = WindowPositionProvider.CenteredOnScreen,
        sizeProvider = WindowSizeProvider.Fixed(DpSize(400.dp, 200.dp))
    )
)

With the API v2, you can also use WindowSizeProvider.Unconstrained to size the window to its content initially, while still letting that content expand with fillMaxSize() when the user enlarges the window:

WindowBoundsProvider(
    positionProvider = WindowPositionProvider.CenteredOnScreen,
    sizeProvider = WindowSizeProvider.Unconstrained
)

See the Window and dialog API v2 documentation for the full details.


Update your dependencies, try out the new APIs, and let us know what you think about Compose Multiplatform 1.12.0.

For everything that didn’t make it into this post, check out the full release notes or What’s new.

show more
AI Agents in DataGrip
Feed: The JetBrains Blog (https://blog.jetbrains.com/feed/)
Published: 2026-08-26 13:45:49 | Created: 2026-08-26 14:07:54

The most recent DataGrip release is packed with goodies, but the headline feature is the ability to work with AI agents. 

Today, we dropped a new video showing you how to get the most out of this integration. Whether you prefer Claude Code, Codex, or Junie, DataGrip powers them up with database capabilities, thanks to our built-in MCP tools and skills.


What’s covered in the video:

Connection Setup: Create data sources directly from a text description, a JDBC URL, or by importing connections from another tool.

Talk to Your Schema: Ask agents for insights into your database architecture using natural language.

Text-to-SQL: Query data using natural language requests. AI agents leverage your schema structure to deliver accurate results.

Schema Cleanup: Watch the AI auto-detect out-of-place tables and perform dependency safety checks before running cleanup operations.

Object Mentions: Learn how to target specific database objects using the @dbObject identifier or files using the @fileName identifier.

Watch the full video and let us know your thoughts! What scenarios would you love to see us support next?

show more
How Ubuntu Is Using Rust to Rebuild Core System Tools
Feed: The JetBrains Blog (https://blog.jetbrains.com/feed/)
Published: 2026-08-26 11:07:31 | Created: 2026-08-26 12:07:55

This post is based on a RustRover livestream hosted by our Developer Advocate, Orhun Parmaksız, with Jon Seager, VP of Engineering at Canonical. They talked about Ubuntu, Rust, and the future of core system software, including how Canonical is approaching Rust adoption and why some of the most important changes are happening in parts of the system users rarely see but depend on every day.

Watch the full video here 👇

There’s a version of this story where someone rewrote ls in Rust and called it a revolution. Ubuntu is taking a more deliberate approach. It started with a question Jon Seager asked himself shortly after he took on leadership of Ubuntu: what got us here probably won’t get us through the next 20 years – so what do we change?

The answer, it turns out, involved a lot of memory safety, a healthy appetite for calculated risk, and more opinions about the sudo password prompt than anyone anticipated.

Why Ubuntu is betting on Rust

Ubuntu has been around for over 20 years. It runs on 15 million deployments, and you’ll find it on servers, desktops, edge devices, and inside cars. That reach is exactly the reason why Jon’s thinking about security and resilience isn’t abstract. It has to work at scale, in a wide range ofacross industries, and in safety-critical systems where a crash isn’t just inconvenient.


When Jon joined as VP of Engineering, Rust wasn’t necessarily the plan. His thinking changed as he looked at what Ubuntu would need from its platform over the next couple of decades. 

“In my opinion, Rust provides the most compelling set of tools of the systems programming languages we have available for progressing that agenda.”

Jon Seager
Jon Seager VP of Engineering at Canonical

Security, resilience, and memory safety

The obvious argument for Rust is memory safety, but Jon frames it a bit differently. He talks about resilience as sitting at the intersection of security and reliability. He treats security and reliability as closely related, but distinct problems

An unhandled panic can create both a security risk and a reliability failure. In automotive systems, industrial control software, and safety-critical infrastructure, that difference matters less than the outcome: the thing stopped working when it shouldn’t have. Fewer memory bugs mean fewer crashes, fewer attack surfaces, and a system that’s harder to break in general. Canonical’s revenue is largely built on patching vulnerabilities and providing support.

Jon Seager’s long-term platform view

Jon describes the move to Rust as a long-term platform decision rather than a rewrite campaign.

The technical case is only part of the story. Jon is just as interested in who Rust attracts. Those are developers who care about correctness, think carefully about safety, and want to work on the kinds of problems Ubuntu needs solved. By building more of the platform in Rust, Canonical is creating a clearer path for that community to contribute.

GNU coreutils has existed for 30 years, and it’s great software. Jon was clear about that. But 30 years also means 30 years of accumulated bugs, and the argument that the Rust version has bugs too misses the point. The longer-term question is whether the platform ends up in a better place 20 years from now if more of its base is memory-safe by default.

What is changing in Ubuntu

Ubuntu is not rewriting everything in Rust. The headline version of this story often makes it sound that way, but Canonical is making selective, deliberate replacements where the security and maintenance case is strongest, starting at the boundary of LTS releases, where users have fallback options and the chances of getting it right are highest.

coreutils, sudo-rs, ntpd-rs, and UPKI

The first pieces landed in Ubuntu 26.04 LTS. uutils coreutils, the Rust reimplementation of GNU coreutils, shipped as the default with a goal of 100% bug-for-bug compatibility with the GNU tools. 

sudo-rs is the other big one in 26.04, and it takes a very different approach. Where uutils aims to be a drop-in replacement, sudo-rs is asking a different question entirely: if you were designing sudo today, having learned 30 years of security lessons, what would it actually look like? The answer involves some deliberate behavior changes. 


ntpd-rs is next on the list. Canonical announced in June 2026 that it’s funding the Trifecta Tech Foundation to bring ntpd-rs to Ubuntu as the default time synchronization utility, eventually replacing chrony and linuxptp with a single tool that handles NTP, NTS, and PTP. The plan is to archive it in Ubuntu 26.10, with a full default switch in Ubuntu 28.04.


UPKI takes a different approach. It’s a greenfield project built in collaboration with the Rustls project, aimed at bringing certificate revocation to Linux system utilities. That’s something that browsers figured out years ago, but that curl, wget, and OpenSSL still don’t handle. UPKI is targeting Ubuntu 26.10 as its first shipping milestone for certificate revocation.

Why ntpd-rs is more than a drop-in replacement

Accurate timekeeping is safety-critical in more places than it might seem: microcontrollers in planes, cars, and robots; cryptographic systems where keys rotate frequently; and positional systems where clock drift has real consequences. Chrony handles basic NTP well, but problems show up when you need PTP, the precision time protocol, which handles high-precision synchronization.

On Linux today, that means running chrony and linuxptp, and potentially a dedicated or satellite time source, then configuring all of them to talk to each other. Jon described  it as “quite unfun,” which felt like an understatement. ntpd-rs is meant to collapse all of that into one tool with one configuration file, with the added benefit of being memory-safe and efficient.

The trade-offs

Jon was clear that they broke some things. They knew they would, but they did it anyway because they accepted short-term breakage in exchange for longer-term benefits and built the transition so people could step back if needed.

Compatibility vs. deliberate behavior changes

  • uutils coreutils is trying to be 100% compatible, so that differences from GNU behavior are treated as bugs, not features. In practice, that’s hard. One recent example Jon shared: when you tell head to read N bytes from an empty file, GNU coreutils returns zero. The uutils implementation initially returned an error, which is arguably more correct. But it broke a buried script in an Obsidian snap, so the maintainer changed it back to match the GNU behavior anyway. Compatibility first.
  • sudo-rs makes no such promise. It asks what sudo should be, not what it was. One change that generated a surprising amount of heat was that by default, sudo-rs now shows asterisks when you type your password in the terminal. What can look like a small UX change generated surprisingly strong reactions. Jon’s take was basically that the new behavior is better – they thought it through and stand by it.

Why Ubuntu rolled this out at an LTS boundary

The LTS timing is deliberate. Long-term support releases are when enterprises upgrade, and they’re also the moment where fallback options matter most. By making these changes at the LTS boundary, Canonical ensures that if something breaks for you specifically, you have 15 years of maintained support on the previous release while you work it out. The legacy utilities remain in the archive. Nobody is being forced into the new behavior on a live production system without warning.

Ubuntu Rust: Packaging and delivery

Shipping memory-safe system software is one thing. Actually getting Rust code into a Linux distribution at distro scale is another, and much of the unglamorous work happens at this stage.

Crates, cargo auditable, and snaps

Canonical takes a vendoring approach to Rust dependencies rather than packaging individual crates as separate debs. All the crates for a given package get bundled together into a tarball and shipped as part of the finished artifact, similar to how Nix handles it. That keeps the dependency surface manageable and makes the builds deterministic, even if they’re not reproducible in the formal sense.

Earlier in 2026, cargo auditable was rolled out across all Rust packages in the Ubuntu archive. Every Rust binary now carries an embedded SBOM (Software Bill of Materials) listing the exact crates and versions used to build it. When a package gets rebuilt, the SBOM updates automatically. That makes it easier to identify exactly which crate versions are present when a vulnerability is discovered.

Then there are snaps. Whatever your feelings about them, Jon acknowledges they solve a specific problem that’s hard to solve any other way at Ubuntu’s scale: getting modern software to run on old releases. Because snaps bring their own runtime, you can ship a snap built against Ubuntu 26.04 and have it run correctly on 22.04 or 24.04. For Rust packages with climbing MSRVs, that’s not a small thing. It’s also how JetBrains ships RustRover across multiple LTS versions, which came up in the conversation.

What comes next

Canonical is approaching this incrementally. Each release cycle, the team looks at where replacing or rebuilding a component would bring the clearest security or maintenance benefit.

More Rust in system software and ecosystem funding

After ntpd-rs and UPKI, compression libraries are next in focus. Canonical is looking at bzip2-rs, zlib-rs, and zstd-rs. There are trade-offs here too. One of the zstd implementations catches a class of unsafe operations that the current C library allows, but with some performance cost unless you turn those checks off. Whether to ship with the checks on or off is the kind of decision that sounds small, but isn’t.


Jon put it plainly during the stream. Ubuntu’s goal extends beyond shipping Rust code to upstream contributions, security audits, funding for maintainers, and involvement in conversations about supply chain security at the infrastructure level. Canonical also hopes that some of this work can be reused or adopted by other Linux distributions.

show more
OpenTelemetry Comes to IntelliJ IDEA, GoLand, PyCharm, and WebStorm
Feed: The JetBrains Blog (https://blog.jetbrains.com/feed/)
Published: 2026-08-26 07:40:10 | Created: 2026-08-26 08:07:04

OpenTelemetry Comes to IntelliJ IDEA, GoLand, PyCharm, and WebStorm.

The OpenTelemetry plugin has broken out of the confines of JetBrains Rider. No sandbox exploit was involved – this escape was planned by our developers. With the 2026.2 release, the OpenTelemetry plugin is now available in IntelliJ IDEA, GoLand, PyCharm and WebStorm. Rider users needn’t worry – it still works there too.

The plugin brings logs, metrics, traces, and the service map from local applications into the IDE. You can inspect them without setting up a separate local observability backend.

What is the OpenTelemetry plugin?

While developing with your IDE, you can use the plugin to:

  • Find what happened immediately before an error.
  • See which services and dependencies a request reached.
  • Pinpoint where a request spent its time.
  • Check whether the application emitted the expected logs, metrics, and traces.
  • Ask your coding agent to do all of the above via MCP.

The plugin’s functionality complements what the IDE offers out of the box. Use a debugger to step through code, a profiler to analyze performance, and a production monitoring platform to watch deployed systems. Use the OpenTelemetry plugin to inspect runtime behavior while you build or test the application.

Imagine this

Say you are testing a feature that calls several services and a database before publishing a message to a queue. The request fails, and the console shows the exception, but not the path that led to it.

In the OpenTelemetry tool window, you can search the logs for the error. Open the relevant trace to see how the request moved through the system and where it failed. The Service Map shows the services and infrastructure involved.

Explore runtime data in the IDE

Search and inspect logs

Console output is manageable until several services start writing at once. The Logs view puts OpenTelemetry log records in a searchable table. You can filter by severity or content, then open a record to inspect its attributes.

Detailed log view showing timestamps, levels, and messages for different log types

Check metrics

Select a metric from the metric tree to plot its values while you use the application. This view is not a replacement for your production dashboards, but it lets you inspect what the application will export before you send the data to a production observability platform. If a new library adds noisy or unnecessary metrics, you can catch them locally and adjust the instrumentation before your DevOps and SRE colleagues have to handle them.

The metrics viewer displays CPU utilization data with real-time charts.

Follow a request through its trace

Open a trace to see its spans across services. Each span includes timing and attributes, so you can follow the request from start to finish and zero in on the operation that failed or slowed things down. Development is also a good time to look at the trace itself. Does it contain the spans and details you’d need during a real incident? It’s much easier to fix those gaps now than to discover them in production.

The trace table view with filtering capabilities and detailed information for the selected trace.
The trace viewer showing details of the POST request involving multiple internal DB and HTTP calls.

See observed relationships in the Service Map

Architecture diagrams go stale. The Service Map builds its relationships from collected traces, so it reflects the traffic the plugin has seen between services, endpoints, databases, and message queues.

Expected one HTTP call or database query, but the diagram shows several? Finding that during development gives you time to fix it before release.

Automatically generated service map showing the relationship between API endpoints, internal services, and PostgreSQL based on actual runtime traces.

Connect an instrumented application

The plugin does not add OpenTelemetry libraries or agents to your application. It configures where an already instrumented application sends its data.

Start an instrumented Java, Python, Go, or .NET application from a supported IDE run configuration, and the plugin passes OpenTelemetry Protocol (OTLP) environment variables that point to its built-in receiver. It passes the same variables to new integrated terminal sessions.

You can also point the application’s OTLP exporter at the endpoint shown by the plugin. If you already use a local OpenTelemetry Collector, add the plugin as an OTLP destination and keep the rest of your pipeline.

Runtime context for coding agents

The plugin has experimental MCP support through the JetBrains MCP server. A compatible coding agent can query the telemetry collected in the IDE with these tools:

  • get_log_records
  • get_spans
  • get_services
  • get_service_map

These tools give the agent evidence from a particular run, so that it can inspect the logs and spans or query the observed service relationships.

Getting started

  1. Install the OpenTelemetry plugin from JetBrains Marketplace for your favorite IDE.
  2. Instrument your application with OpenTelemetry libraries or agents.
  3. Start it from a supported IDE run configuration or a new integrated terminal session. The plugin will pass the OTLP environment variables. Alternatively, point the application’s exporter or your local collector at the endpoint shown by the plugin.
  4. Open the OpenTelemetry tool window and exercise the part of the application you want to inspect.

The plugin shows the signals it receives. If your application exports only traces, the Logs and Metrics views stay empty.

Full setup instructions are available in the OpenTelemetry plugin documentation.

Install it and tell us what you find

Try it on a real project, then tell us in the comments or through the issue tracker what worked and what still sent you to another tool.

show more
Ideas Worth a Longer Conversation: The JetBrains Research Podcast
Feed: The JetBrains Blog (https://blog.jetbrains.com/feed/)
Published: 2026-08-25 08:30:31 | Created: 2026-08-25 10:05:54

Every week there’s at least one new announcement about what AI will do to software development. Most of the conversation moves fast and stays shallow, focusing on productivity gains, job displacement, or which model scored highest on the latest benchmark.

We’re more interested in the questions underneath that noise, so we created the JetBrains Research Podcast. In it, we explore questions, such as: 

  • What does it mean to understand a system, not just generate its code?
  • What does psychology tell us about why teams succeed or fail? 
  • Why does verifiability matter more than prestige in training agents?

In our podcast, we are mainly interested in research in its various forms and the people behind it. Each podcast episode goes somewhere interesting with someone who has spent serious time on things that matter. In this blog post, we highlight the ideas that came up in these conversations.

Cat Hicks: Culture is infrastructure

“Culture is infrastructure. It is not just a “nice to have”. It shapes our thinking. It shapes our problem-solving. It directly changes the quality of work that we do.”

jbr podcast cat hicks

In our latest episode, we speak with Cat Hicks, psychologist and author of Psychology of Software Teams. We ask her: What actually determines whether software teams do good work? Why study teams instead of individual developers?

Hicks has found that signals of belonging, learning, and recognition from a team can cut developers’ measured AI identity threat, i.e. the fear that their expertise is becoming obsolete, roughly in half. She emphasizes that it is important to look at the team level to better understand what is going on with individual team members

For example, Hicks has developed a measure she calls overproduction pressure, which refers to the feeling that arises when it seems that only short-term output matters. When that pressure is high, people generate code without understanding it, distrust colleagues, and stop being honest with managers. 

Hicks also challenges the “lone genius” myth: the idea that teams should be built around one highly-talented individual. Instead she argues that it is actually better to strive for “more bands, fewer rock stars”. Highly collaborative cultures, such as open-source problem-solving, can be especially effective at achieving technology breakthroughs.

Tomáš Petříček: Five cultures, one argument

“Programming has never really [been] just implementing a specification.”

jbr podcast tomas petricek

In our fourth episode, we talk to Tomáš Petříček, a professor at Charles University in Prague who studies the history and philosophy of software. His book Cultures of Programming argues that programming has never been a single discipline. Instead, the following five distinct cultures have been competing and collaborating since the earliest days of computing:

  • Mathematical, which treats programs as formal objects to be proved correct.
  • Hacker, which values direct engagement with a running machine.
  • Managerial, which is focused on predictability and labor organization.
  • Engineering, which accepts that systems are complex and asks which practices make them reliable despite that complexity.
  • Humanistic, which begins with the question of what happens in a person’s mind when they interact with software.

Each culture has a different idea of what a program is, what good work looks like, and what matters most. These cultures explain why the same event can lead to varying diagnoses. Take, for example, the Knight Capital failure in 2012, where a software deployment error cost the company $460 million in less than an hour. Depending on which culture you approach the problem from, one diagnosis might differ wildly from another. Here are some example diagnoses from each of the five cultures:

  • A mathematician would ask what could have been formally guaranteed. 
  • A hacker would ask what low-level knowledge would have caught th eproblem. 
  • An engineer would ask about testing and rollback. 
  • A manager would ask about processes and accountability. 
  • A humanist would ask whether the system made its state legible to those operating it.

Petříček also talks about the current enthusiasm for AI agents, especially specification-driven development. He emphasizes the importance of looking at history. Since the 1960s, people have been trying to isolate the mechanical part of programming and automate it. But it hasn’t worked yet, because software development has always been more than just the implementation of a specification. Teams learn what they’re building through prototypes, conversations, and use.

Alexander Kulikov: What you’re building when the solution is unknown

“When you find a problem that does not get out of your head, this is probably the right problem.”

jbr podcast alexander kulikov

In our third episode, we chat with Alexander Kulikov, who heads the Algorithms and Complexity Theory Lab at JetBrains Research and is the Head of Computer Science and Artificial Intelligence B.Sc. program at Neapolis University Pafos. His description of the current climate is more honest than most: “amazing, exciting, and frightening at the same time.”

And the concern isn’t entirely theoretical. Chess engines, for example, surpassed every human player decades ago. Kulikov doesn’t know of any law preventing AI from eventually doing the same to theorem proving. He doesn’t expect it imminently, but he also didn’t expect AI-assisted coding to progress as fast as it has. His position is what he calls attentive uncertainty: neither denial nor resignation.

In the episode, we also talk about what it actually means to teach computer science in an era when AI can solve Olympiad problems. Kulikov’s curriculum strategy is simple: teach graduate students how to learn difficult things efficiently. The specific technologies they’ll need are unknowable. The ability to dive into an unfamiliar subject, build a mental model, and make progress is more durable than any particular skill.

That’s also why he still takes mathematics seriously in a world of AI-assisted coding. A student who understands the structure of a problem can test an AI-generated answer, identify missing assumptions, and recover when the first attempt fails. A student who only knows how to request an answer may not know whether the answer is trustworthy.

Kulikov also draws a distinction between researchers who are “birds” (i.e. ranging across fields, spotting connections from above) and “frogs” (i.e. digging deep into one area). In this analogy, he would be a frog. But AI, he thinks, could act as an artificial bird for specialists: lowering the cost of looking beyond your immediate field without requiring you to become a generalist.

Ibragim Badertdinov: From dentistry to coding agents

“Vibe checks don’t scale.”

jbr podcast ibragim badertdinov

In our second episode, we talk with Ibragim Badertdinov, the Lead Research Engineer at Nebius. He took a somewhat unusual path to AI research: he first graduated from medical university with honors, completed a dental residency, and then gave himself a year to try something else. In this episode, he talks about how he made that switch, what he learned at School 21 and on Kaggle, and the work that followed. Most notably, we talk about his work on building SWE-rebench.

SWE-rebench is an automated pipeline for evaluating coding agents on real software engineering tasks. Accepted to NeurIPS 2025, it also has over 12 million Hugging Face downloads and a million leaderboard visits a month. Its key design feature is decontamination, or pulling tasks from GitHub only after a model’s release date, so agents can’t be trained on the answers. This way, SWE-rebench isolates the model’s problem-solving ability from any potential exposure to training data. After its release, it made headlines when many models performed substantially worse on SWE-rebench tasks than on SWE-bench Verified ones (see the paper for more details). 

This is especially important, because the standard up to now has been SWE-bench Verified, and the reported scores from this benchmark carried significant weight, both in research and the wider industry. As was discussed in a recent blog post, this tendency to focus on only SWE-bench Verified scores can give us a misleading picture of model performance. The post also suggests ways to evaluate models more accurately.

Badertdinov also talks about why reinforcement learning with verifiable rewards has driven such dramatic gains in coding and math specifically. The insight is deceptively simple: in domains where you can verify whether an answer is correct, you can generate vast training signals automatically. Code runs or it doesn’t; tests pass or they don’t. That’s what makes software engineering tasks so valuable for post-training: not their prestige, but their verifiability.

Anna Kogan: The library that became infrastructure

“Right now, computer vision is not cool. LLMs are very cool.”

jbr podcast anna kogan

Our pilot episode is a conversation with Anna Kogan, founder and CEO of FitWise and former CEO of OpenCV.ai. She’s been in computer vision for 15 years and still believes in its scientific value: in computer vision, researchers gather a dataset, train a model, measure metrics, and solve specific tasks. In our conversation, we discuss challenges in the field, including monetizing open-source tools and slow adoption of AI in various industries despite the technology already existing. 

The gap between impact and resourcing for open-source tools is one thread in the conversation. An example we discuss is OpenCV, the open-source computer vision library she helped build into a global standard. It runs on billions of devices and gets 32 million Python downloads a month on PyPI alone. Because of these numbers, many people assume the library is maintained by several hundred developers, while in reality it’s been only two to eight developers at any given time.

Another conversation thread concerns a harder question: Why does computer vision adoption still move so slowly, even when tools such as OpenCV are clearly very popular? In response, Kogan brings up human movement in sports. Even though the technological advances are far enough along that people in sports could stop manually clicking through and annotating broadcast footage, organizations are resistant to adopting AI support. One reason is that it is still cheaper to hire workers in the Philippines to do this manual work, than it is to figure out an AI system to take it over. 

With FitWise AI, Kogan is interested in helping sports organizations see the value in computer vision adoption. They provide the data, 3D digital replicas of athletes’ body shapes and movements in real time; this data is collected via stadium cameras that are already streaming visual data. Sports organizations can apply their expertise to the visual data, and so far there have been interesting results. For example, one company extracted the angular velocity of a quarterback’s arm during a throw and showed that this is a strong predictor of elite performance. 

Tools like FitWise AI can change how teams understand performance and injury risk. It’s a domain where the technology is genuinely ahead of the industry’s willingness to absorb it, and Kogan is not waiting for the industry to catch up on its own.

Explore these ideas and more on our podcast

These are some of the ideas we discuss on the JetBrains Research Podcast. If you find a question you can’t stop thinking about, that’s by design.

All episodes are available on YouTube and Spotify (and any other major podcast platform). We publish new episodes about once a month. 

show more
Junie Can Now Run Entirely on Your Mac – No Credits, No Cloud
Feed: The JetBrains Blog (https://blog.jetbrains.com/feed/)
Published: 2026-08-24 14:10:39 | Created: 2026-08-24 16:04:56

Our first step into on-device coding agents 

Junie has been able to connect to local model runtimes for a while. Point it at Ollama or LM Studio, load a local model, and the agent runs against it. Plenty of people are already doing this. But it also means you have to pick the model, tune the settings, and handle a lot of manual setup – and small models can only help with a limited set of simple tasks.

So we’ve done all of that for you. Introducing Junie Local: It ships a model we chose and tuned against our own agent loop, installs with a single command, and runs entirely on your machine. No tokens, no quota, no code ever leaving your machine. And it’s free.

One command, no configuration

Inside Junie, run /local. The model downloads, the local server starts, and Junie switches over. There is no JSON profile to write, no runtime to install first, and no endpoint to point at.

The model is Qwen3.6-27B at 4-bit, there’s about 20 GB to download, and you’ll need an M5 Mac with 64 GB of RAM. Everything after the download happens on your hardware, so your prompts, source, and diffs stay put.

Your existing setup carries over. Plan mode, live prompting, guidelines, skills, and your /commands behave the same way. The engine changed, the agent did not.

Things we learned about making it fast

Everyone benchmarks generation speed. For a coding agent, that turns out to be the wrong number to chase because most of the time is spent on prefill, while the model reads files to work out what is going on. Optimizing for prefill is where the real gains were, which is why Junie Local starts at Apple M5: The M5 Neural Accelerator has 8-bit arithmetic instructions that M4 lacks, and using them gave us around 40% more prefill throughput. We are going to send that patch as a PR to MLX-VLM.

We also deliberately chose Qwen3.6 over the newer 3.8. Qwen3.8 needs reasoning enabled to work reliably, and with it on, tasks run roughly four times slower. On today’s Macs, 3.6 wins.

There is a lot more to it, including KV-cache reuse across tasks and the speculative decoding setup that roughly doubles generation speed. Read the deep-dive post here: How We Optimized the Qwen 3.6 Model for Our Junie Agent.

How good is it?

We evaluate every model on JetBrains’ own private test set before it goes near Junie, and Junie Local was no exception. Qwen3.6-27B scored on par with Sonnet 4.5 (10,000-token reasoning limit). GPT-5 at medium effort scored slightly higher.

Worth noting what those numbers include: We ship the local model with reasoning disabled entirely because our tests found it added very little quality and cost two to three times as many tokens. So, these results are what the model does without reasoning, against cloud models that had it switched on.

For everyday work, you most likely wouldn’t notice the gap. On complex architectural reasoning, you definitely would.

What changes when nothing is metered

Benchmarks tell you whether a model can do the work. They do not tell you what changes when the work is done for free.

Cost efficiency has been a dial you hold in Junie for a while: Plan on a strong model, implement on a cheap one. Junie Local turns that dial down to zero. When one more iteration is free, work you would never usually spend credits on becomes worth handing over. Junie Local is ideal for:

  • Multifile refactors and renames that were not worth the spend.
  • Test coverage gaps you have been ignoring for the past two quarters.
  • Dependency upgrades and framework migrations.
  • Getting oriented in a repository you inherited.


Long, repetitive, mechanical work is exactly what an agent is for, and exactly what you stop asking for when you are keeping an eye on your balance.

For some teams, the privacy you get with Junie Local is the whole reason to read this post. There’s no vendor data policy to review because there’s no vendor in the loop. If you work under client NDAs, that moves the conversation from “we assessed the provider” to “no provider was involved.”

It also works with no network at all. Once the weights are on disk, Junie Local behaves the same way when you’re sitting on an airplane as it does at your desk.

Yes, the requirements are high

We know that an M5 Mac with 64 GB of RAM is a big ask. We are not going to pretend otherwise, and we know it puts Junie Local out of reach for many people reading the post.

That is simply what it costs to run a 27B model well today, and it is the number we are working hardest to bring down. The aim is a lower memory floor, wider hardware, and more of the stack optimized. If the lofty requirements are the reason you cannot try Junie Local, rest assured that we are working to bring them down.

This is the first step

One model, one chip family, one platform. We started narrow because tuning one model across the whole stack beats supporting every model badly.

Mac was the starting point, not the plan. We already have working prototypes for DGX Spark and RTX 5090, and we are looking at 24 GB cards. Prefill behaves very differently on a discrete GPU, so much of the optimization work shifts to that hardware.

If you have thoughts on which platform should land next, now is a good time to let us know.

Getting started

Junie Local is completely free – no registration, no subscription, no credits, and no card required.

Open Junie, run /local, and feed it a task you’ve been putting off. Then tell us what broke, what surprised you, and what you want next. Every part of Junie came from that feedback loop, and this is no different.

show more
How We Optimized the Qwen 3.6 Model for Our Junie Agent
Feed: The JetBrains Blog (https://blog.jetbrains.com/feed/)
Published: 2026-08-24 14:11:34 | Created: 2026-08-24 16:04:56

A while ago, we launched a long-term project to enable users to run Junie entirely locally, with local inference, across a wide variety of hardware setups. After much anticipation, we recently released an initial version of Junie Local that works on a MacBook M5 with Qwen3.6-27B.

In this blog post, I will share what it took to make it work and why we chose to release it on Qwen3.6-27B rather than Qwen3.8-27B. We made optimizations across the whole stack, from the Junie agent itself to our chosen inference engine.

Let’s start with Junie – after all, this is where you will begin interacting with the local model.

Junie optimizations

Extending the agent’s rolling context

Like any other coding agent, Junie has a main execution loop, where all its work is performed:

  • First, the user specifies a task.
  • Then, Junie sends it to the LLM.
  • Then, the LLM responds with some tool calls (like Bash commands, instructions to read/write files, and more).
  • Finally, Junie sends the result of this command back.

Here is a very simplified flow chart of what is happening under the hood:

As you can see from the chart, the LLM continues to receive context-expanding requests, allowing it to partially reuse information from those it has already handled. To be more specific, this means we can reuse the prefill data from the previous request for the next, and this data is referred to as the KV-cache.

But when we ask Junie to do the second task in the same session, it takes only relevant pieces from the context and puts them in the window:

With cloud models, this usually works perfectly because even if the model needs the content of some files again, it will request access and process them again. Prefill is really fast, too.

For local models, that is not the case – prefill isn’t that fast, and it actually takes significant time to “read” files.

To solve this problem, we changed the logic for local inference. Now, we add every new request directly to the rolling context:

This way, we can re-use KV caches from the previous task, i.e. if the model has already read a file, it will stay in the context window, and we don’t need to “read” it again.

Maximizing initial reusable prefix

Another similar optimization we have made relates to the system prompt and initial context that Junie sends when starting a new coding session.

In the previous section, the flow was somewhat simplified: Upon the first LLM request, much more data is actually sent to the LLM than was shown in the chart:

As you can see, a whole different set of information is sent to the LLM. And all this information is sent and processed at the start of every new session. Naturally, we would prefer to be able to cache it somehow 🙂

With this in mind, we changed the order in which we send this data:

We also added special logic to the inference engine to cache the prefix all the way up to the user’s request, so for subsequent tasks (in the same project), it is simply reused. We left out any project context after the user’s request because it is quite small and mostly consists of top-level project files, so it can change frequently.

Getting progress updates to work

With more powerful cloud models, Junie asks the LLM to add a special block in an XML-like format with updates that will be shown to the user. Unfortunately, Qwen 3.6 mostly ignores such requests. At the same time, the model writes its actions as plain text as part of the result of an LLM request – i.e. the LLM sends some tool calls with some accompanying text explaining them.

So, the fix is simple – just use this text generated by Qwen 3.6 as an update for the user. Such adaptations are model-specific, that is to say that we were lucky that Qwen 3.6 behaves in this way – some models don’t print anything there, and others generate far too much text.

Removing unnecessary calls to the LLM

This next optimization, disabling all optional LLM requests, might seem trivial, but it really helped make the agent more efficient. In practical terms, this meant that we disabled any logic that produced a short description of the task. While it’s true that we sacrificed some UX by doing so, we didn’t consider this loss excessive. In addition, we completely disabled multi-agent mode, as the most efficient way to process LLM requests on an M5 is via sequential processing, so there is no point in enabling multiple agents – they will be bottlenecked by the inference anyway.

Model parameter optimizations

reasonning_effort: None

When we were testing the cloud version of the Qwen3.6-27B internally, we noticed that enabling reasoning does not add a significant quality boost. So, for the local version, we decided to completely disable reasoning. This is a big deal, as reasoning tokens used by the inference engine perspective are the same as tokens used to generate the main response. Therefore, with reasoning disabled, we need to generate 2–3x fewer tokens, and that translates to a 2x speed-up on task execution, with an insignificant effect on quality.

Quantization

We decided to use the 4-bit version because it performs only slightly worse on benchmarks than its 8-bit counterpart, and because generation is memory-bottlenecked, using the 4-bit version is ~2x faster than the 8-bit version. However, when we compared the prefill speed between the 8-bit and 4-bit versions, we noticed they were the same… We thought that this was odd, so we dug deeper.

Inference engine optimization

Prefill hack

Some might wonder why we’re even concerned about prefill anyway. After all, the whole internet is full of generation speed benchmarks and optimization options. 

Well, on a discrete GPU (like the RTX 5090), they might be right to question its importance. On that kind of hardware, it is indeed extremely fast because prefill is compute-bound, and discrete GPUs are usually quite powerful. This means you can get something like 3,700 t/s prefill speed on default configurations. On the M5 out of the box, it was somewhere in the neighborhood of 650 t/s. So when the model was requesting the content of the file, i.e. when investigating, the majority of time was spent on prefill, not generation! 

What is worse is that there was no difference between 4-bit, 8-bit, or 16-bit quantization in terms of prefill speed. But why? Well, prefill is compute-bound, which means we are not limited by the memory speed at all. And it turns out that the majority of matrix operations during prefill were performed in full 16-bit mode. i.e. all 4-bit weights were converted to 16-bit numbers before operations were performed. But the M5 processor has special operations for 8-bit numbers that are significantly faster than 16-bit operations. So, when we applied a patch to the MLX-VLM package that switched some* matrix operations during prefill to 8-bit, we got a ~40% prefill speed gain!

By the way, this is the main reason why we decided to focus on M5 chips. M4 chips don’t have these 8-bit arithmetic instructions, and the M4’s 16-bit arithmetic delivers 20–30% slower prefill.

*Qwen3.6-27B uses both full-attention layers and self-attention layers. We found that even under 4-bit quantization, the full-attention weights remain stored in full 16-bit precision. Since these layers stay at full precision regardless, we didn’t apply this optimization to them – it’s applied only to the self-attention layers, where it actually reduces memory/compute. Here is the link to the patch in MLX-VLM. What’s more, the same optimization can also be applied in vLLM, just by editing the model’s config file. Config example

Speculative decoding via MTP and n-gram matching 

As standard optimizations, we applied:

  • MTP (Multi-Token Prediction) with a separate draft model: A speculative decoding approach where a smaller draft model proposes several tokens ahead, which the main model then verifies.
  • N-gram speculative decoding: Instead of a draft model, this method looks for previously repeated token sequences in the context and “predicts” upcoming tokens by matching against them.

We enabled both methods simultaneously. In practice, this means that during generation, we sometimes accept not just the ~3 tokens proposed by MTP, but also up to 8 additional tokens accepted from the n-gram method. The illustration below shows raw-generated tokens color-coded by the method that produced each accepted token (draft model vs. n-gram).

Combined, this gives up to a 2x speedup in generation.

Qwen3.8-27b

Given all this, why didn’t we use 3.8 instead of 3.6?

Unfortunately, Qwen 3.8 requires reasoning mode to be enabled in order to function well. Without it, output quality degrades significantly – on typical tasks, it can even fail entirely, getting stuck in a loop where it repeats the same tool call indefinitely. But enabling reasoning mode substantially increases the number of generated tokens: At medium reasoning effort, roughly 5x more tokens are produced. Since prefill time stays roughly constant, the net slowdown is closer to 4x rather than a full 5x. That’s still a significant cost – which is why, for now, on Mac hardware, Qwen3.6-27b remains the better choice. 

Closing thoughts

I hope that after reading about our journey, you can see that focusing solely on generation t/s is the wrong approach when it comes to typical agent programming tasks.

You need to optimize all parts of the stack, including:

  • Generation and prefill: The token-by-token decoding process and the initial context-processing pass.
  • Model parameters and quantization: The model’s weight precision and configuration.
  • Agent harness: The surrounding orchestration layer (tool calls, control flow, prompting logic) that drives the model.

So, this is what we are planning to do in the future. M5 support is just the first step – we already have prototypes for DGX Spark and RTX 5090 (and we’re even looking at 24 GB cards, too), so stay tuned!

show more
Help AI Coding Agents Write Up-To-Date Code With Modern Golang Skills
Feed: The JetBrains Blog (https://blog.jetbrains.com/feed/)
Published: 2026-08-24 14:18:56 | Created: 2026-08-24 16:04:56

TL;DR

  • Repository on GitHub: Modern Go Guidelines.
  • Purpose: Modern Go Guidelines are a set of skills that help AI coding agents write up-to-date Go code that matches the Go version in your project.
  • Version support: The skills cover useful language features and standard library additions from Go 1.0 through Go 1.27. Guidelines for newer versions are excluded when your project uses an older version.
  • Focused context: The tool uses list for short guidelines and explain for detailed examples. This progressive disclosure approach gives agents detailed guidance only when they need it and helps them apply the skills more reliably.
  • Installation: You can install the plugin from the marketplace or a local repository. The integration requires the Go toolchain, runs from a local cache, and does not modify your project.

Why AI coding agents need modern Go skills

AI coding agents can produce working Go code, but they typically rely on outdated patterns. Older syntax appears more often in their training data. Newer language features and standard library additions may also fall outside their training cutoff.

The GoLand team created Modern Go Guidelines to close this gap. These Golang skills give agents an up-to-date reference for writing modern code. They help agents select features supported by the Go version in your project and avoid code that requires a newer version.

Modern Golang skills are an open-source contribution from the GoLand team to the broader Go community. You can use them with supported AI coding agents in the terminal. 

Modern code for the correct Go version

Newer code is useful only when your project can compile it. For this reason, the guidelines match the Go version declared in your go.mod file.

Consider a project that contains the go 1.25 directive.

The agent can receive skills for Go 1.25 and earlier. It does not receive Go 1.26 or Go 1.27 skills. For example, it can learn to use sync.WaitGroup.Go, which Go 1.25 introduced. It will not receive a suggestion to use errors.AsType, which requires Go 1.26.

This version check ensures that the generated code is compatible with your project. It also reduces the amount of context the agent must read. The agent does not spend tokens on features that it cannot use.

CLI tool with focused output

The agent uses a CLI tool that comes with the go-modern-guidelines plugin. It includes the use-modern-go skill, a set of instructions that teaches the agent when and how to use the CLI. The tool supports two main subcommands: list and explain. The skill tells the agent to run list for the relevant Go file before editing and to call explain when it needs details about a specific rule.

Each agent integration runs these subcommands through its own wrapper. The examples below use the CLI binary name.

Your agent uses the CLI to get skills for the Go version(s) used in your project. The list subcommand returns short, relevant guidelines. When the agent needs more context, the explain subcommand provides detailed guidance and code examples.

go-modern-guidelines list --file-path ./internal/worker/worker.go

Your agent can also set the version directly:

go-modern-guidelines list --go-version 1.27

The output starts with the newest applicable guidelines and includes a stable identifier (ID) for each one:

...
sync_waitgroup_go: Use wg.Go when spawning goroutines tracked by a sync.WaitGroup.
testing_t_context: Use t.Context() when a test function needs a context tied to the test lifetime.
json_omitzero: Use omitzero on JSON-tagged bool, numeric, struct, and time fields whose zero value should be omitted; keep omitempty for empty strings, slices, and maps.
...

The short output helps the agent find relevant guidance without loading all available explanations and code samples.

An agent may not recognize a recent Go feature or know how to apply it because the feature falls outside its training data. When the agent needs more information about a guideline, it uses the explain subcommand.

go-modern-guidelines explain generic_methods

The command returns a detailed explanation and a before-and-after example. The example compares an older pattern with its modern replacement, helping the agent apply the change correctly.

generic_methods:
  Since: Go 1.27

  Summary:
    Use generic methods instead of package-level generic helper functions when the operation naturally belongs to the type itself.

  Details:
    Generic methods keep operations in the namespace of the type that owns them. Keep package-level helpers for operations that do not naturally belong to one receiver type.

  Examples:

  Before:
    type Set[T comparable] map[T]struct{}
    func Map[T comparable, U any](s Set[T], f func(T) U) []U {
      out := make([]U, 0, len(s))
      for value := range s {
        out = append(out, f(value))
      }
      return out
    }
    names := Map(users, func(user User) string {
      return user.Name
    })

  After:
    type Set[T comparable] map[T]struct{}
    func (s Set[T]) Map[U any](f func(T) U) []U {
      out := make([]U, 0, len(s))
      for value := range s {
        out = append(out, f(value))
      }
      return out
    }
    names := users.Map(func(user User) string {
      return user.Name
    })

Your agent can request several explanations in one command:

go-modern-guidelines explain generic_methods atomic_types errors_as_type

What the guidelines cover

The project covers useful language features and standard library additions from Go 1.0 through Go 1.27. It also includes the patterns handled by the Go modernize analyzer.

The guidelines help agents choose patterns such as:

  • slices.Contains instead of a manual search loop.
  • min and max instead of handwritten comparisons.
  • cmp.Or instead of a chain that selects the first nonzero value.
  • sync.WaitGroup.Go instead of separate Add, go, and Done calls.
  • errors.AsType for type-safe error matching in Go 1.26 and later.
  • new(value) when you need a pointer to a value in Go 1.26 and later.
  • strings.CutLast and bytes.CutLast instead of LastIndex and manual slicing in Go 1.27.

These examples solve a common problem with generated code. An agent may know an older pattern because that pattern appears in a large body of existing code. The provision of explicit rules helps the agent choose the most current form of a given syntax.

These modern Go skills complement tools such as go fix. Our repository helps agents write current code from the start, while the go fix command helps update patterns that already exist in a codebase.

Installing the guidelines into your AI agent

You can install the plugin from the marketplace or from a local repository. Both methods require the Go toolchain on your PATH. On first use, the integration installs the command-line tool with go install and stores it in a local cache. It does not modify your project.

Install the plugin from the marketplace

  1. Open a session with your AI agent (for example, run claude in the terminal).
  2. Add the Modern Go Guidelines as a Claude marketplace:
/plugin marketplace add JetBrains/go-modern-guidelines
  1. Install the plugin:
/plugin install modern-go-guidelines
  1. Activate the guidelines:
/use-modern-go

The integration checks the Go version in your project and provides the AI agent with the corresponding guidelines.

Install the plugin from a local repository

Use a local repository to test the plugin before publishing or updating it. The repository root must contain the .*-plugin/marketplace.json file.

  1. Open a terminal and run your AI coding agent.
  2. Add the local repository as a Claude marketplace. Replace the example path with the absolute path to your repository:
<claude|codex> plugin marketplace add /absolute/path/to/go-modern-guidelines
  1. Install the plugin from the marketplace:
<claude|codex> plugin install modern-go-guidelines@goland-<claude|codex>-marketplace
  1. Start or restart your AI agent in your Go project.
  2. Activate the guidelines in the session:
/use-modern-go

The AI agent reads the marketplace definition from your local repository and installs the plugin in its plugin cache. Your repository remains the marketplace source.

Start with modern Go

Language releases move faster than model training cycles. Your coding agent needs a small, current source of truth to keep up.

Our repository of modern Golang skills provides that source, without sending irrelevant material to the agent. Your go.mod file sets the boundary. The list subcommand shows what applies. The explain subcommand adds detail only when the agent needs it.

Explore the project, installation instructions, and current guidelines in the Modern Go Guidelines repository.

Happy coding!

The GoLand team

show more
Spring Boot Configuration Management Best Practices
Feed: The JetBrains Blog (https://blog.jetbrains.com/feed/)
Published: 2026-08-21 08:35:26 | Created: 2026-08-21 09:59:55

Spring Boot provides comprehensive externalized application configuration support. It enables one application artifact to run in different environments by supplying values from various sources such as:

  • Property files
  • Environment variables
  • System properties
  • Command-line arguments


In this article, we’ll explore the best practices for managing Spring Boot application configuration.
A well-designed configuration strategy should ensure that:

  • Configuration remains separate from the application code.
  • The application fails to start when the required configuration is missing or invalid.
  • Default values can be overridden for each deployment environment.
  • Sensitive values are supplied by a dedicated secrets management system.

Configuration properties classification

Typically, Spring Boot application configuration falls into three categories:

  • Application defaults: Safe, non-secret values such as third-party service URLs, timeouts, and retry limits. Store these with the application.
  • Deployment configuration: Values that identify an environment, such as database hosts, queue names, and external service URLs. Supply these through the deployment platform.
  • Secrets: Passwords, API keys, certificates, and private keys. Store these in a dedicated secrets system.

For example, application.properties can provide application default configuration properties:

app.promotion-service.base-url=http://localhost:8181
app.promotion-service.timeout=3s
app.promotion-service.retries=3
logging.level.com.jetbrains=DEBUG
spring.jpa.hibernate.ddl-auto=validate
spring.jpa.open-in-view=false

A default value should be safe for every environment in which it may be used. Properties such as database URLs and credentials should never be hard-coded in the application code. If a required value has no safe default, validate its presence during startup.

Use @ConfigurationProperties for binding application properties

Spring applications can access configuration values through Environment, @Value, or @ConfigurationProperties.

Use Environment when property names must be resolved dynamically or infrastructure code needs direct access to property sources.

Use @Value for isolated values:

PromotionService(
  @Value("${app.promotion-service.base-url}") String baseUrl,
  @Value("${app.promotion-service.timeout}") Duration timeout,
  @Value("${app.promotion-service.retries}") int retries) {
    this.baseUrl = baseUrl;
    this.timeout = timeout;
    this.retries = retries;
}

Scattered @Value expressions make property names difficult to discover, validate, and refactor. A dedicated configuration type using @ConfigurationProperties supports all these features.

For related configuration properties, prefer @ConfigurationProperties. It provides:

  • Type-safe binding and conversion
  • Relaxed binding between property names and Java members
  • Group-level validation
  • IDE completion and navigation through generated metadata

For example, if we are integrating with a third-party REST API, we may want to configure the service base URL, timeout, and number of retries.

app.promotion-service.base-url=${PROMOTION_SERVICE_URL}
app.promotion-service.timeout=${PROMOTION_SERVICE_TIMEOUT:3s}
app.promotion-service.retries=3

In the above configuration, we are setting base-url value from the environment variable PROMOTION_SERVICE_URL and timeout value from the PROMOTION_SERVICE_TIMEOUT environment variable with a default value of 3 seconds.

Spring Boot supports setter-based binding. You can bind properties to a class that uses setters as follows:

@ConfigurationProperties(prefix = "app.promotion-service")
public class PromotionSvcProperties {

    private String baseUrl;
    private Duration timeout;
    private int retries;

    // Setters and getters
}

Register configuration types using @ConfigurationPropertiesScan:

@SpringBootApplication
@ConfigurationPropertiesScan
public class Application {

    public static void main(String[] args) {
        SpringApplication.run(Application.class, args);
    }
}

The @ConfigurationPropertiesScan annotation scans for @ConfigurationProperties annotated components and registers them as Spring beans.

Now we can inject PromotionSvcProperties into other Spring beans and access property values.

Prefer Records for @ConfigurationProperties binding

Typically, configuration is normally established during startup and remains unchanged for the lifetime of the application.

For most application configurations, a Java record is the preferred option. It provides immutability out of the box so that their values won’t be modified even by mistake in contrast to class-based binding where you can accidentally invoke a setter:

@ConfigurationProperties(prefix = "app.promotion-service")
public record PromotionSvcProperties(
        String baseUrl,
        Duration timeout,
        int retries) {
}

Spring Boot’s relaxed binding maps canonical kebab-case names such as base-url to the baseUrl field.

Sometimes we may want to bind properties to a bean provided by a third-party library, and we can’t change their source code to add @ConfigurationProperties annotation.

To bind configuration properties directly to a third-party class, declare it as a @Bean and annotate the bean method with @ConfigurationProperties:

@Configuration
public class ClientConfiguration {

    @Bean
    @ConfigurationProperties(prefix = "third-party.client")
    public ThirdPartyClientProperties clientProperties() {
        return new ThirdPartyClientProperties();
    }
}

You can configure the third-party.client properties as follows:

third-party.client.base-url=https://api.example.com
third-party.client.connect-timeout=5s
third-party.client.read-timeout=30s

If the third-party class is immutable or not supports setter binding, create your own properties class and use it to construct the third-party object:

@ConfigurationProperties(prefix = "third-party.client")
public record ClientProperties(
    URI baseUrl,
    Duration connectTimeout,
    Duration readTimeout
) {}


@Configuration
@EnableConfigurationProperties(ClientProperties.class)
class ClientConfiguration {

    @Bean
    ThirdPartyClient thirdPartyClient(ClientProperties properties) {
        return new ThirdPartyClient(
                properties.baseUrl(),
                properties.connectTimeout(),
                properties.readTimeout()
        );
    }
}

The wrapper approach is generally preferable because it avoids coupling your application configuration directly to the third-party library’s class structure.

Fail fast, fail early: validate configuration during startup

Configuration errors should be detected on application startup and fail fast if a configuration is missing or invalid. Add @Validated to a @ConfigurationProperties bean and apply Jakarta Bean Validation constraints to its properties.

@Validated
@ConfigurationProperties(prefix = "app.promotion-service")
public record PromotionSvcProperties(
 @NotBlank String baseUrl,
        @NotNull Duration timeout,
        @Min(1) @Max(5) int retries,
        @NotNull @Valid SyncProperties sync) {

    public record SyncProperties(@NotEmpty String cron) {
    }
}

With spring-boot-starter-validation on the classpath, binding or validation failures stop application startup. Validate required values, numeric ranges, nested groups, and other application-level constraints.

Use wrapper types when absence must be distinguished from a Java default. For example, an Integer annotated with @NotNull can identify a missing value, while an int defaults to 0.

You can also specify default values using @DefaultValue as follows:

@Validated
@ConfigurationProperties(prefix = "app.promotion-service")
public record PromotionSvcProperties(
 @NotBlank String baseUrl,
        @NotNull Duration timeout,
        @Min(1) @Max(5) @DefaultValue("3") Integer retries,
        @NotNull @Valid SyncProperties sync) {

    public record SyncProperties(@DefaultValue("0 0 * * * *") String cron) {
    }
}

In the above example, we have specified the default values for retries and cron properties using @DefaultValue which will be used in case these property values are not configured.

Understand property precedence

Spring Boot combines multiple property sources. When the same property appears in more than one source, the source with higher precedence supplies the effective value.

The following simplified order shows the sources most commonly used in application deployments, from lowest to highest precedence:

application.properties/yaml (low-precedence)
           ↓
profile-specific configuration files
           ↓
OS environment variables
           ↓
Java system properties
           ↓
command-line arguments    (high-precedence)

Spring Boot configuration loading precedence matters when troubleshooting a value that differs from the expected configuration value.

Environment variables are widely supported by operating systems, container runtimes, and cloud platforms. Spring Boot derives environment variable names from canonical property names by replacing dots with underscores, removing dashes, and converting the result to uppercase:

app.payment-timeout     -> APP_PAYMENT_TIMEOUT
spring.datasource.url   -> SPRING_DATASOURCE_URL

Determining the effective value of a property can be challenging when it is defined in multiple configuration sources. IntelliJ IDEA can display resolved configuration values as editor inlay hints. Selecting a hint identifies the property source that supplies the value and indicates whether it is overridden by another source, such as an environment variable or a system property.

IntelliJ IDEA also provides navigation between property declarations, @ConfigurationProperties members, and property usages. For custom configuration properties, this support is enhanced by the metadata generated by spring-boot-configuration-processor.

Store secrets in a dedicated system

Do not store passwords, API keys, certificates, or private keys in source control. Use a system such as HashiCorp Vault, AWS Secrets Manager, Google Cloud Secret Manager, Azure Key Vault, or an equivalent platform service.

Ensure that secrets are excluded from logs, error messages, configuration metadata, and publicly accessible management endpoints.

NOTE: In non-production environments, the Actuator env endpoint can help identify the source of an effective property. It should not be exposed publicly because configuration may contain sensitive information.

Recommended configuration management

There is no single configuration-management approach that works for every application. Choose a strategy based on the application’s architecture, deployment environment, and complexity.

Monolith

For a monolithic application, keep shared defaults in the application, use profile-specific files only where necessary, and supply deployment-specific overrides through environment variables. Store sensitive values in a dedicated secret manager.

Containerized workloads

For workloads running in a container platform such as Kubernetes, keep sensible defaults in the application and provide deployment-specific configuration through ConfigMaps. Store secrets separately in a dedicated secret-management system.

Microservices

For a microservices architecture, consider Spring Cloud Config Server to centralize configuration, governance, and versioning. Continue to manage secrets through a dedicated secret-management system.

Summary

Effective application configuration starts with sensible defaults, type-safe @ConfigurationProperties, and startup validation. Keep environment-specific values outside the application, understand property-source precedence, and store secrets in a dedicated secret-management system.

The right configuration strategy should reflect the application’s architecture and deployment environment.

During local development and debugging remotely, IntelliJ IDEA helps reveal the effective configuration by showing resolved property values and their sources, highlighting overrides, and providing navigation between configuration files and bound Java properties.

show more
PyCharm for AI-assisted Django Workflows
Feed: The JetBrains Blog (https://blog.jetbrains.com/feed/)
Published: 2026-08-20 13:06:50 | Created: 2026-08-20 13:58:54

The 2026 Django Developers Survey found that AI is part of the weekly or daily workflow for 90% of respondents. AI can write code quickly, but Django developers still need to understand the application, evaluate what the agent produces, and be accountable for what ships.

That makes your IDE more important, not less. PyCharm gives you the freedom to choose the agents and models you want, as well as extensive Python and Django support for understanding and reviewing the code they produce.

1. Bring your own agent

Leading agents such as Codex, Claude Agent, Junie, and Gemini run natively in PyCharm, while the ACP registry gives you access to dozens more, installable in a click from the same dropdown menu. You can use a JetBrains AI subscription or bring your own tools – the choice is yours.

Want to use your own model? Bring Your Own Key technology lets you connect existing provider credentials, while Ollama and LM Studio let you work with local models.

You choose the AI tools that fit your workflow. PyCharm doesn’t lock you into one provider.

2. Teach your agent your conventions

Skills give your agent reusable instructions and context. In PyCharm 2026.2, native skill support for Claude Agent and Codex lets you add a skill directly from the AI chat, either for a single project or across your entire codebase.

The curated Skill Repository also gives you a way to add official skills for technologies, including React, Postgres, and Playwright.

Skills let you encode useful context once and reuse it, so you spend less time repeating instructions to your agents.

3. Django 6+ support

PyCharm keeps up with Django’s release cycle, including Django 6.0 template partials. The IDE understands the new partial template tags and completes them as you type.

This matters especially when frameworks evolve. An agent’s training data may not reflect the exact Django version you’re running. PyCharm’s Django support is tied to the version in your project.

4. Review with confidence

AI generates code quickly, which makes reviewing and undoing changes more important than ever.

PyCharm gives you visual diffs, merge tools, integrated conflict resolution, and Git history in the IDE, so you can inspect changes before committing or merging.

Local History works independently of version control, recording changes as you work. You can compare a file with an earlier state and restore a version from before the agent touched it – even if you never committed the change.

5. See your Django architecture

Django applications can get big. Django Logical Structure presents your project from Django’s point of view rather than as a flat collection of Python and HTML files. You can follow a model to its serializer, its views, and the endpoints they serve.

Whether the code you’re reading was written by you six months ago, another developer, or an agent, PyCharm helps you understand how the pieces fit together.

6. Verify your API and your data

The Endpoints tool window gives you a structured view of your Django endpoints, including documentation, examples, generated HTTP requests, and OpenAPI information. You can send those requests directly with the built-in HTTP Client.

The same idea applies to your database. The data editor and viewer let you browse and query application data without leaving the IDE. After an agent generates a migration, you can inspect the resulting data and verify that the change did what you expected.

The IDE outlasts the agent

AI tooling is changing fast, but your developer workflow can stay consistent. PyCharm combines deep Python and Django support with access to the agents and models you choose.

Get 30% off PyCharm, and JetBrains will donate 100% of what you pay to the Django Software Foundation.

show more
Ready for Go 1.27 on Day One
Feed: The JetBrains Blog (https://blog.jetbrains.com/feed/)
Published: 2026-08-20 10:19:21 | Created: 2026-08-20 11:58:55

Go 1.27 is here, and the release notes have plenty to explore. Language updates include generic methods, promoted field names in struct composite literals, and improved function type inference. Beyond the language itself, Go 1.27 expands go fix with new modernizers and adds a profile for finding goroutine leaks. These updates touch many parts of everyday development.

GoLand 2026.2 recognizes the new language features in the editor, brings the go fix modernizers into code analysis, and can capture and analyze the new profile in its profiling tools. The GoLand team also added Go 1.27 context to the Modern Go Code Guidelines, so AI coding agents can handle the same language and API changes.

To explore these changes with the Go community, join the Go 1.27 Release Party on August 25, 2026, from 4:00 to 5:30 pm UTC (9:00–10:30 am PDT). The online event will include:

  • An overview of the main changes from the Go development team.
  • Practical demos.
  • Live coding.
  • A look at how GoLand supports Go 1.27.
  • A Q&A session.

Go educator Jesús Espino and GoLand Developer Advocate Ainsley Clark will host the event at The Blue Gopher, an online community space where Go developers can meet, talk, and spend time together.

Explore what’s new in Go 1.27

To help you discover the latest language highlights, GoLand also includes a dedicated What’s New in Go 1.27 page on the Welcome screen. It provides a guided overview of the new language and standard library features so that you can quickly see what has changed since the previous release.

Modernize your code with the official go fix tool

Adopting a new Go release isn’t only about writing new code. Existing codebases can also benefit from improvements in newer versions of the language and its standard library.

Go 1.27 expands the official go fix tool with additional modernizers that help you replace older patterns with their preferred modern equivalents.

GoLand 2026.2 brings these official recommendations directly into the editor.

Running go fix from the command line is useful for updating an entire codebase, but this is usually done separately from your daily coding tasks. You have to run the tool explicitly and then review its changes outside the context where you first encountered the code.

GoLand displays the same modernization opportunities as inspections directly in the editor. You can see why GoLand suggests an update, review it next to the affected code, and apply the corresponding quick-fix without interrupting your workflow.

GoLand supports all go fix modernizers, including those added in Go 1.27:

  • Generic iterator improvements
  • Safer unsafe pointer arithmetic
  • Improved atomic types
  • Embedded composite literals
  • Slice modernizations
  • Other official go fix transformations

After you review an update in one file, GoLand can analyze the rest of the project and collect every applicable modernization in the Problems tool window.

You can review each suggestion, inspect the generated diff, or apply updates across your project in bulk.

In addition, GoLand now lets you enable go fix as a pre-commit check (disabled by default). Before each commit, the IDE runs the official Go modernizers and automatically applies any available updates. This helps teams keep their codebases aligned with the latest Go recommendations as new modernizers become available.

Find goroutine leaks with the new Go 1.27 profile

Concurrency issues are often the hardest performance problems to diagnose. A goroutine may remain permanently blocked long after the original synchronization mistake occurred. This delay makes leaks difficult to identify from the running application alone.

Go 1.27 introduces a new Goroutine leak profile, and GoLand 2026.2 supports it from day one.

The profile reports goroutines that are permanently blocked because the synchronization primitive that they are waiting on, such as a channel, sync.Mutex, or sync.Cond, has become unreachable.

You can capture and analyze goroutine leak profiles alongside CPU, memory, mutex, block, and goroutine profiles directly in the Go Performance Optimization tool window.

The new profiler integrates with the redesigned profiling workflow in GoLand. You can switch between flame graphs, call trees, graph visualizations, and editor gutter annotations to find the source of a leak.

If your application is already running in production, you can import an existing pprof profile into GoLand and jump directly from the captured profile to the corresponding source code.

Help AI write modern Go 1.27 code

AI coding assistants can help you write code faster, but they often lag behind the latest Go releases. Even when they generate correct code, they may rely on outdated idioms or miss newer language features and standard library APIs.

GoLand addresses this with the updated Modern Go Code Guidelines for AI agents.

The guidelines provide supported AI coding agents with additional context about Go 1.27 language features, new standard library APIs, and current best practices. They also take your project’s Go version into account, helping agents generate code that uses features available for the version specified in your go.mod file.

As new Go releases appear, the guidelines are updated to help AI coding agents generate code that follows the latest Go recommendations.

Update to GoLand 2026.2 to use the latest Go 1.27 features from day one. If you’re new to GoLand, start a free trial and explore the full development workflow.

Happy coding!

The GoLand team

show more
New in Air: Multiproject View, a New Markdown Editor, and IME on Windows
Feed: The JetBrains Blog (https://blog.jetbrains.com/feed/)
Published: 2026-08-19 17:35:10 | Created: 2026-08-19 17:57:54

Air gets a new multiproject view: open several projects in one window and run agents across them in parallel. The sidebar groups tasks by project, so you always see which agent is working on which project – no more window juggling for multirepo work.

Markdown files now render as formatted text while you edit – clear headings, formatted lists, highlighted code – with no split preview. The syntax recedes while you read and appears when you edit.

And on Windows, Chinese, Japanese, Korean, and other IMEs now work as intended. This was one of our most-reported Windows issues, and it’s fixed.

Also in this release: a new Customize screen lets you pick your keymap, theme, and accent color on first launch, and Agent Review now lets you choose which agent and model run the review.

Download the latest Air release

Your projects now share one window

Until now, opening another repository in Air meant opening another Air window. The new multiproject view puts multiple projects and their tasks in one place. The sidebar groups tasks by project, search covers the full task list, and each task keeps its project and branch visible as you move between them.

This changes the unit of navigation in Air from windows to tasks. Start an agent in your backend repo, switch to the frontend while it runs, and then jump to a completed task in a third project – all without losing track of which agent is working where. Running and completed tasks stay visible together, so you can coordinate multirepo work as one workflow instead of several disconnected Air sessions.

You can also group tasks by status to see what needs attention, what’s running, and what’s ready to review.

Markdown files now read like documents

Air now renders any .md file with clear heading hierarchy, formatted lists, distinct code blocks, and syntax highlighting for commands, paths, and inline code.

It is still an ordinary Markdown file. The syntax recedes while you read and appears when you edit, making READMEs, plans, notes, and documentation easier to scan without parsing the formatting first.

Try the new release

Download the latest Air release at air.dev/download or update through JetBrains Toolbox. Try it, then tell us how it works for you.

show more
Rider 2026.2.1 and ReSharper 2026.2.1 Are Here!
Feed: The JetBrains Blog (https://blog.jetbrains.com/feed/)
Published: 2026-08-19 15:36:45 | Created: 2026-08-19 15:57:54

Our first minor update for the 2026.2 release cycle is ready to download. Here’s what’s new.

Rider

Rider 2026.2 put AI-assisted development front and center, and v2026.2.1 keeps that momentum going:

  • The bundled refactoring-code skill helps AI agents refactor code faster and at lower cost. Get the full story.

The refactoring-code skill, bundled in JetBrains Rider

Median task time

before: 157.9s after: 26.6s

83% faster

Cost per solved task

before: USD 0.52 after: USD 0.19

64% cheaper

Tool calls per task

before: 17.0 after: 6.2

63% fewer

Medians across fifteen C# refactoring tasks, each run roughly ten times with the same model and the same prompts. The only difference between the two arms was whether the agent could call Rider’s refactoring engine.

  • The bundled debugging-code skill lets AI agents investigate runtime issues in C#, F#, C++, and mixed-language projects, whether they’re built with .NET, Unity, or Unreal Engine. Agents can set breakpoints, step through code, inspect values and thread context, follow the call order, and check which branches are taken or whether execution reaches a specific line.
  • Rider’s quality-check hooks now support Codex in addition to Claude Code.
  • The bundled dottrace-analyze skill can now analyze snapshots captured while profiling Unity projects.

Note for Unreal Engine developers: The recommended skills for UE C++ – ue-code-authoring and ue-test-authoring – have been updated, but update notifications for them aren’t being displayed yet. If you already have the skills installed, please uninstall them and reinstall their latest versions by going to Settings | Tools | AI Assistant | Skills.

For the full overview, visit the What’s New in Rider page. You can also find the full list of fixes included in this build in our issue tracker.

ReSharper

The big news 🎉: Starting with 2026.2.1, ReSharper now runs in Out-of-Process (OOP) mode by default unless you’ve turned it off. This is possible because dotCover now supports OOP mode.

​Diagramming has improved as well. You can now explore type dependency and project dependency diagrams in OOP mode, so there’s no need to switch back to In-Process mode.

Last but not least, we’ve updated Junie to a new version that adds support for Claude Opus 5, so you can now pick it as the model powering your sessions.

​For more information, visit the What’s New in ReSharper page. The full list of fixes included in this build is available in our issue tracker.


That’s all for this update. Try out the new features and let us know what you think in the comments below or in our issue trackers (Rider, ReSharper).

show more
Rider Hands AI Agents The Keys To Its Refactoring Engine For Safer, Faster, And Cheaper Results
Feed: The JetBrains Blog (https://blog.jetbrains.com/feed/)
Published: 2026-08-19 15:37:39 | Created: 2026-08-19 15:57:54

We traced a frontier model through fifteen C# refactoring tasks and counted what it reached for. It piped text into interactive commands 468 times. It called git 422 times and sed 392 times. It ran dotnet build 163 times. Across 2,513 tool calls it performed a structural refactoring operation exactly zero times. Not because it was avoiding them: it had none to call.

Rider has dozens of C# refactorings, and as of 2026.2.1 an agent can invoke them instead of approximating them. The vehicle is a bundled skill called refactoring-code. It ships with the IDE, there is nothing to switch on, and it activates by itself as soon as an agent is asked to refactor C# code. We gave the same model the same fifteen tasks again with the skill in place.

The refactoring-code skill, bundled in JetBrains Rider

Median task time

before: 157.9s after: 26.6s

83% faster

Cost per solved task

before: USD 0.52 after: USD 0.19

64% cheaper

Tool calls per task

before: 17.0 after: 6.2

63% fewer

Medians across fifteen C# refactoring tasks, each run roughly ten times with the same model and the same prompts. The only difference between the two arms was whether the agent could call Rider’s refactoring engine.

Should compiler really be the oracle?

That count of 163 builds gave us pause at first. But then we realized that the agent was not compiling to check finished work, it was compiling to find out what its last edit had done. A correct rename follows overload resolution, partial classes, explicit interface implementations and documentation references, and it knows the difference between a type called Order and the word “order” in a comment. None of that is recoverable from a regular expression, so the agent guesses in text and lets the build score the guess.

Rider does not have to guess, because it has a resolved syntax tree. Its refactoring engine, powered by ReSharper, works from the same model that drives the IDE’s own inspections and navigation: it knows which declaration every identifier binds to, which overload each call resolves to, and where every reference lives across the solution. The knowledge the agent was reconstructing one build at a time is the knowledge the IDE would have applied in one go.

Our evaluation methodology

Rider has dozens of C# refactorings and we did not try to cover them all when testing the efficacy of the refactoring-code skill. We evaluated eight, chosen because they have the cleanest contracts: a defined target, a defined result, and a refusal when the change is unsafe. Those are the ones where success and failure are unambiguous, which is what makes them worth measuring in the first place.

  • rename_refactoring: rename a symbol and every reference to it
  • extract_method: pull a statement range into a new method
  • extract_interface: derive an interface from an existing type
  • extract_base_class: lift members into a new base class
  • change_api_signature: alter parameters and update all call sites
  • move_type_to_namespace: relocate a type and repair usings
  • reorganize_namespaces: align namespaces with folder structure
  • safe_delete: remove a symbol only when nothing depends on it

Fifteen tasks covered the eight operations, most in two variants: a straightforward case and a harder one with more call sites or more entangled dependencies.

Both arms ran gpt-5.5 through the Codex CLI, roughly ten times per task, and the only difference between them was whether refactoring-code was available.

Timing, cost and tool counts come from the recorded traces, and the comparisons below use a paired permutation test.

What the agent can do armed with a Rider skill

With the skill in place, the need for the build oracle disappears: dotnet build drops from 163 calls to 3. The scaffolding the agent had built around guessing goes with it, and total tool calls fall from 2,513 to 926 across the evaluation.

The agent did not stop editing text. sed remains its most-used tool, and the eight refactoring operations account for only 167 of those 926 calls. What changed is the division of labour: ordinary edits stay in the editor’s medium, and the structural changes, the ones whose consequences ripple beyond what the agent can see, go to the engine.

Time and money

Median task duration fell from 157.9 seconds to 26.6 seconds. The 95th percentile fell further, from 346.4 seconds to 56.9 seconds, because the slowest runs were the ones trapped in the edit-build-read-error cycle and those runs stop existing. Both improvements are significant under a paired permutation test.

Cost follows the clock. Median cost per task went from USD 0.33 to USD 0.12, and cost per solved task from USD 0.52 to USD 0.19, on roughly half the tokens: input fell from 436,745 to 208,524 per task, cache reads from 2,973,158 to 1,257,600, and output from 32,532 to 15,538.

Per-task results

Where the skill wins outright, slowest task first

The eight tasks where the skill-enabled arm was faster, cheaper and used no more tool calls, with both arms passing their tests. One representative run per arm, ordered by how long the baseline took.

Time (s) Tool calls Cost (USD)

Showing time in seconds.

Without the skill With refactoring-code
extract-base-class-2
337s
20s
-94%
move-type-to-namespace-1
297s
24s
-92%
rename-1
192s
35s
-82%
reorganize-namespaces-1
160s
25s
-84%
rename-2
157s
24s
-85%
extract-method-1
157s
25s
-84%
reorganize-namespaces-2
26s
11s
-57%
safe-delete-1
21s
19s
-9%
extract-base-class-2
24
3
-88%
move-type-to-namespace-1
25
7
-72%
rename-1
21
7
-67%
reorganize-namespaces-1
18
3
-83%
rename-2
16
7
-56%
extract-method-1
16
4
-75%
reorganize-namespaces-2
13
2
-85%
safe-delete-1
10
6
-40%
extract-base-class-2
1.146
0.090
-92%
move-type-to-namespace-1
1.046
0.160
-85%
rename-1
0.986
0.137
-86%
reorganize-namespaces-1
0.385
0.134
-65%
rename-2
0.327
0.162
-50%
extract-method-1
0.497
0.098
-80%
reorganize-namespaces-2
0.181
0.078
-57%
safe-delete-1
0.108
0.088
-18%

Eight of the fifteen tasks clear that bar, and the six that had taken the baseline over two minutes improved by 82–94%. The other seven are left out: two were solved by neither arm, one was solved without the skill but not with it, and four were already quick enough that invoking the IDE did not pay for itself. The aggregate figures quoted elsewhere in this post cover all fifteen.

Numbers show that the behavior changed, but they do not show how. So here is one task from the set, laid out call by call in both arms.

On the left, the loop this whole post has been describing: the agent finds the class, edits text to invent a base class, and then spends eleven builds negotiating with the compiler over what those edits broke. On the right, the same task with the skill in place: the same search to find the target, one call to extract_base_class, and a glance at the diff.

We picked extracting a base class because it was the starkest single swing in the evaluation, from 337 seconds and 24 tool calls to 20 seconds and three, but the shape of the change is the same everywhere the skill won.

One task, two trajectories

Extract Base Class as the model example

A single test case that shows, side by side, how the agent goes about a refactoring with and without Rider’s dedicated skill. It was the slowest task in the set without the skill, and the largest single improvement with it.

Without the skill

Time336.7s Calls24 CostUSD 1.15

rg "class ReportExporter" -n src/

find . -name "*.cs" -path "*Reporting*"

nl -ba src/Reporting/ReportExporter.cs

grep -rn "ReportExporter" src/ tests/

apply_patch src/Reporting/ExporterBase.cs

sed -i 's/class ReportExporter/& : ExporterBase/' src/Reporting/ReportExporter.cs

dotnet build

error CS0534: does not implement inherited abstract member

error CS1729: no constructor takes 2 arguments

sed -i 's/public ReportExporter(/protected ReportExporter(/' src/Reporting/ExporterBase.cs

dotnet build

error CS0122: inaccessible due to its protection level

... 9 further edit-and-build cycles ...

dotnet build

Build succeeded

With refactoring-code

Time19.8s Calls3 CostUSD 0.09

rg "class ReportExporter" -n src/

execute_tool::extract_base_class

target: ReportExporter

name: ExporterBase

members: Format, WriteHeader, Dispose

created src/Reporting/ExporterBase.cs

updated 4 files, 11 references rewritten

git diff --stat

5 files changed, 47 insertions(+), 23 deletions(-)

Trying this yourself takes one prompt. Update to Rider 2026.2.1, open a C# solution, and ask your agent to rename, extract, or move something. The skill activates on its own. Naming the operation helps: “extract an interface from OrderProcessor” gives the agent something concrete to reach for in a way that “clean up this class” does not.

This is the third of these skills we have measured. The earlier two gave the agent coverage data and profiler output. Rider ships a growing set of agent skills built on the same idea: let the agent tap into the IDE’s own intelligence rather than reconstruct it, and get better results for fewer tokens. Try them on a real codebase, and tell us how they did.

show more
Signatures, be true: domain errors and functional handling in Kotlin
Feed: The JetBrains Blog (https://blog.jetbrains.com/feed/)
Published: 2026-08-19 15:52:05 | Created: 2026-08-19 15:57:54
Sergey Chernov

Sergey Chernov

Sergey Chernov is a Lead Software Engineer at Salmon, specializing in functional Kotlin and type-safe system design. At Salmon, a technology-driven financial company building banking and lending products in Southeast Asia, Sergey works on authentication and verification systems: the platform layer responsible for keeping user access secure, reliable, and consistent across products. He has 10+ years of experience designing and building scalable backend systems.

Here’s a function that signs a document:

fun signDocument(
    documentId: UUID,
    code: String,
): Unit

In Kotlin, Unit means the function completes without returning a meaningful value – roughly equivalent to void in Java.

Got it? Now, tell me what could go wrong. You can’t

Yet, the code might be invalid. The signing window might have closed. The database might be down. The document might already be signed, or expired, or the request might have arrived out of order from a buggy client. 

Every one of those is a real outcome this function must reckon with. Not one is visible in the line above.

To discover possible failures and how to handle them, you could open the implementation. Then, the service it calls. Then, the exception handlers, the route mapping, the tests, the OpenAPI spec, and the client code that consumes it. 

You could read everything except the one thing that should have told you in the first place: the signature.

At Salmon, I work on authentication and verification. A mishandled failure is rarely cosmetic and the difference between two error cases can be the difference between letting the right person through and the wrong one. I’ve spent a fair bit of time on this question: how do you make a function’s expected failures part of what it tells you, instead of something you have to go digging for

This article is my answer. It uses Kotlin, but the concept carries to any language with sealed types.

Have no fear of “functional error handling”

Functional error handling”. That phrase scares people off. They expect monads, category theory, and a lecture. This isn’t the case. The goal is plain: the function signature should be enough to know how to call it and how to handle every expected outcome. Nothing hidden in the body. 

If a failure is part of the business logic, it belongs in the function signature, the API contract, and the client’s handling code, not buried in the implementation.

Salmon’s engineering culture runs on a few commitments: real ownership from day one, high standards held in the open, and a refusal to ship things that don’t actually work. A function that hides its failures is at odds with all three. 

So, in the case of the example above, the signature I actually want should look like this:

fun signDocument(
    documentId: UUID,
    code: String,
): Either<DocumentSignError, Unit>

We now have the inputs on the left of the function and the expected failure type and the success type on the right. 

Now, before we get to what Either is, we need to agree on what belongs inside DocumentSignError in the first place, because that’s where a lot of the value of this system comes from.

Three kinds of failure, but only one belongs in the signature

Not every bad thing that happens is the same kind of bad thing. I split failures into three groups, and each group gets handled differently.

01 · API CLIENT ERRORS

The caller used the API wrong: this means a malformed JSON, a missing header, an unsupported operation, a request that arrived out of sequence, access that isn’t allowed. 

A healthy client should almost never see these, and there is no designed screen for them, because a working app doesn’t produce them. Thus, you can collapse the whole category into coarse HTTP responses: a 400, a 403, a 404. You do not enumerate them one by one in your domain model.

02 · UNEXPECTED EXCEPTIONS

The database is unavailable. A dependency timed out. The network dropped. A null slipped through and you have a NullPointerException, or an invariant broke and you’re in an illegal state. These are not business outcomes. 

Nobody designs a user flow for “Postgres fell over.” You do not model these as domain errors. Instead, they become operational signals: a 500 to the client, a full stack trace in the logs, a spike in your error-rate metric, a page to whoever is on call.

03 · DOMAIN ERRORS

Here, the client behaved correctly, yet the operation still can’t succeed. 

The signing code was wrong. The window has closed. The document was already signed. Approval is missing. The policy rejected it. These are the failures a real user hits while doing everything right, and your designers have a specific screen for each one. 

This is the category that has to be visible. If a healthy client needs to handle two outcomes differently, those two outcomes have to be distinguishable in the type. This is the group that belongs in the contract.

I often see people mistakenly dragging the second group into the other two. For instance, people add DatabaseUnavailable to their error union as if it were a business failure. It isn’t. Let it throw, let the global handler catch it, and keep your domain model honest. 

HTTP 400 is not a domain concept. “Signing window closed” is.

In any case, if you recognize and split these three categories correctly, most of the design work is already done. The rest is choosing a mechanism that keeps the second group visible.

Why exceptions and their relatives keep losing

The default in most Java and Kotlin codebases is to validate, then throw:

fun signDocument(documentId: UUID, code: String) {
    if (signingWindowClosed(documentId)) throw SigningWindowClosedException()
    if (!codeMatches(documentId, code)) throw SignatureRejectedException()
    if (alreadySigned(documentId)) throw AlreadySignedException()
    // ... sign it
}

The signature says “returns nothing, succeeds.” But the implementation tells a different story, and the compiler will not make the caller listen to it. If someone adds a fourth exception next quarter, every call site still compiles, and every call site silently fails to handle the new case. You find out in production, and that’s not great.

Java tried to fix this with checked exceptions, and the instinct was right: force the caller to handle declared failures or pass them on. But it didn’t scale. And the Stream API doesn’t compose with checked exceptions at all, so you end up doing sneaky throws and wrapping everything back into runtime exceptions.

As it turns out, the better tool is already in the language itself. A sealed interface tells the compiler the complete set of subtypes, this means that when you handle these errors (using Kotlin’s when expression), the compiler can safely verify you haven’t missed a single case:

sealed interface DocumentSignError {
    data object SignatureRejected   : DocumentSignError
    data object SigningWindowClosed : DocumentSignError
    data object AlreadySigned       : DocumentSignError
}

Now the caller handles every case, and the compiler enforces it:

when (error) {
    SignatureRejected   -> showSignatureRejected()
    SigningWindowClosed -> showSigningWindowClosed()
    AlreadySigned       -> showAlreadySigned()
}

Add a fourth failure to the sealed interface and this when stops compiling until you handle it. And this is the whole game: the compiler now knows what can fail, and it won’t let you forget.

You just reinvented Either

Once you have a sealed error type, you need a way to say “this function returns either that error or a success.” You can build a wrapper by hand, and people do, for each result type, over and over. That gets verbose fast.

What you’re reaching for is a generic version of the same shape: a value that is one thing or the other, never both. Left for the failure, right for the success. That is Either, and you don’t need a library to understand it. It’s a sealed type with two cases and a handful of helper methods (map, flatMap, fold, getOrElse). If you’ve used Optional in Java or nullable types in Kotlin, you already know how it feels to work with. An Optional is roughly an Either whose left side carries no information, just Unit.

The payoff is that the failure set moves into the public type:

fun signDocument(
    documentId: UUID,
    code: String,
): Either<DocumentSignError, Unit>

Failures are no longer hidden in the function body; they are part of what the function tells you upfront.

Two unions people get wrong

Unfortunately, two anti-patterns show up constantly once teams adopt this, and both undo most of the benefit.

fun signDocument(documentId: UUID, code: String): 
Either<Throwable, Unit>

While this looks typed, the type says only “something can fail.” It does not say which expected failures the caller must handle, because Throwable is open, so a when over it always needs an else. You’re back to not knowing. 

This is essentially the same as throwing an error, and it’s why Kotlin’s own Result<T> type didn’t work out and isn’t recommended for domain modeling. If the left side is open, you’ve gained nothing.

The second is one broad union shared across a whole class, in the name of not repeating yourself:

sealed interface DocumentError {
    data object SignatureRejected   : DocumentError
    data object SigningWindowClosed : DocumentError
    data object AlreadySigned       : DocumentError
    data object TemplateNotFound    : DocumentError
    data object ExportFailed        : DocumentError
}
 
fun signDocument(...)     : Either<DocumentError, Unit>
fun prepareSigning(...)   : Either<DocumentError, SigningSession>
fun exportDocument(...)   : Either<DocumentError, ExportFile>

The compiler is happy, but now every method appears to return every error. signDocument can never produce TemplateNotFound, yet every caller has to account for it anyway. You get exhaustive handling full of impossible branches, which is just catch-all programming wearing a type.

The fix is to define one narrow union per public method:

sealed interface DocumentSignError { /* the three real failures */ }
sealed interface PrepareSigningError { /* its own set */ }
sealed interface ExportError { /* its own set */ }

Then each when handles only what its method can actually return. No else or impossible cases:

when (error) {
    SignatureRejected   -> showSignatureRejected()
    SigningWindowClosed -> showSigningWindowClosed()
    AlreadySigned       -> showAlreadySigned()
}

A little more typing up front, but worth it every single time you read one of these signatures later.

Composition, without drowning in the plumbing

Real flows chain steps, and each step can fail. Done naively with flatMap, the lambdas nest deeper with every step and the code gets ugly. 

You have a few ways out. Plain Kotlin handles it with early return:

val document = findDocument(documentId)
    .getOrElse { return it.left() }

Flat, typed, and the pattern itself needs no library: if you hand-roll Either, you write these helpers yourself. The syntax above happens to use Arrow’s getOrElse and left, but nothing here depends on the abstraction being fancy. 

If you want it cleaner, Arrow also gives you an either { } block where bind() unwraps a right value and short-circuits on the first left:

either {
    val document = findDocument(documentId).bind()
    validateStatus(document).bind()
    val signature = validateSignature(document, code).bind()
    markSigned(document, signature).bind()
}

This is the same idea Scala has had in the language for years with for-comprehensions. Use Arrow if the ergonomics help your team; it also brings useful types like non-empty lists. (But the contract idea does not depend on Arrow, and I’d rather you adopt the discipline than the dependency.)

The contract should survive the whole trip

A typed failure is only useful if it stays typed across the stack. Here’s the rule I hold to: services and repositories return domain errors, and you map to HTTP at exactly one place, the route boundary.

service.signDocument(request)
    .mapLeft { error -> error.toHttpResponse() }

Expected domain failures become an Either.Left. API-client misuse collapses to a coarse 4xx. Unexpected infrastructure failures and bugs stay as exceptions and become a 500. The controller is the only layer that knows about HTTP, and the layers beneath it speak in business outcomes.

There’s also a bonus most teams don’t realize here: If you publish your API client alongside the service, publish the error types with it. If you do this, the client handles failures with the same sealed union the server produces, and the two stay consistent for free.

How does this impact code review, and AI-generated code?

The day-to-day return on all of this shows up in review. When failures live in the signature, a reviewer can start from the contract instead of doing implementation archaeology. Did the error union change? Is this API-client misuse dressed up as a domain error? Does the new failure map to HTTP? You can answer those by reading the interface, before you ever open the body.

At Salmon and elsewhere, this agility matters more now that a large share of code is drafted by agents. 

When a model writes the implementation, an explicit contract is the cheapest way to check whether it did the right thing: you read the types, not the 200 lines underneath. You can put the rule in an agent instructions file, “return a typed error union, don’t throw for expected failures,” and the model will mostly follow it. But the way you verify is by reading the contract, not by trusting the prose. 

In fact, on our team at Salmon this is less a personal preference than a shared default: the contract is the unit of review, and a generated implementation doesn’t lower that bar. Deciding which failures an operation can actually produce is a judgment call, and the signature is where that judgment gets written down so the next person, or the next agent, has to respect it. Essentially, the signature is where ownership lives.

The honest tradeoff

This costs you something. More types, more mapping code, more verbose signatures. I won’t pretend otherwise. 

But the complexity was already there. The signing window could always close. The code could always be wrong. All this approach does is take that complexity out of the implementation, where it was hiding, and put it in the type, where it’s named, tested, and visible.

You are simply moving the work to where the compiler can help. It surfaces risk to the next caller instead of hiding it, makes clear what the code really does and stops broken paths from compiling. Making failures part of the signature is how those values show up at the smallest scale: one function telling the truth about what it can do. It is also how we work in practice at Salmon: we share these typed contracts across services and their clients, and in review we read the contract before the implementation.

A signature that returns Unit and throws in secret is lying to you about what it does. Make your signatures tell the truth!

show more
What’s Fixed and Improved in PyCharm 2026.2
Feed: The JetBrains Blog (https://blog.jetbrains.com/feed/)
Published: 2026-08-19 13:54:13 | Created: 2026-08-19 13:57:54

Across the PyCharm 2026.2 release line, we shipped 263 fixes and improvements. Many improve Python code insight directly, with more precise type inference, fewer false positives, smarter completion and imports, and more reliable refactoring. Here are some of the smaller changes you’re likely to notice in everyday Python development.


SQLAlchemy 2.0 support

SQLAlchemy has been a long-standing source of false positives – enough that several duplicate tickets have accumulated over the years. This release resolves a batch of them for the 2.0 style.

String forward-references inside Mapped[...] resolve correctly:

posts: Mapped[list["Post"]] = relationship(back_populates="author")

# "Post" now resolves to the model class

PyCharm also correctly infers the mapped type returned by Session.get(), instead of treating the result as the model class itself:

report = session.get(Report, report_id)

reveal_type(report)  # was: type[Report] | None   now: Report | None

Modern hybrid_property setters written as @name.inplace.setter are recognized, so assigning to the property no longer produces a warning. Model class attributes defined via mixins are picked up again, too, clearing the old unexpected argument reports on model constructors.

(PY-78816, PY-65142, PY-59732, PY-51906, PY-28762)


Code insight and type inference

Control-flow narrowing and “unreachable code”

Several false This code is unreachable reports and instances of lost narrowing across loops have been fixed. The common issue: flow analysis either gave up or over-eagerly narrowed to Never in branches it should have kept alive.

isinstance on a numeric union no longer kills the else branch:

def foo(y: int | float) -> None:

    if isinstance(y, float):

        pass

    else:

        print(y)  # was flagged unreachable, y inferred as Never

Narrowing also survives a while loop, so re-narrowing an optional attribute inside the loop body no longer reports a bogus has no attribute error.

(PY-83206, PY-83354, PY-88265)

Strings inside type annotations

A string used as metadata inside Annotated[...] – a Pydantic discriminator field name, for instance – is no longer parsed as a forward reference and flagged as unresolved.

(PY-48749, PY-82245)

Iterable unpacking and star expressions

PyCharm’s analysis of tuple and star unpacking could lose type information and fall back to Any. Unpacking a starred value into a tuple lost its element types, *-expansion collapsed to Any, and several genuine errors went unreported. Starred expressions preserve their element types:

def a() -> tuple[int, int]:

    return 2, 3

def b() -> tuple[int, int, int]:

    return (1, *a())  # no more bogus "Expected tuple[int, int, int]"

(PY-12592, PY-27205, PY-43585, PY-90219)

Augmented assignment

A cluster of false positives came from augmented assignments being misanalyzed. A simple /= on an int produced the wrong type:

foo = 5

foo /= 2

reveal_type(foo)  # was: int   now: float | int

(PY-80622)

Self and constructor return types

Self binds correctly through classmethod parameters typed as type[Self]:

class A:

    @classmethod

    def bar(cls, y: type[Self]) -> Self: ...

x = A.bar(A)      # was a spurious "Expected type[A], got type[A]"

reveal_type(x)    # was: Any   now: A

Construction also respects __new__, __init__, and metaclass __call__. When __new__ returns something other than an instance, that’s the constructed type – even when an __init__ is present. The same fix covers explicitly parameterized calls like MyClass[int]() and __new__ assigned as a class attribute.

(PY-89296, PY-77611, PY-88644, PY-89571)

Enum members: Literal types for .value and .name

Reading an enum member’s .value or .name yields a precise Literal instead of a widened str or int, so assignments to Literal[...] target type-check. This matches mypy’s inference:

from enum import Enum

from typing import Literal

class E(Enum):

    a = "a"

b: Literal["a"] = E.a.value   # was: Expected 'Literal["a"]', got 'str'

n: Literal["a"] = E.a.name    # .name is a Literal too

(PY-61028, PY-79198)

Parameter types inferred from decorators

When a decorator constrains the callable it accepts, the decorated function’s parameters are inferred from that constraint instead of falling back to Any:

from typing import Callable

def d(fn: Callable[[int], str]): ...

@d

def f(a):

    reveal_type(a)   # was: Any   now: int

(PY-79204)

Also fixed

  • Keyword arguments in a class header are validated against the base class’s __init_subclass__ signature, and offered in completion (PY-79173).
  • An ellipsis in a Callable used as a PEP 695 type-parameter bound no longer reports a bogus Invalid type expression (PY-83570).
  • Type-checker findings are split into granular suppression codes rather than a single PyTypeChecker id, and # noinspection directives accept a simplified name form. PyTypeChecker still works as a blanket ignore (PY-90265).

Completion and auto-import

Smarter auto-import 

Auto-import is now noticeably less noisy. Previously, if a module was already imported, PyCharm would offer to add a second, redundant import instead of qualifying through the one you already had. The quick-fix – and the completion popup – prefer to reuse the existing import.

Given pkg/src.py containing MyClass, and a file that already imports the module, Alt+Enter produces this:

from pkg import src  # no longer flagged as unused

src.MyClass

instead of adding from pkg.src import MyClass. The same reuse logic applies to plain import pkg.src, and to the auto-import completion on a second Ctrl+Space.

Nested classes can be auto-imported too, which is something PyCharm didn’t previously support:

# mod.py

class Outer:

    class Inner:

        pass

# main.py – Alt+Enter on Inner now offers "Import Outer from mod"

from mod import Outer

value = Outer.Inner()

(PY-87970, PY-87971, PY-87972, PY-88009, PY-88016)

Completion for unittest.mock.patch() targets

Patching by string target previously offered no code assistance, so dotted paths had to be entered manually. The string argument to mock.patch(...) gets code completion for modules, classes, and their attributes, and it no longer suggests the invalid as keyword mid-path:

from unittest import mock

# sample.py defines: class Foo: my_attr = 42

with mock.patch("sample.Foo.my_attr", 14):

    ...

# completion now offers `sample`, `Foo`, and `my_attr`

(PY-89189, PY-89191, PY-89192)

Typed signatures when overriding built-in methods

Completing an override of a dunder or built-in method fills in the full annotated signature – and auto-imports the types it needs – instead of bare parameters:

from types import TracebackType

class A:

    def __exit__(self, exc_type: type[BaseException] | None,

                 exc_val: BaseException | None,

                 exc_tb: TracebackType | None): ...

# was: def __exit__(self, exc_type, exc_val, exc_tb):

(PY-79218)


Editor and inspections

Type inlay hints

Inferred type arguments are shown inline at the call site, so you can see what a generic resolved to without hovering over it:

class A[T]:

    def __init__(self, t: T): ...

A[int](1)     # [int] shown as an inlay hint

Type names rendered inside inlay hints – return types and solved arguments alike – are also clickable, so you can jump straight to a type’s definition from the hint.

(PY-90411, PY-90293)

f-string format-spec validation

PyCharm already validated the str.format() mini-language. Those checks apply to f-strings too, and PyCharm flags formatting a type that doesn’t implement __format__:

data = 1

f"{data:.2f}"   # ok

f"{data:.2q}"   # now flagged: unsupported format spec

class A: ...

f"{A():d}"      # now flagged: A doesn't support the 'd' format

(PY-51322, PY-89760)


Refactoring

The Rename refactoring also updates references to a module when the module itself is renamed. Previously, the renaming left importing sites pointing at the old name:

# rename provider/provider_module.py → some_module.py

from ..provider import provider_module  # this reference is updated too

(PY-53274)

The Refactor | Field action is now Attribute, and the documentation says “instance attributes” to match Python terminology (PY-85828).


Conclusion

Taken together, these changes make PyCharm’s understanding of Python more precise and predictable: fewer false positives, better type inference, smarter completion, and less time spent working around cases where the IDE gets valid code wrong.

Many of these improvements started with real-world examples reported by users. If PyCharm still misunderstands a typing pattern, framework API, or other valid Python code in your project, let us know in YouTrack – a small reproducer can help us turn that friction into the next fix.

Try PyCharm 2026.2 and let us know which improvements make the biggest difference for your workflow.

Thank you for using PyCharm!

show more
How to Migrate From Atlassian Jira and Confluence to YouTrack: Expert Guide
Feed: The JetBrains Blog (https://blog.jetbrains.com/feed/)
Published: 2026-08-19 10:27:05 | Created: 2026-08-19 11:57:54

Atlassian recently announced that they are suspending sales for Data Center Products, followed by the end of life for those products in 2029. Additionally, this August, Atlassian began using certain customer data to improve its AI experiences. In light of these changes, switching to an alternative solution has become a priority for many organizations. 

Around 70% of the customer projects currently discussed by the YouTrack team and our consulting partners involve migrating to YouTrack. Organizations are looking for a long-term, self-hosted alternative to their current setup, a cost-effective solution to bring projects, a Knowledge Base, and a Helpdesk together, or greater control over how AI fits into their work.
In this guide, we’ll share practical advice for migrating from Jira, Confluence, and Jira Service Management to YouTrack. You’ll also learn from real customer experiences and see how our consulting partners can support your migration with a free demo, proof of concept, and expert guidance.
Migration experience overview 

We’ll walk you through how your Jira, Confluence, and Jira Service Management setup can be imported and migrated to YouTrack. If you’re migrating from another project management system, or even from chats, emails, Excel, or Google Sheets, the same general steps can help you plan the process.
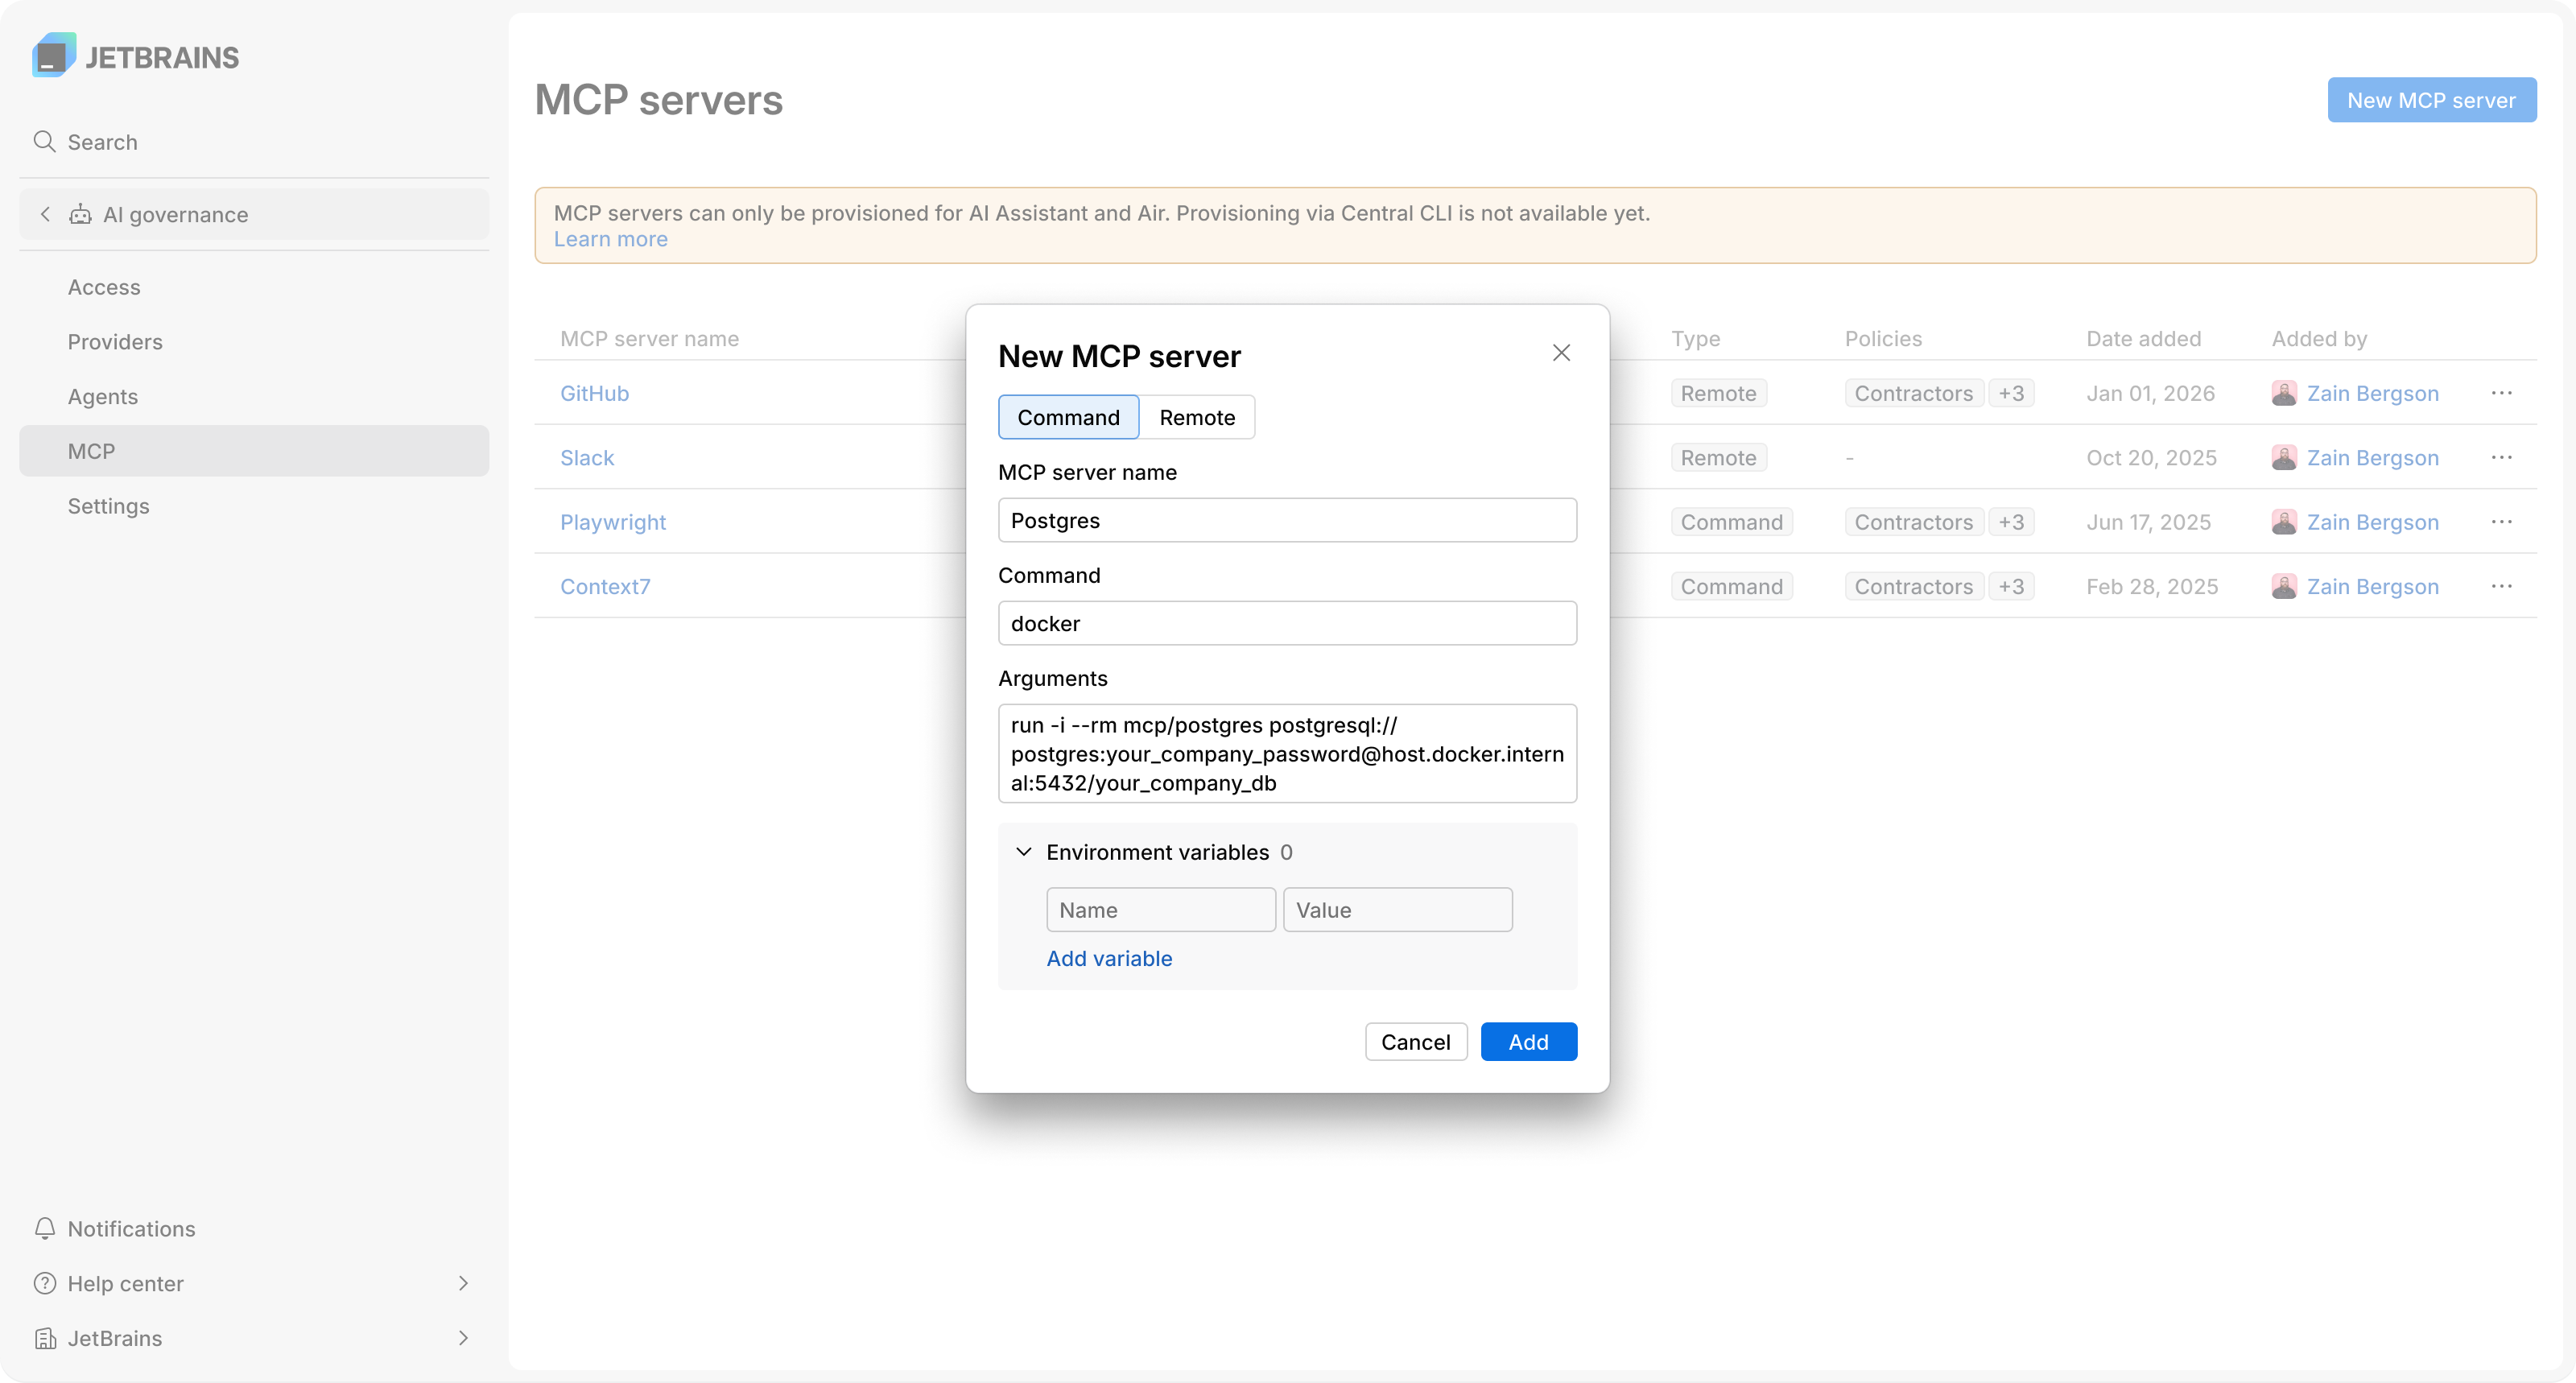
YouTrack lets your team choose between Server and Cloud, depending on how you want to host and manage your data. Regardless of team size, the core functionality is almost identical across both versions. 

With YouTrack Server, you host the data on your own server, ensuring a greater degree of control. If you want to know whether this is a good choice for your organization, you can consult the general technical requirements for larger installations, or our Support team will be happy to advise you. With YouTrack Cloud, you select from the available Amazon Web Services (AWS) regions: Northern California, Frankfurt, Ireland, and Singapore.

Here’s a brief overview of the steps you should take once you’re ready to start your migration:

  1. Get started with YouTrack for free. 
     
  2. Use the built-in import wizard to automatically migrate your project and user data from Jira, Confluence, Jira Service Management, Asana, ClickUp, monday.com, or other tools. 
     
  3. Recreate entities that aren’t automatically imported, for example, boards, reports, dashboards, or SLA policies for helpdesk projects.
     
  4. If your team relies on Atlassian Marketplace apps (formerly known as plugins), assess your needs before migrating. Some capabilities may be available in YouTrack out of the box or through similar apps from JetBrains Marketplace. Recreate the rest with custom workflows or apps built either in-house or with a YouTrack consulting partner.
     
  5. Try YouTrack with an extended team in your company, taking advantage of a 14-day free trial that allows up to 100 users on YouTrack Cloud or 10,000 users on YouTrack Server.
     
  6. Enable continuous import from Jira, Confluence, and other supported tools, so your team can use them in parallel during the free trial. Previously imported tasks will be automatically updated in YouTrack.

     
  7. When you’re ready to start using YouTrack with a team of more than 10 members, choose your paid option, and apply for a 25% discount when migrating from Jira Software or another competitive tool.

If you get stuck at any point along the journey, our team and partners will be happy to help. 

  • Check out the detailed migration guide in the YouTrack documentation (Cloud or Server).
  • Contact technical support with any questions.
  • Connect with YouTrack certified consulting partners for a free demo or a proof of concept for your migration project.
  • Estimate your migration steps with a practical migration whitepaper from our trusted partner twenty20.

What it takes to migrate: A step-by-step guide

For many teams considering a switch from the Atlassian stack, one of the key reasons was the announced end of Data Center sales and the end of support on March 28, 2029. After that date, impacted products will become read-only and receive no product updates or security fixes, increasing compliance risks and dependence on legacy systems.

Some teams are also concerned about Atlassian’s growing reliance on AI and its updated data contribution practices, effective August 17, 2026. De-identified and aggregated customer data may now be used to improve Atlassian’s AI experiences, with opt-out options varying by plan. A full opt-out is available only with Enterprise, requiring customers on lower-tier plans to upgrade.

With YouTrack, you choose between Server and Cloud and decide how AI fits into your work. Let’s walk through the migration steps and address the questions our customers often raise along the way.

Step 1. Choose your YouTrack version and start for free

Server or Cloud – YouTrack your way!

Choose between YouTrack Cloud, hosted by us, or YouTrack Server, installed on your own infrastructure. While Atlassian is shifting its customers toward its cloud platform, YouTrack Server remains fully supported. We feel a deep sense of responsibility toward customers who choose YouTrack Server and want to help teams of all sizes – from 10 users to thousands – keep their data and infrastructure under their own control.

If you have never used YouTrack, we recommend starting with YouTrack Cloud to get your instance set up quickly. It only takes about 2 minutes, and your team can migrate to Server with all the data from your Cloud instance at any time. Regardless of the version you choose, the functionality will be identical, so you’ll get a good sense of how YouTrack can be adapted to your needs.

AI or no AI – your choice!

YouTrack does not require your team to adopt AI. Administrators control which AI-powered capabilities are available, while individual users select the assistance they need. Depending on your requirements, you can:

  • Connect your preferred AI tools, IDEs, agents, and workplace apps through the remote MCP server, allowing them to work with your organization’s project context.
  • Use free built-in AI Assistance to create tasks, summarize content, and draft replies.
  • Keep AI turned off and continue using YouTrack without it, in line with your organization’s data-governance policy.


Start for free and scale on the go at a price you’ll love

Both YouTrack Cloud and Server are always free for teams of up to 10 users, so you don’t need to worry about budgeting for your pilot migration project.

When you need to invite an extended team to your pilot project, you can switch to a free YouTrack trial plan. The Cloud trial allows for up to 100 users for 14 days, and with a Server trial, you can have up to 10,000 users for 60 days.

You can switch to a paid subscription from the free plan or a trial at any time, and continue working with all your projects’ data. YouTrack Cloud offers flexible per-user monthly or annual subscriptions, and YouTrack Server uses an annual subscription model with user packs of 15, 25, 50, 100, 250, 500, or more users, including 1 year of upgrades and support. The result of this model is a savings in cost of ownership up to 80% compared to Jira and Confluence.

YouTrack brings projects, Knowledge Base, and Helpdesk together in one solution, so teams can manage work, document knowledge, and handle B2B customer support or internal service desk without switching tools. You no longer have to juggle multiple Atlassian products.

Step 2. Import your data from other systems

With YouTrack’s import wizard, you can migrate issues, tasks, and tickets from Jira, GitHub, GitLab, Mantis, Redmine, Bugzilla, ClickUp, Asana, monday.com, and Zendesk, as well as migrate tasks and projects from one YouTrack instance to another. 

For other systems, you can first export your data to a CSV or XLSX table and then import it via Google Sheets. You can also customize one of the existing scripts or create a new one from scratch to import data to YouTrack from an external source.

A full history of commit messages and pull requests from TeamCity, GitHub, GitLab, Bitbucket Cloud, and other version control systems can also be added to imported YouTrack issues via an integration with your VCS.

YouTrack can be configured to import continuously from Jira, Confluence, GitHub, and other tools. When continuous import is enabled, YouTrack checks the connected Jira or GitHub instance for changes in the imported projects every 10 minutes. Issues that have been added or updated since the previous check are imported and updated in YouTrack.

Import from Jira  

YouTrack’s Jira import wizard will get all your teams on board. Users, groups with memberships, and the activity history of all users will be automatically imported to your new YouTrack instance. For example, you would be able to see which user was assigned to a task or who left comments when the team was working on it in Jira. 

You also won’t lose progress on your work, as all projects will be imported to YouTrack along with their related tasks. Every imported task would have the same content, including attachments and comments, custom fields, and issue links.

What will be fully migrated?

YouTrack’s import wizard allows you to migrate the following data from Jira into YouTrack:

  • Projects. 
  • Users and their group memberships.
  • Issues in the projects, along with their custom fields, comments, attachments, and history data. 
  • Links between issues.
  • Labels, which become tags in YouTrack.
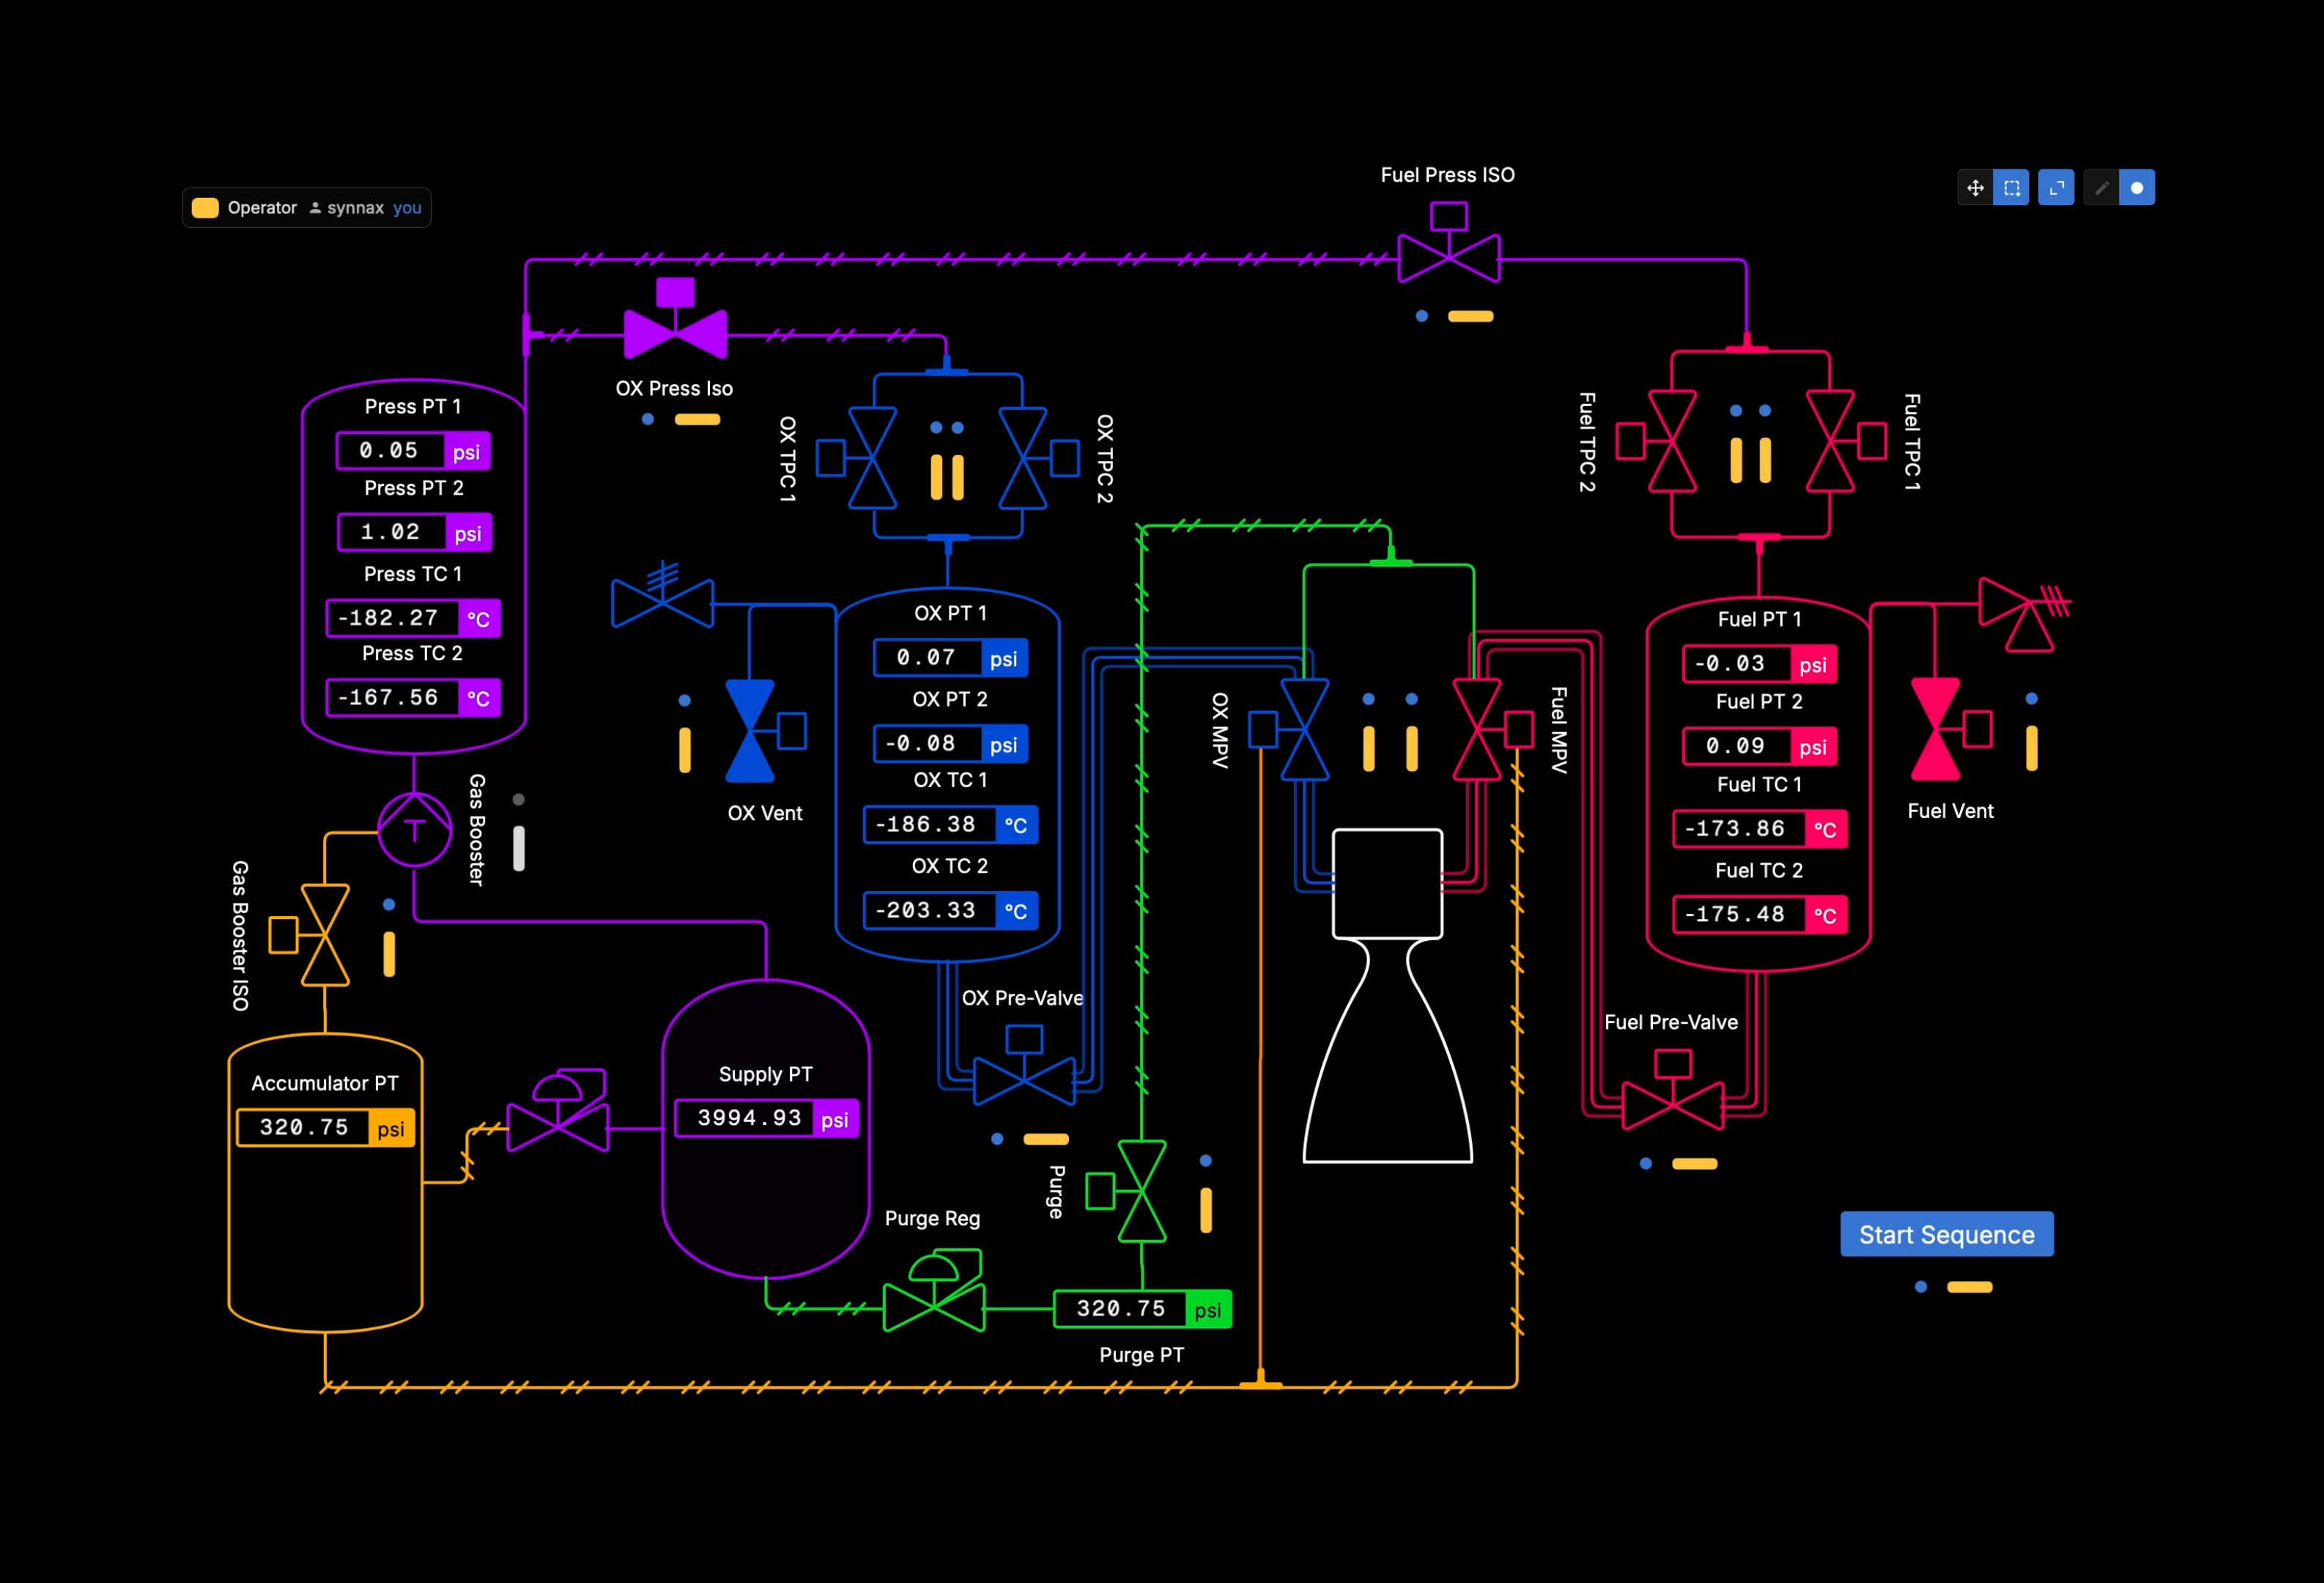
  • Logged work time, including work logs from Jira’s native time tracking and supported Tempo work log data.

Import from Confluence 

Your Confluence setup can be migrated to YouTrack’s Knowledge Base with the Confluence import wizard. You can transfer users and groups, spaces (projects in YouTrack), pages (articles in YouTrack), page labels (tags in YouTrack), comments, and attachments.

Confluence macros may require extra review after import, especially if your team uses them for dynamic content or custom page structures. You can prepare your content in advance or adjust the import script so that migrated articles better fit YouTrack Knowledge Base’s Markdown.

Jira Service Management import  

YouTrack Helpdesk can be an alternative to your Jira Service Management solution. YouTrack’s Jira Service Management import wizard offers a similar experience to the Jira import wizard, allowing you to migrate your tickets. Simply choose the necessary ITSM projects while setting up the import, and they will be migrated to YouTrack as helpdesk projects.

All your existing service projects and related tickets, with their content, history, custom fields, and ticket links, are automatically imported – along with agent, user, and reporter data. Later, you can finalize each helpdesk project setup by reconfiguring non-imported project entities, like channels and SLA policies.

Migrate your projects – one at a time or all at once

When using the import wizards, you can choose the project you want to import first, as well as whether to migrate the data to an existing YouTrack project or create a new one. We recommend beginning with a small import test. Import a pair of projects, one that is relatively basic and another that has more complexity. 

When you’ve assessed the results, you can decide on the full scope of your project import. After the initial import, you can use the continuous import to transfer any subsequent changes.

Step 3. Finish setting up YouTrack

Re-create entities that are not migrated automatically

After you’ve finished importing your data to YouTrack, you’ll see that some entities were not migrated with the import wizard. This is why we recommend estimating the scope of your migration before you start, so you can identify what may need to be adjusted or recreated manually in YouTrack.

Boards, reports, and dashboards

Filters, boards, dashboards, roadmaps, and reports are implemented differently in YouTrack and can’t be mapped one-to-one from Jira. You can recreate them manually and adapt them to the way your teams are used to working.

Automation and workflows

Jira automations can be recreated with YouTrack workflows, while Jira workflows can often be rebuilt with state-machine rules that define how tasks move between statuses.

If you use ScriptRunner or another script-based tool to automate complex business processes, you can recreate these automations as YouTrack workflows in JavaScript. For simpler use cases, the YouTrack Workflow Constructor provides a no-code, drag-and-drop interface with predefined conditions and actions.

Go deeper with YouTrack customization

Replace the Jira app ecosystem with YouTrack apps

If your team relies heavily on Atlassian Marketplace apps, formerly known as plugins, JetBrains Marketplace offers a growing selection of alternatives for YouTrack, most of which are available for free.

You can look for a matching YouTrack app on JetBrains Marketplace, build your own, or work with a consulting partner to recreate the functionality your team needs. Our partners specialize in creating high-quality apps for specific customer scenarios, helping ensure that your add-ons can be supported long term.

For teams that want to build apps in-house, YouTrack provides developer tooling for JavaScript and TypeScript that can fit into modern development workflows, including AI-powered ones. Here’s what YouTrack app creators say:

“Building apps for YouTrack requires detailed knowledge of the YouTrack API and architectural planning, plus general technical understanding, but not necessarily deep programming knowledge. As a vibe coder, I managed to do most of this myself with some support from developers, and many tasks can be handled with Cursor, Windsurf, Junie, or other coding agents.”

Julian Radünz Team Lead, Professional Services, MSP AG

Customize the YouTrack UI with apps

UI customization may also be part of your migration scope. With YouTrack apps, you can add custom widgets to issues, tickets, articles, and dashboards, or create new pages that are accessible from the main menu or project pages. For example, you can build a new page for your company intranet or add custom task buttons to support approval processes.

Set up user notifications

Notifications work differently in YouTrack. If your team currently uses Jira project-level subscription schemes managed by an admin, keep in mind that each YouTrack user manages a personal notification center. Include notification setup in your onboarding so everyone stays informed.

Configure your user authentication methods

The final setup step is to configure how users log in to YouTrack. This is usually a quick task for administrators, as YouTrack can connect to the identity systems your team already uses for Jira, Confluence, or other tools. YouTrack provides native authentication modules for OAuth 2.0, SAML, LDAP, OpenID, and other third-party authentication methods, plus two-factor authentication where needed.

Migration stories from YouTrack customers

Every migration is different, and real customer stories can make the process easier to evaluate. These stories show why teams chose YouTrack and how they approached the process, from a company building marketing automation for major retail brands to a smaller development team of 10.

From Jira and Confluence to the self-hosted YouTrack Server

MSP AG offers integrated marketing software solutions and IT operations for major European retail customers, including REWE and Hagebau. The team used Jira and Confluence for customer projects for 10 years, but they began looking for an alternative after Atlassian discontinued Jira Server. They selected YouTrack for its lower maintenance effort and on-premises deployment option.

They migrated to YouTrack Server in phases over several months using the Jira import wizard, filling any gaps through manual configuration and self-built apps. The team later replaced Confluence with YouTrack Knowledge Base, cleaning up page formats and migrating one space per day over a few months. Today, all departments, including development, project management, and both B2B and B2C support, work in a single YouTrack instance.

From Jira and Freshdesk to YouTrack for development and their helpdesk

Fullworks builds and supports WordPress plugins for events, security, and payments, and recently launched a new SaaS business, Broadcaster. Before YouTrack, the team used Jira for development management and Freshdesk for plugin support. With hundreds of thousands of reporters, including plugin users and premium customers, support requests often turned into development tasks, forcing work to move between separate tools. 

YouTrack gave Fullworks one place for issue tracking and external customer support with YouTrack Helpdesk, where they used the free plan for up to 10 users, 3 support agents, and unlimited reporters. The team also connected YouTrack to its AI-powered workflows through the remote MCP server, allowing Claude Code to create, update, and close tasks as part of their software development lifecycle.

Get support for complex migrations from YouTrack consulting partners

For larger organizations, migrating from the Atlassian stack often requires extensive planning. Certified YouTrack consulting partners have hands-on experience helping teams make the transition as smooth as possible. 

Our partner network covers different regions and industries, so we can connect you with a partner that fits your location and use case. They can prepare a proof of concept, create custom apps to replace Jira plugins, and help your team avoid common migration pitfalls.

Start with the twenty20 migration whitepaper

If your team uses Jira or Confluence and is considering a migration in the near future, you may want to start with a practical self-guided assessment. Our consulting partner twenty20 has prepared a whitepaper that covers common questions teams face during the switch to YouTrack. It gives an honest overview of what YouTrack can replace and includes a checklist for planning the necessary migration steps from the beginning.

The whitepaper is available in English and German on the twenty20 website. You can also contact them directly with questions about your migration.


If you have any other questions about migrating to YouTrack, please share them in the comments below or get in touch with our technical support. We’re always here to help!

show more
Toolbox App 3.7: JVM Memory Optimizations and Update Improvements
Feed: The JetBrains Blog (https://blog.jetbrains.com/feed/)
Published: 2026-08-18 14:32:34 | Created: 2026-08-18 15:56:54

Toolbox App 3.7 enables JVM memory optimization by default, improves the reliability of updates and session expiration recovery, and ensures compatibility with Windows Smart App Control.

Action required: Update Toolbox App on Windows

If you’re using an older version of the Toolbox App (3.4 or earlier) for Windows, update to v3.7 or later to keep signing in to your JetBrains Account. Earlier versions may be unable to store or refresh the credentials currently used by some JetBrains services.

Reliable IDE installation and updates on macOS 27

The Toolbox App now installs and updates IDEs reliably on macOS 27. 

JVM memory optimizations by default

With JVM memory optimizations now enabled by default, the Toolbox App helps the JVM use memory more efficiently in all operating systems. The new configuration tunes memory management, code-cache behavior, and garbage collection without requiring setup. See TBX-18852 for more details.

Fixed compatibility with Windows Smart App Control

The Toolbox App now launches correctly when Windows Smart App Control is enabled. See TBX-18777 for more details.

Patch update improvements on macOS 

Some JetBrains IDEs write runtime files inside their macOS app bundle. When you install a patch update, the Toolbox App now verifies the updated bundle’s code signature and removes files that are not sealed by the new build. If the bundle still fails verification, the Toolbox App downloads a clean copy. See TBX-18856 for more details.

Session expiration improvement

If you’ve experienced “session has expired” notifications, please try the Toolbox App 3.7 update. We’ve addressed one possible cause (temporary network interruption), and we’d appreciate a report if the problem persists for you.

We’d love to hear your thoughts on Toolbox App 3.7! Your feedback helps us improve, so please share your experience in the comments.

The JetBrains Toolbox App team

show more
AI Coding Agents: Adoption Trends
Feed: The JetBrains Blog (https://blog.jetbrains.com/feed/)
Published: 2026-08-18 15:03:13 | Created: 2026-08-18 15:56:54

Based on the Developer Ecosystem Survey 2026, the tenth edition of our large-scale, globally representative study run by the Strategic Research and Market Intelligence team.

This post picks up where our previous report on the adoption of the main AI coding tools left off in April 2026.

We recently ran the Developer Ecosystem Survey 2026 – a large-scale, globally representative survey of more than 15,000 professional developers worldwide, currently in its tenth year. This data provides a broad spectrum of insights into developers’ toolkits, practices, technologies, and attitudes.

We see AI coding agents actively carving out a place in developers’ toolkits, gaining traction and adoption across the industry. As of May–July 2026, 90% of professional developers were using AI coding agents at work at least weekly in one form or another (local agents or remote cloud agents), with 68% using them daily.

AI coding agents: Key adoption trends

Claude Code has continued to grow at an unprecedented pace, becoming by far the most widely adopted AI coding tool at work. It is used twice as often as GitHub Copilot, a former long-standing leader of the market that brought AI-assisted coding into the spotlight in 2023.

In May–July 2026, around 39% of professional developers worldwide were using Claude Code at work, up from 18% in January 2026. In the United States, its adoption is even higher at 47% – thus, almost half of US developers are using Claude Code at work. Moreover, it is becoming the main AI coding tool in developers’ AI toolkit at a much higher rate. Claude Code is the most used AI coding tool for 31% of developers, which signifies an almost 80% conversion rate (from regular usage at work to being the single most used tool).

Codex is rapidly catching up, showing adoption growth of roughly 5x, from just 3% in January 2026 to 16% in May–July 2026. However, the leap in product awareness might be even more impressive. In January 2026, only 27% of developers worldwide had heard about Codex despite the huge OpenAI brand behind it, while by May–July 2026 that number had risen to 65%.

GitHub Copilot has lost its leadership, experiencing a decline from 29% adoption a year ago to 21% in May–July 2026. However, it is still one of the most widely known tools on the market, with 79% mind share (awareness) among developers. This metric is even higher in Europe, the UK, and the US, sitting at 86%–90%. Also, according to the Developer Ecosystem Survey 2026, 39% of GitHub Copilot users use it, among other surfaces, in JetBrains IDEs.

Although Cursor has gained some mind share (from 69% in January to 75% in May–July), it has experienced a small decline in adoption, from 18% in January to 12% in May–July. The biggest drop in adoption occurred in China, where it was used by 28% developers in January and by only 16% in May–July 2026.

OpenCode – the open-source coding agent – has reached 7% adoption. Even more remarkably, it enjoys a 42% mindshare among developers worldwide without a big company name behind it.

Google Antigravity is stable in terms of adoption (6%) amid a significant leap in awareness: from 29% in January to 47% in May–July 2026. India is continuing to be Antigravity’s stronghold, where it is practically tied as the third most-popular AI coding tool, on par with Cursor: 15% of developers in India use Antigravity at work, up from 10% in January 2026.


JetBrains AI
As AI coding agents become a standard part of developers’ workflows, JetBrains AI are also seeing adoption, with around 9% of developers worldwide using JetBrains AI in IDEs and/or Junie at work.

Moreover, Claude Agent, Codex, GitHub Copilot, and OpenCode are integrated directly into the AI chat of JetBrains IDEs, and dozens of other agents, including Cursor, can be added via the Agent Client Protocol (ACP). You can even use Codex via your OpenAI API key or ChatGPT subscription.

JetBrains is also expanding its agentic ecosystem. Air an agentic development environment currently in preview – lets developers combine multiple coding agents in one coherent workflow, while JetBrains Central provides a unified control and execution plane for managing agent-driven development across tools and environments.

You can learn more about JetBrains’ AI offerings for teams and organizations here.

We’re curious to see how the adoption of agentic software development evolves further, and we plan to share more of our findings on agentic development practices from the Developer Ecosystem Survey 2026 with the community soon. Stay tuned!

Methodology notes

In this report, “professional developers” refers to respondents who reported being involved in coding or programming in any of the following job roles:

  • Developer / Programmer / Software Engineer
  • AI / ML Engineer
  • DevOps Engineer / Infrastructure Developer
  • Architect
  • Data Scientist / Engineer / Analyst
  • QA Engineer

Roughly 90% of the sample falls into the Developer / Programmer / Software Engineer job category.

The Developer Ecosystem and AI Pulse surveys are localized into eight languages: English, Spanish, Chinese, Japanese, Korean, German, French, and Portuguese. We apply quotas on the required number of responses by region to help achieve accurate global representation. The quotas are proportionate to the number of developers in each region, based on estimates by our Data Science team. The detailed methodology of these estimates is described here.

The Developer Ecosystem Survey has been statistically reweighted to better represent the global developer population by region, employment status, programming language, and familiarity with JetBrains products. You can read about the weighting methodology for the Developer Ecosystem Survey here and for the AI Pulse survey here.

show more
Qodana Expands Security Analysis with OpenGrep Rules, and More
Feed: The JetBrains Blog (https://blog.jetbrains.com/feed/)
Published: 2026-08-18 10:32:06 | Created: 2026-08-18 11:56:54

Modern software development teams face a difficult balancing act. Applications are growing more complex, release cycles are accelerating, and security expectations continue to rise.  This is especially true in a time where much more code is generated daily, which needs to be checked. Teams need tools that can identify vulnerabilities early without creating additional friction for developers or overwhelming security teams with noise.

Now, we bring you expanded security analysis capabilities in Qodana through the integration of OpenGrep-powered inspections for .NET and JavaScript projects.

This enhancement combines Qodana’s existing code quality, vulnerability detection, dependency analysis, and taint analysis capabilities with hundreds of additional security-focused inspections, helping teams identify more risks before they reach production. Plus, it’s also possible to use own or third-party Opengrep rules as a result of this change.

More security coverage, one workflow

Security teams often find themselves managing multiple tools across the software development lifecycle.

One tool checks code quality. Another scans dependencies. A third performs security analysis. Each produces its own reports, workflows, and operational overhead.

With Opengrep-powered inspections integrated directly into Qodana, teams can consolidate more of their security and quality analysis into a single platform.

Developers continue working within the tools they already use while benefiting from expanded security coverage that includes:

  • Injection vulnerabilities, including SQL, command, and code injection
  • Cross-site scripting (XSS) and path traversal
  • Server-side request forgery (SSRF)
  • Selected deserialization and resource-allocation issues
  • Insecure coding patterns covered by Qodana’s ruleset
  • Unsafe data flows associated with supported vulnerabilities
  • Custom security checks for internal APIs, frameworks, and policies

The result is broader visibility without introducing another disconnected security solution.

Combining OpenGrep with Qodana’s existing security intelligence

This release is more than simply adding new rules. Qodana already provides static code analysis, vulnerability checking, dependency inspection, license auditing, quality gates, and advanced taint analysis capabilities.

The addition of Opengrep inspections extends this foundation, creating a more comprehensive approach to identifying security issues across the software development lifecycle.

By combining multiple analysis techniques, teams gain deeper visibility into potential risks while maintaining a consistent developer experience.

Built on trusted static analysis 

As AI continues to reshape software development, security teams increasingly need confidence in the tools they rely on.

The new Opengrep-powered capabilities are based on proven static analysis techniques designed to identify security vulnerabilities directly within source code.

Rather than relying on probabilistic outputs, these inspections use deterministic analysis to help teams identify issues early and consistently.

For organizations seeking predictable, repeatable security scanning, static analysis remains one of the most effective ways to shift security left and reduce risk before deployment.

Transparency and proof matter

Security tooling should not be a black box.

As part of this initiative, we are investing in transparent benchmarking to help teams understand how security analysis solutions perform.

Our goal is simple: provide customers with clear, measurable insight into detection capabilities, true positive rates, and false positive rates so they can make informed decisions about their application security strategy.

Security teams deserve visibility into how their tools perform, not just marketing claims.

Security that fits developer workflows

The best security tools are the ones developers actually use and at JetBrains, we’ve always prioritised developer experience

Because OpenGrep-powered inspections are integrated into Qodana, findings appear alongside existing code quality and security results within established development workflows.

Developers receive actionable feedback in their IDEs, pull requests, and CI/CD pipelines, allowing issues to be addressed earlier and more efficiently.

Organizations can continue enforcing standards through automated quality gates while gaining broader security coverage across their applications.

Looking ahead

Software security is becoming increasingly important as organizations manage growing codebases, expanding software supply chains, and AI-assisted development workflows.

By combining Qodana’s existing analysis capabilities with hundreds of additional Opengrep-powered inspections, we’re helping teams build a stronger foundation for secure software development.

This release represents another step toward our goal of giving engineering and security teams the visibility, confidence, and control they need to deliver high-quality, secure software at scale.

Stay tuned for more rules/inspections, OWASP/CWE coverage with expanded coverage, as we continue investing in security analysis across the Qodana platform.

Get Qodana 2026.2

Benchmarking Qodana’s security inspections against others

We’re making it easier to evaluate the performance of these inspections with SABER – a Static Analysis Benchmark Evolution Runner. Find out more about SABER benchmarking here.

Qodana security inspections

Frequently asked questions

What is OpenGrep?

OpenGrep is an open-source static analysis engine designed to identify security vulnerabilities, insecure coding patterns, and framework-specific issues using a large library of community-maintained rules. It scans source code for known patterns associated with security risks and helps developers catch issues before software reaches production.

How does Qodana use OpenGrep?

Qodana integrates OpenGrep-powered security inspections directly into its existing code quality workflow. Rather than introducing another standalone security tool, OpenGrep findings appear alongside Qodana’s existing inspections, quality gates, and reports, allowing developers to review security and code quality issues in one place. It’s also combined with Qodana’s Taint Analysis which provides a strong alternative to other options.

Which programming languages are supported?

Qodana currently includes OpenGrep-powered security inspections for .NET and JavaScript projects – with planned future support for Kotlin and Java. These inspections complement Qodana’s existing language-specific static analysis and security capabilities.

Does OpenGrep replace Qodana’s existing inspections?

No. OpenGrep expands Qodana’s security coverage rather than replacing existing inspections. Qodana continues to provide JetBrains’ static analysis, quality gates, code coverage, vulnerability detection, dependency analysis, licence auditing, and other code quality features alongside OpenGrep-powered security checks.

What types of security issues can OpenGrep detect?

The additional inspection set includes checks for common security weaknesses such as:

  • Injection vulnerabilities, including SQL, command, and code injection
  • Cross-site scripting (XSS) and path traversal
  • Server-side request forgery (SSRF)
  • Insecure coding patterns covered by Qodana’s ruleset
  • Unsafe data flows associated with supported vulnerabilities
  • Custom security checks for internal APIs, frameworks, and policies

The exact findings depend on the language, framework, and enabled rules.

Where are the results displayed?

Security findings appear within the same Qodana workflows developers already use. Results can be viewed in supported IDEs, during CI/CD analysis, and in Qodana reports, allowing teams to investigate and remediate issues without switching tools.

Is OpenGrep suitable for CI/CD pipelines?

Yes. OpenGrep-powered inspections are designed to run as part of automated development workflows, helping teams identify potential security issues early in the software development lifecycle and enforce quality gates before code is merged or deployed.

Why combine static analysis with OpenGrep?

Modern software quality extends beyond style and correctness. As applications become more complex and AI-generated code becomes more common, teams increasingly need both traditional static analysis and security-focused pattern matching. Combining these capabilities provides broader coverage while keeping the developer experience consistent.

Is OpenGrep included with Qodana?

Yes. For supported languages, Qodana includes an OpenGrep binary built from JetBrains’ fork of OpenGrep and uses it to run additional security inspections. Available features depend on your Qodana edition and the language being analysed.

Get Qodana 2026.2

show more
Klibs.io Grows to 4,200+ KMP Projects With Smarter Discovery and New AI Integrations
Feed: The JetBrains Blog (https://blog.jetbrains.com/feed/)
Published: 2026-08-17 13:12:57 | Created: 2026-08-17 13:49:54

Explore a growing Kotlin Multiplatform catalog in your browser, or bring up-to-date library data directly into your AI development workflow through the klibs.io MCP server.

When we introduced klibs.io in December 2024, the goal was simple: make it easier to find a Kotlin Multiplatform library that fits both your use case and target platforms. Since then, klibs.io has grown into a catalog of more than 4,200 KMP projects – and discovering new libraries has become even easier.

Discover more than 4,200+ KMP projects

klibs.io combines information from GitHub and Maven Central, bringing the details needed to evaluate a project into a single catalog. When source metadata is incomplete, klibs.io uses LLMs to refine descriptions and tags, improving search and discoverability.

Discovery now goes well beyond a basic keyword search. Use multiple search terms, filter by supported platforms and targets – including Android, iOS, JVM, JavaScript, and Wasm – and browse curated categories such as Compose UI, local storage, networking, or dependency injection. Results can be sorted by relevance, GitHub stars, or dependent count.

Project pages make comparison easier by bringing together descriptions, tags, README content, supported platforms, package versions, dependent counts, license information, and project activity. 

This gives you a clearer view of whether a library fits your project before you add the dependency.

Bring klibs.io into your AI workflow

Library decisions often happen while you are already coding. The new AI integrations allow coding agents to pull structured, up-to-date data from klibs.io rather than relying solely on training data or a general web search.

Connect through the klibs.io MCP server

The klibs.io MCP server lets agents search Kotlin Multiplatform projects by platform and target and retrieve the latest published package versions directly from the klibs.io index.

Give agents reusable KMP library expertise

The Kotlin Multiplatform Libraries expert skill provides task-specific instructions for discovering and comparing libraries, recommending options for a use case, verifying platform support, and finding up-to-date dependency coordinates and stable versions. We measured agent output with and without klibs.io connected – the evaluation results are published in the klibs.io repository.

Keep project guidance close to the code

The AI integration guide includes setup instructions and a recommended AGENTS.md snippet. Adding guidance to a project helps AI tools consistently use verified information from the KMP library.

Help shape what comes next

klibs.io is an open-source project, and feedback from library users and authors helps the catalog keep improving. Here are a few ways to take part:

•  Try it out: Search for a library, explore a category, and see how the filters work for your target platforms.

•  Improve project information: Project owners can use the Suggest an edit option on project pages to propose better descriptions and tags through GitHub.

•  Report issues or contribute: Report bugs, missing libraries, or incorrect metadata in the GitHub issue tracker, or contribute directly to the open-source project.

•  Join the discussion: Share feedback in the #klibs-io channel on Kotlin Slack.

Whether you browse the catalog directly or integrate it with your AI tools, klibs.io now makes it easier to discover, compare, and use Kotlin Multiplatform libraries with up-to-date information.

show more
What Your First Months at JetBrains Look Like?
Feed: The JetBrains Blog (https://blog.jetbrains.com/feed/)
Published: 2026-08-17 13:17:50 | Created: 2026-08-17 13:49:54

Starting a new job is exciting, and there’s a lot to take in. At JetBrains, onboarding doesn’t stop after your first day. It starts when you accept your offer and continues through your first months, giving you the information, tools, and support you need to settle in and start doing your best work.

Here’s what you can expect.

Before your first day

Once you’ve accepted your offer, you’ll receive a welcome email with practical information and a preboarding map. It includes everything you’ll need before your first day:

  • A secure link to sign your employment contract.
  • The details of your local HR contact (your go-to person throughout preboarding).
  • A guide to setting up your profile in our internal HR system.
  • Some practical tips for your first day.
  • A preview of what your first day at JetBrains will look like.

Your first day at JetBrains

Whether you’re joining us on site or remotely, your first day is all about getting set up.

You’ll meet your manager, local HR, and teammates, and receive your laptop and any other equipment you’ll need.

You’ll also get:

  • An onboarding map outlining your first weeks and key milestones.
  • Access to a dedicated landing page with everything you’ll need to get started.
  • A tour of the office or a virtual workspace walkthrough.
  • Your welcome pack.
  • An introduction to the tools and systems you’ll use.
  • A one-on-one session with HR to cover practical topics like payroll, benefits, and time off.

By the end of the day, you’ll know where to find information, who to ask for help, and what comes next.

Your first weeks

The first few weeks are about getting to know your team and how things work.

You’ll learn how your team collaborates, get familiar with your tools and workflows, and start building relationships with the people around you.

You’ll also meet two people who’ll make your onboarding as smooth as possible:

  • Your Team Partner, who helps coordinate your onboarding within the team.
  • Your Buddy, another fellow JetBrainer who’s there for all the questions that don’t belong in documentation, from “How do we usually do this?” to “Where’s the best coffee?”

We’ll also check in with a short onboarding survey to see how things are going and learn how we can improve the experience for future JetBrainers.

Meet your onboarding buddy

One of the things people appreciate most is the Buddy Program.

Your buddy isn’t there to train you; they’re there to help you navigate everyday life at JetBrains. Whether it’s understanding how something works, finding information, or simply having someone outside your immediate team to ask questions, your buddy helps make the first few weeks feel a little more familiar.

Your first few months

As you settle in, onboarding becomes less about logistics and more about learning.

During your first months with us, you’ll receive onboarding content and tasks gradually rather than all at once, so you can explore topics as and when they’re most relevant. Depending on your role, you’ll also have team-specific onboarding, opportunities to meet other new joiners, and JetDive sessions where you’ll learn more about the company, our products, and the people behind them.

Throughout this time, we’ll continue collecting feedback from you, your manager, and your teammates to make sure you’re getting what you need.

Your probation period

During your probation period, you and your manager will agree on what success looks like in your role: which responsibilities to focus on first, what skills you’re expected to build, and how your work will be evaluated. You’ll have regular 1:1s and check-ins to talk about what’s going well, where you might be stuck, and what support or resources you need – from clearer priorities to training or introductions to key people.

It’s also your opportunity to be open about your own experience: how the role matches your expectations, whether the workload feels sustainable, and what you need to feel confident and productive. 

By the end of the probation period, there shouldn’t be any surprises. Both you and your team lead should have reached a mutual understanding that this is the right place and role for you (or, if not, that conclusion will have been reached together and talked through in advance).

Welcome to JetBrains

By the end of your onboarding, it’s our hope that JetBrains will feel familiar to you. You should know your team, understand how we work, know where to find answers, and be able to focus on solving interesting problems instead of figuring out where things are.

Ready to Join JetBrains?

Hopefully, this gives you a better idea of what it’s really like to join JetBrains. If you’re looking for a place where you can do meaningful work, learn from smart people, and feel supported from day one, we’d love to hear from you. Check out our careers page for open roles. 

show more
Junie’s New Default Runs on Gemini 3.7 Flash, at 40% Off Base Pricing
Feed: The JetBrains Blog (https://blog.jetbrains.com/feed/)
Published: 2026-08-17 10:04:21 | Created: 2026-08-17 11:49:54

Google’s most capable Flash model for coding, with a limited time discount.

Most of the coding you do in a day doesn’t need a flagship model. It needs a good one that won’t have drained your budget by lunchtime. That’s the thinking behind Junie’s new default, Gemini 3.7 Flash. It’s live now in both the IDE plugin and Junie CLI, and for a limited time it runs at 40% off base pricing.

A better default, not just a cheaper one

Gemini 3.7 Flash is Google’s most capable Flash model yet for coding and agents, and it’s a clear step up from the 3.6 Flash it replaces. In Google’s own testing*, it resolves far more long-horizon software-engineering tasks (DeepSWE v1.1: 65.3% vs 49.0%) and writes more production-ready code (FrontierCode 1.1: 43.6% vs 34.4%), with higher first-pass accuracy and fewer retries. On everyday coding work that means less manual oversight, not a downgrade you accept to save money.

We evaluate every model on JetBrains’ own private test set before it goes anywhere near Junie. On a private benchmark built from real, recent commits in our own projects that no model has been trained on, Gemini 3.7 Flash matched the solve rate of our premium Sonnet-5 midtier model, at roughly a third of the cost per task. 

So this is a better default and a cheaper way to do premium-class work, not a downgrade you accept just to save money.

40% OFF to start

For a limited time, Gemini 3.7 Flash runs at 40% off base pricing in Junie. It’s already the default, so there’s nothing to set up. Open the IDE plugin or Junie CLI, run a real task, and see how much you might save.

show more
Exploring Compose HTML for Server Side Rendering
Feed: The JetBrains Blog (https://blog.jetbrains.com/feed/)
Published: 2026-08-14 12:15:09 | Created: 2026-08-14 13:45:54

Something is happening in server-rendered web development. React shipped Server Components. HTMX made “hypermedia” cool again. Phoenix LiveView proved a server can push interactive UI updates without a client framework in sight. Every ecosystem seems to be rediscovering the server as a place to render UI, except one: the JVM. What if Compose, the UI toolkit already spanning Android, Desktop, and iOS, took a shot at server-rendering HTML too?

The vision is simple: give backend developers a way to build server-rendered UI as type-safe, reusable Compose components (real Kotlin, with autocomplete, refactoring, and compiler checks) instead of string-based templates. No separate templating language, no separate UI codebase to maintain alongside the backend. This blog serves to explore some ideas how to achieve this vision and represents an exploration instead of an official commitment.

Every major JS framework now has an SSR story: React has Next, Vue has Nuxt, Svelte has SvelteKit. And it’s not only the JS ecosystem. C#, Rust and even functional languages like Elixir have innovative solutions to build fullstack apps without relying on templating engines. Instead, they bundle state and rendering into reusable components, directly in code, the same way Compose already does everywhere else.

Right now the JVM doesn’t have a horse in this race. There’s no shortage of SSR libraries on the JVM. But most of them need some sort of templating language and have nothing close enough to a component for a JS dev to recognize as such.

But there is already a framework that is battle-tested and capable of filling this gap for the JVM, it just never really targeted the server. Compose Multiplatform allows us to write business logic and User Interfaces once and share it between platforms: Android, iOS, Desktop, and the web. It just needs to make the jump to the server next.

Compose Multiplatform already targets the web, but not the way you’d want for this: it renders directly into a canvas, which shares UI code between mobile platforms and the browser at the cost of SEO, loading times, and accessibility.

A way to render HTML with Compose already exists, and it’s older than Compose for Web: Compose HTML, which uses the Compose runtime to build SPAs in Kotlin and compile it to JS using the Kotlin/JS compiler. Add a JVM target and it could do SSR too. The rendering happens directly in Kotlin: real components, real types, no templating language.

JVM devs stuck with Thymeleaf/JSP, or reaching for a separate JS framework just to build fullstack applications, wouldn’t have to leave the platform: type-safe, reusable Compose components replace what the templating language used to handle. Kotlin’s Java interoperability means it would slot into large legacy Java applications too.

Take something as basic as a reusable card component. In Thymeleaf, that’s a fragment defined in its own file, called by name, with parameters passed as untyped strings:

<!-- fragments/card.html -->
<div th:fragment="card(title, count)" class="card">
	<h3 th:text="${title}">Title</h3>
	<span th:text="${count}">0</span>
</div>
<!-- usage -->
<div th:replace="~{fragments/card :: card(title='Cart', count=${cartCount})}"></div>
<div th:replace="~{fragments/card :: card(title='Wishlist', count=${wishlistCount})}"></div>

Rename count to itemCount and every call site keeps compiling until it breaks at runtime. The compiler has no idea card or its parameters even exist.

The same component in Compose is a typed function:

@Composable
fun Card(title: String, count: Int) {
	Div({ classes("card") }) {
		H3 { Text(title) }
		Span { Text(count.toString()) }
	}
}
// usage
Card(title = "Cart", count = cartCount)
Card(title = "Wishlist", count = wishlistCount)

Rename count here and every call site either updates with the IDE or fails to compile. Pass a String where an Int is expected, and it’s a compiler error, not a runtime surprise.

Today Compose HTML only has a JS target, so it can only be used from the browser; there’s no way of doing SSR yet. That doesn’t mean the Kotlin web-dev ecosystem is standing still, though.

There is Kobweb, a batteries-included framework built on top of Compose HTML. It doesn’t offer SSR but supports static site export/prerendering to help with SEO. There is also Kilua, which doesn’t build on top of Compose HTML but on top of the Compose Runtime directly to do SSR and CSR, leveraging JS or Wasm, and offers integrations for Ktor, Spring Boot, and others. And there is Summon, with SSR and hydration support.

There’s already a small but active community leveraging Compose to build for the web. Adding SSR capabilities to Compose HTML would give Kobweb, Kilua, and Summon a shared foundation instead of three separate approaches, and give frameworks like Spring Boot and Ktor a good reason to integrate with it on the server.

This space isn’t totally unexplored, but everything from this point onward is pure exploration.

What Compose HTML on the server could look like

The first step would be to add a JVM target to Compose HTML, which is a bit easier said than done. There would need to be renderToString and renderToBytes functions that run a composition once on the JVM and serialize the resulting tree into a string.

fun renderToString(content: @Composable DOMScope<DomElement>.() -> Unit): String

val html: String = renderToString {
    Div({ classes("card") }) {
        Text("Hello")
        Span({ classes("title") }) {
            Text("World")
        }
    }
}
// html == """<div class="card">Hello<span class="title">World</span></div>"""

It composes once, lets the initial composition settle, walks the resulting tree, and serializes it straight to an HTML string: no browser, no DOM.

There are some limitations to this. There would probably be only a single render pass, meaning no recomposition on state change or any effects, in essence very similar to SSR in JS. Event listeners should be accepted but will be inert; there’s no point in binding to browser events on the server.

This would probably already be enough to build basic, entirely server-rendered pages using Compose. Here’s a full todo app on Spring Boot:

@Controller
class TodoController(private val todoService: TodoService) {

    @GetMapping("/todos")
    @ResponseBody
    fun todoView(): String = renderToString {
        TodoView(todoService)
    }

    @PostMapping("/todos")
    fun addTodo(createTodoDto: CreateTodoDto): String {
        todoService.addTodo(createTodoDto.title)
        return "redirect:/todos"
    }

    @PostMapping("/complete/{id}")
    fun completeTodo(@PathVariable id: Long): String {
        todoService.completeTodo(id)
        return "redirect:/todos"
    }
}

data class CreateTodoDto(val title: String)

@Composable
fun TodoView(todoService: TodoService) {
    AddTodo()
    TodoList(todoService)
}

@Composable
fun AddTodo() {
    Form(
        attrs = {
            action("/todos")
            method(FormMethod.Post)
        }
    ) {
        TextInput(
            attrs = {
                placeholder("Add todo")
                name(CreateTodoDto::title.name)
            }
        )
        Button(
            attrs = {
                type(ButtonType.Submit)
            }
        ) {
            Text("Add")
        }
    }
}

@Composable
fun TodoList(todoService: TodoService) {
    val todos by produceState(initialValue = emptyList<Todo>(), todoService) {
        value = todoService.getTodos()
    }
    Ul {
        todos.forEach { todo ->
            Li {
                Form(
                    attrs = {
                        action("/complete/${todo.id}")
                        method(FormMethod.Post)
                    }
                ) {
                    Text(todo.title)
                    Button(
                        attrs = {
                            type(ButtonType.Submit)
                        }
                    ) {
                        Text("Complete")
                    }
                }
            }
        }
    }
}

Every interaction here is a real HTTP form submission and full-page redirect: no client JS at all, same as classic Thymeleaf-style SSR, just written entirely in Compose.

At that point, frameworks like Spring and Ktor could start experimenting with integrations and identifying missing integration points. This would also be the first sensible point at which new libraries (e.g. components) could be created.

Going entirely off the rails into pure speculation, this is what such an integration could look like for Spring:

@ComposePage("/todos")
@Composable
fun TodosPage(todoService: TodoService) {
    AddTodo()
    TodoList(todoService)
}

@ComposeAction("/todos", method = PostMapping::class)
fun addTodo(
    @RequestBody createTodoDto: CreateTodoDto,
    todoService: TodoService
) {
    todoService.addTodo(createTodoDto.title)
}

The idea: a hypothetical Spring integration could turn a @Composable function directly into a routed page, no manual renderToString call, no controller boilerplate, no wrapping HTML shell. Spring would own request mapping and dependency injection exactly like it does today; Compose HTML would just be the render target instead of a View/template.

Or for Ktor:

routing {
    composable("/todos") {
        TodoView(todoService)
    }

    post("/todos") {
        val params = call.receiveParameters()
        todoService.addTodo(params["title"]!!)
        call.respondRedirect("/todos")
    }
}

composable(path) { } would be a thin wrapper Ktor could add: call renderToString internally and respond with the HTML content type, so a route body becomes a @Composable lambda instead of a string template or manual call.respondText.

Worth repeating: these are illustrative sketches, not planned APIs, not a roadmap.

Hydration and state sync are the natural next question, not an answer: how would a composable that already rendered on the server pick up interactivity in the browser, and would client and server ever need to agree on state? Answering that would also open the door to sharing UI code between client and server, the same component compiled once for the browser and once for the server, and enable interactive fullstack web apps built entirely in Kotlin.

Let’s be clear about scope: the goal is not to expand Compose HTML into a fully-fledged, batteries-included framework. Rather, the vision is similar to React’s: stay small and let frameworks build the integration points on top, just applied to a multiplatform library instead of a single-platform one. Framework integrations and ecosystem libraries live outside the core. That’s a real contrast to the rest of Compose Multiplatform, which ships official libraries for Material3 components, state management, and many other things. Compose HTML will need to rely on the Kotlin community and ecosystem to figure out what integration points are actually needed and how its future will look, instead of dictating a direction from the inside.

We are already talking to framework maintainers from Kobweb, Kilua, and Summon to gather their perspective, as well as the Spring team, which has expressed interest in experimenting once a JVM target is added to Compose HTML.

If you want to talk shop, argue with any of this, or just see where it goes, join the Kotlinlang Slack (get your invite here: https://kotl.in/slack) and the #compose-ssr channel.

Every other ecosystem already took its shot at the server. Kotlin’s turn is overdue.

show more
Hybrid and Local AI course at DeepLearning.AI
Feed: The JetBrains Blog (https://blog.jetbrains.com/feed/)
Published: 2026-08-13 10:01:32 | Created: 2026-08-13 11:43:54

Open weight models are having a moment, driven by control, choice, and cost. Hybrid and local AI are now getting serious looks, so JetBrains teamed up with DeepLearning.AI on a free AI Coding Workflows: Hybrid to Local course that covers the ideas and options.

The course is now available and uses PyCharm and its AI Chat. Here’s a peek into the course.

Claude Code: Subagents and cheaper models

We start the course with, well, not-local. Instead, we use what you already know – Claude Code and its Anthropic models – to introduce some of the techniques and “levers” that help bring choice, control, and even cost reduction. (Yes, I wrote emdashes.)

We did a previous course on Spec-Driven Development (SDD) so of course, we wanted to start there. Smaller models struggle with big, open-ended “vibe coding.” Dividing and bounding the work keeps smaller models on track. Important note: this course’s example app is really basic. You might say “that’s too easy.” But that’s part of the takeaway: big brain models can do the upfront work, forming right-sized steps for smaller models.

We then illustrate this division with a Claude Code subagent. The main chat prompt implements each roadmap phase in a fresh subagent, to better manage context. This then gives the payoff: a cheaper model for the implementer. Use a “big brain” (Opus) for main conversation thinking and a “little brain” (Haiku) for implementation.

Each lesson finishes with metrics about the change in tokens, turns, cost, and estimated wall time. Which brings us to the main course goal: learning the ideas instead of the specifics, which change weekly.

New agent, inference, and model

That covers the four levers:

  • Specs shaped for the model size
  • Specialist subagents to divide work
  • Cheaper models for the routine work
  • Collect metrics as evidence to guide thinking


The course then introduces choice and control:

  • New agent: OpenCode
  • New inference router: OpenRouter
  • New model and inference host: DeepSeek (via OpenRouter) by moving to a new agent (OpenCode) using inference routing (OpenRouter) to inference hosting and models (DeepSeek)


We first move to OpenCode, running in PyCharm. JetBrains wants our IDEs to be open platforms for agents and models. This makes the move from Claude Code to OpenCode straightforward: it’s the same UI. We add OpenRouter (a paid step), connect it to OpenCode, and choose DeepSeek as a model.

Next we repeat our sequence: all in one chat, then context isolation using a subagent. But this time, with a different agent and model.

We finish by making a dedicated implementer subagent in Markdown. This gives quite a number of levers of control: in the frontmatter for mandatory controls, and in the subagent body for “persuasion” guidance. Most importantly, we have the implementer use the smaller DeepSeek v4 Flash model as the “little brain.”

Compared to the Claude Code version, the metrics were, unsurprisingly, a lot cheaper.

Hybrid and Local

Now for the main attraction: for routine development, can we do some – or even all – of the work locally?

We start with a lesson on setting up local AI: LM Studio as the inference server and Gemma 4 12B as the local model, targeting a 32 GB laptop.

We then configure the implementer subagent to use this local Gemma 4 model, promoting DeepSeek v4 Flash from last lesson’s “little brain” up to “big brain.” The results? Quite good, as it turns out.

Then the big test: fully local, with Qwen 3.5 27B as the “big brain.” The results: better than expected, showing that guardrails help.

How did hybrid and local do? Both of these lessons finish with a review of the metrics. That’s one of the big course takeaways: look at the evidence. You can see how small models struggle, and see the effect of helping them succeed.

Hybrid and Local AI Are Heating Up

Much thanks to DeepLearning.AI both for working with us again and for pushing to get this out fast. This topic is now red-hot in the news: Sovereign AI, privacy and security, and of course cost. The innovations are coming really fast and it is important to have a gentle introduction to the fundamentals.

We’ll do more updates here on Local AI for control, choice, and cost. Most of all, we at PyCharm believe in the human-in-the-loop. Stay tuned for more on this.

show more
Qodana Lints Your Code. What’s Checking Your DevOps and Platform Engineering Stack?
Feed: The JetBrains Blog (https://blog.jetbrains.com/feed/)
Published: 2026-08-13 06:35:26 | Created: 2026-08-13 07:43:54
Qodana for DevOps.

A developer in DevOps pushes a Kubernetes deployment with no resource limits, a pod running as root explicitly, and a GitHub Actions workflow runs with mutable tags – and it goes straight to production, unnoticed. No quality gate. No IDE warning. No CI failure. An innocuous change, silently shipped, but with high consequences.

Qodana lints your application code. It catches unused variables, security vulnerabilities, code style violations, and architectural issues before they reach production. Quality gates drive the build. The IDE flags problems inline. Developers get fast feedback on every commit.

Andre Petrov Qodana for DevOps

Andrei Petrov, DevOps and Platform Engineer

Who’s checking your DevOps and platform engineering stack?

Most DevOps/platform engineering teams rely on a collection of disconnected CLI tools to analyse infrastructure:

  • Kube-score: Kubernetes manifest analysis;
  • Checkov: Terraform and CloudFormation;
  • Hadolint: Dockerfile linting;
  • Ansible-lint: Ansible playbooks and roles;
  • Tfsec/Tflint: Terraform security and best practices;
  • Trivy: container image and IaC scanning;
  • Conftest: policy-as-code with OPA;
  • Yamllint: generic YAML validation;
  • Actionlint: GitHub Actions workflow linting.

Each has its own configuration syntax, its own severity model, its own CI integration, and its own maintenance story. There is no shared quality gate. There is no IDE feedback loop. And there is no cross-domain analysis – a Terraform module that provisions a public S3 bucket and the Helm chart that references it cannot be evaluated together.

The result: infrastructure code gets merged with a fraction of the scrutiny applied to application code. Security misconfigurations, reliability gaps, and operational risks ship quietly.

What if Qodana extended to DevOps artifacts?

Here is what findings could look like across the five domains that matter most:

The analysis could be extensible: community-built adapters for tools like Pulumi, CDK, or GitLab CI could plug in directly via qodana.yaml.

Look and feel

A Qodana DevOps Linter would surface findings in the same user interface teams already use for application code – same report structure, same severity model, same quality gate.

Using Qodana fits the DevOps philosophy because it would close the loop between who writes software and who runs it in production.

The overview report would give an immediate picture of the infrastructure quality posture – total problems, inspections run, and a breakdown by severity and category across all five domains.

Why this matters beyond the linter itself

The deeper value isn’t catching individual misconfigurations. It’s establishing a shared quality standard for infrastructure code, the same way Qodana established one for application code.

That means:

  • The same developer experience: IDE feedback, CI enforcement, quality gates;
  • The same configuration model: one qodana.yaml covers both application code and DevOps artifacts;
  • Cross-domain analysis: rules that span a Terraform module and the Helm
    chart it backs;
  • A shift-left posture for the entire stack: not just the application layer.

Is this a problem you recognize?

This is still an idea in early exploration. We are looking forward to learning if other practitioners see the same gap.

Does this match a pain point in your team? Is there a domain or tool you would want analysed first? Get in touch and let’s discuss your thoughts.

show more
When Escape Routes Become Toll Roads: Mapping How Developers Move Between Programming Languages
Feed: The JetBrains Blog (https://blog.jetbrains.com/feed/)
Published: 2026-08-12 16:15:18 | Created: 2026-08-12 17:42:54

TL;DR: This post relates findings about language migration from the 2025 State of Developer Ecosystem survey. In general, project requirements are still the most common reasons for switching languages. One outlier from this trend, however, is Kotlin. People switch to Kotlin not because they have to; they switch because it simply feels better to work with, thanks to its better development experience and more modern features. C has a surprisingly high churn rate, and Java developers tend to move to Python and TypeScript. HTML/CSS developers learn JavaScript to improve their job opportunities, while JavaScript developers switch to almost everything else for the same reason.

The history of programming is, in part, a history of escape


Ada Lovelace wrote for a machine that did not yet exist in working form. A century later, programmers were wrestling with machines that had switches, punched cards, and raw numeric instructions. Then came assembly, and with it the first great bargain of software: give up a little closeness to the machine, and gain a little room for the human mind. But history does not stand still. With new languages and shifts in context, aspects of existing languages began to get in the way.

One language moved to such a high level of abstraction that its efficiency in the physical reality of the machine stopped holding up. Meanwhile, the fast-growing Internet of Things meant that programs now had to run on a coffee machine in a sense that was no longer metaphorical. In some places, development speed was missing. In others, safety was.

We escaped from assembly into C, from C into managed runtimes, from ceremonial enterprise Java into Kotlin, from dynamic-language freedom into TypeScript, from unsafe systems code into Rust, and from heavy frameworks into smaller cloud-native tools. At first glance, all migration channels seem clear. But how does this map onto reality?
Quite a lot of material, in one way or another, measures how the popularity of programming languages changes over time. Yet it seems that no one has really looked at the broader picture of how programmers themselves move between languages – not from the point of view of global trends in software development, but from the point of view of an individual path.

For us at JetBrains, it is very important to get closer to understanding what is happening from the programmer’s perspective, rather than from that of a programming historian or a career adviser. This is the perspective that matters most to us. In this spirit, we designed our State of Developer Ecosystem surveys with the goal of illuminating what the path of a real programmer looks like. Here’s what we found in 2025.
First, we should acknowledge that the path between languages can look like almost anything. Yes, the most common routes are between the leading languages: from Python to Java and back, with Java to Kotlin in third place by absolute numbers. But people migrate in every possible direction.

But we’ve gotten ahead of ourselves. Let’s take things one step at a time.

What we did before and what we achieved in 2025

Since the beginning of the Development Ecosystem survey, we have used the question “Do you plan to adopt or migrate to other languages in the next 12 months? If so, which ones?” We quickly found, however, that it is not a good predictor for future language migration. It’s one thing to plan to try Rust or switch from Java to Kotlin, but even for very common moves, the number of developers who actually make the switch is much lower than the number of those who have plans. Just because we have issues supporting our old Java 8 codebase, for example, doesn’t mean we’ll actually leave it.
So last year, we added a new set of questions regarding respondents’ previous experience with programming languages. We decided to assess actual migration over the past year using the question “What were your primary programming languages 12 months ago?” and some other related ones. This report addresses these questions, as well as the programming language landscape as a whole, based on the 8,837 responses we collected.
For reference, the following terms refer to the answers of the corresponding questions:
Used language – “Which programming languages have you used in the last 12 months?
Primary language – “What are your primary programming languages? (Up to 3)”
Main language – “What is your main programming language?”

This сhart is based on the responses to the question “Which programming languages have you used in the last 12 months?” The increase in Java and Kotlin shares is most likely the result of a shift in the sample, rather than a real trend. The main fast risers are TypeScript and Rust, as we described in our 2024 Developer Ecosystem infographic. We also predicted some growth for Python, Go, and Lua, but only Go showed actual growth.

JetBrains Language Promise Index

The Language Promise Index tracks the migration prospects of languages in arbitrary units, based on the data we had on the stability of positive or negative migration dynamics and the number of people wishing to learn the language. Lua was previously one of the top languages in this category, but its growth has apparently reached a certain ceiling, and it is no longer among the leaders.

TypeScript, Rust, Python, and Go all still have large growth potential. We expect that a lot of people would change their main language from JavaScript to TypeScript while still using JS as their secondary language. 

As you can see, despite being the most popular language in terms of overall usage, JavaScript is the main language for only 6% of software developers, while Java is still much more popular as a main language. 

Unfortunately, we don’t have enough answers for most programming languages, so the next tables include only the most popular ones.

100% represents all respondents who reported using the respective language as their main language one year ago.
Loyals + Churners = 100%.
Net Growth = Newcomers + Switchers – Churners.
Newcomers – respondents who did not use any programming language one year ago but reported using this language this year.

Switchers – respondents who used a different main language one year ago and switched to this one.
Loyals – respondents who continued using the same main language as last year.
Churners – respondents who used this language as their main language a year ago but have since switched to another language.

Surprisingly, C shows the lowest retention. About half of those who said that C was their main language last year have now switched to something else. This is a bit strange. Initially, we assumed that this flow probably consisted of students who had adopted C through their education and then switched to another language. However, the experience level has only a small effect. Half of those who dropped C chose “I wanted to learn a new language” as the reason for their change, which has a higher share than among switchers from other languages, who mostly chose “A project I am working on requires the usage of a new language.”
However, we didn’t have such questions for last year and do not see so much churn for C based on a comparison of shares with previous-year data (2.1% this year as a main language vs 2.0% in last year). But this churn rate may be a good predictor of future changes.

Why developers leave – and where they go

First of all, we should say that we don’t have data about everyone who churned – people who retired or switched to another career path don’t typically answer our developer surveys. Nevertheless, we do have enough information to draw some conclusions about why people decide to switch from one language to another.

Note: The sample is extremely small (less than 100) for C, Kotlin, and PHP.,
Some findings from this data:
1. Project requirements are the most common reasons for switching languages.
2. As we mentioned before, for C, “I wanted to learn a new language” and “More modern language features” are very popular reasons for switching, which probably point to widespread dissatisfaction and the language’s aging.
3. For JavaScript, the reason people leave is often “Better job market opportunities”.
4. Performance and scalability limitations are often a reason to switch from PHP.
5. “Other” reasons accounted for 18% of Kotlin churners. According to their answers, they are switching companies and switching between hobby and professional use.

The following tables, where both rows and columns list the same programming languages, require some additional explanation. Each one depicts the shift in respondents’ main languages. In the first, the columns are divided by last year’s responses for a given language, and the rows show the languages that respondents have moved to. Conversely, the second tracks where new language users are coming from, with the columns divided by respondents’ current main languages and the rows showing their previous answers. Each column totals 100%, because it tracks the same population over the course of a year. 

The tables show transitions from seeing one language as your “main” language to seeing another language that way. This does not mean that people stopped programming in the “abandoned” language altogether. It simply means that it stopped being their primary language.

This table shows where people go based on their previous language. Python is the main switch destination for all languages except C (whose users preferred to move to Java and C++) and TypeScript (where the top target destinations were Java, JavaScript, and C#).

Why developers adopt – and where they come from

Let’s look at the inverted perspective, based on the language to which people migrated.

Some findings from this data:

  1. Surprisingly, JavaScript is both the main language people leave for better job market opportunities and the one people move to for the same reason. But these flows are not the same: one of the main sources for JavaScript growth is HTML/CSS. So, the pattern looks a bit like a conveyor belt: HTML to JavaScript to TypeScript. 
  2. Project requirements are very common reasons for switching to C# and C++, suggesting many developers switch to these languages simply because they have to. 
  3. People don’t go to Kotlin because they have to, but because it offers a better development experience and more modern language features.
  4. Performance and scalability are the main attractions of Go, whereas ecosystem and library support are stronger attractions for Python.

At first glance, the following table may look the same as the main-language churn table above. But it is actually completely different, with a different meaning.

Here, the language that respondents see as their main language at the time of answering is taken as 100%. Accordingly, the diagonal shows what we called the continuity rate: the share of people who use this language as their main language now and also used it as their main language a year ago. Imagine that we have 150 respondents. Of them, 100 said they use a certain language as their main language this year, while 125 said they used it as their main language last year. 75 people used this language as their main language both a year ago and at the time of the survey.

In this case, the retention rate would be 75%, while the continuity rate would be 60%. It is important to note that everyone else is not necessarily a “newcomer” to the language. They may well have used this language before, just not as their main one.

In terms of growth sources, Python is the main source for C, C#, C++, Go, Java, and JavaScript, which is not surprising, because it is one of the most popular languages.

For Kotlin, the main growth source is Java, while for PHP and TypeScript, it is JavaScript.

For Python itself, the main growth source is Java. 

Conclusion

By looking at actual moves instead of plans, we shift from intention to action – not what developers say, but what they do. The ecosystem data stops being a snapshot and starts to look like a map of flows.

Project requirements still do most of the pushing. Necessity, not choice, drives many switches, but not all. Some languages win on specific jobs, others on performance or ecosystem. And many developers move in chains: from HTML/CSS to JavaScript, and then further along – a conveyor belt of skills, where each step opens the next.

Churn tells a clearer story. C leaks talent faster than expected, even if its headline numbers look stable. Java remains a hub, but its outflow goes mostly to Python and TypeScript, not Kotlin. Python acts as a catch-all destination. TypeScript and Rust still look like the forward edge.

Kotlin, our own language, plays a different game – and plays it well. Developers come not because they have to, but because they want to, drawn by cleaner syntax, fewer rough edges, and a development experience that simply feels better. It wins on pull, not push. Yet the inflow from Java is weaker than expected, and some developers even switch back.

The picture that emerges is a simple one of push, pull, and drift. With the new data, we see not just which languages grow or shrink, but how it happens – which languages move with the current, and which have to work against it.

Let’s see what DevEco’26 will reveal.

show more
How to Use AI Agents in IntelliJ IDEA With ACP
Feed: The JetBrains Blog (https://blog.jetbrains.com/feed/)
Published: 2026-08-12 14:50:50 | Created: 2026-08-12 15:42:54

The Agent Client Protocol (ACP) defines a common contract between a client – like IntelliJ IDEA – and an agent. IntelliJ IDEA already includes several ACP-compatible agents: Codex, Claude Agent, and Junie. Beyond these bundled options, the ACP Registry provides more choices, and teams can register internal or unlisted agents through acp.json.

The key idea is the boundary. IntelliJ IDEA remains the environment where you navigate the project, inspect code, and review changes. Across the ACP connection, each agent maintains its own models, behavior, authentication, and agent-side tools.

This makes the replaceable unit larger than an LLM. An ACP-compatible agent includes the full harness around the model: its planning logic, tools, model-routing behavior, and observability. Because ACP standardizes the boundary between the IDE and the agent, you can swap one agent for another smoothly, without changing how IntelliJ IDEA integrates with it. 

ACP in a nutshell

ACP is often described as the LSP (Language Server Protocol) for coding agents. The analogy works because the integration problem is similar.

Before the LSP, supporting each language meant writing a separate editor integration. The LSP replaced that matrix with a single contract.

ACP applies the same idea to the connection between an editor or IDE and a coding agent. Any ACP-compatible agent can connect without requiring a bespoke plugin or  private API for each pairing.

ACP originated from a collaboration between JetBrains and Zed, with both JetBrains IDEs and Zed targeted as clients from the start.

For local agents, IntelliJ IDEA starts a subprocess and communicates with it via JSON-RPC over standard input and output. During initialization, the IDE and the agent negotiate protocol versions and capabilities. Once connected, prompts flow to the agent, while progress updates, file operations, and permission requests return to the IDE.

Agents can still behave differently under that shared contract. During initialization, each one declares the optional capabilities it supports. Plans, modes, slash commands, session loading, terminal operations, and other features can differ between agents.

ACP carries the interaction between IntelliJ IDEA and the agent. Additional tools and context can reach the agent through MCP (Model Context Protocol), including user-configured servers and the integrated IntelliJ MCP server.

Start with an available agent

IntelliJ IDEA ships with several agents that require no manual ACP configuration, including Codex, Claude Agent, and Junie. Choose one and describe the task you want it to handle.

Each agent has its own workflow style, which may include a planning mode, slash commands, or a particular authentication flow. ACP lets IntelliJ IDEA host that interaction through a shared contract while preserving those differences.

Ask the agent to make a small change. After it edits a file, AI Chat shows the changed file in the conversation. Click it to open the diff in the editor beside the chat and inspect exactly what changed.

That edit-and-review loop is the part worth keeping. If you switch agents later, having the loop inside the IDE prevents you from having to move the project or review changes in a separate tool.

Install an agent from the ACP Registry

The ACP Registry contains additional ACP-compatible agents, together with the metadata IntelliJ IDEA needs to install them.

In IntelliJ IDEA, open Settings | Tools | AI Assistant | Agents and then choose an agent from the registry. The current ACP documentation describes the complete installation flow.

The agent’s configuration view also lets you expose the MCP servers configured in AI Assistant, the integrated IntelliJ MCP server, or both.

IntelliJ IDEA downloads the agent files when you apply the settings. The first session may ask you to authenticate using a method supported by that agent.

The registry also supplies the metadata used for updates and uninstallation. These operations remain in the Agents settings, so adding an agent does not require maintaining another IDE plugin.

Each registry agent retains its own license, service, credentials, and privacy terms. Check these details before granting repository access.

Connect a custom agent with acp.json

Registry agents are intended for broad distribution. An internal agent, however, often has a narrower role and should stay inside the company.

If an internal agent implements ACP, register it in ~/.jetbrains/acp.json. IntelliJ IDEA provides an Add Custom Agent action that creates and opens this file, but you can also edit the file directly.

The configuration below registers a hypothetical company migration agent:

{
  "agent_servers": {
    "Company Migration Agent": {
      "command": "/opt/company/bin/migration-agent",
      "args": ["acp"]
    }
  }
}

Each key under agent_servers becomes the agent’s display name. The command value must contain the full path to the executable that IntelliJ IDEA will start. Place the arguments required to activate that agent’s ACP mode in args; the exact values come from the agent’s documentation.

Use env when the process needs environment variables. Many agents expect you to authenticate through their CLI first and reuse credentials stored in the agent’s user configuration. If an agent accepts an API key through env, follow its documentation and avoid committing the file or its secrets to a repository.

Save acp.json and then select the configured agent in IntelliJ IDEA.

If any ACP-compatible agents are already installed on the machine, the IDE will detect them and offer to add them to the configuration.

Why use more than one agent?

Teams may want different agents for different kinds of work. ACP gives those agents a common way to connect to IntelliJ IDEA:

  • Connecting an ACP-compatible agent through `acp.json` avoids developing and maintaining a separate IntelliJ IDEA plugin.
  • Navigation, editing, and diff review remain in IntelliJ IDEA while developers choose the agent for the work.
  • If an agent’s service or model provider is unavailable, developers can switch to another configured agent and continue working in the same IntelliJ IDEA project.

Keep the IDE, choose the agent

Use an agent already available in IntelliJ IDEA, install one from the ACP Registry, or register an internal agent in acp.json.

ACP turns the coding agent from an IDE commitment into a replaceable choice you can revisit at any time.

show more
Unbundling and Deprecating Low-Usage Plugins in PyCharm
Feed: The JetBrains Blog (https://blog.jetbrains.com/feed/)
Published: 2026-08-12 11:59:50 | Created: 2026-08-12 13:42:55

As part of ongoing maintenance, we are unbundling and deprecating low-usage plugins starting with PyCharm 2026.2. This includes support for Data Wrangler, Hugging Face, and Google Colab, among others. 

A more focused set of bundled plugins means a leaner codebase, enabling us to keep PyCharm fast and responsive and invest our effort where it has the most impact.

You can continue installing compatible versions from the JetBrains Marketplace, but these plugins will no longer be bundled or actively maintained by the PyCharm team. Read this blog post for the full list, deprecation timeline, and next steps.

Why we’re making this change

The tools and workflows developers rely on keep evolving, and several of these plugins never reached the level of adoption we hoped for. After reviewing usage trends, we’ve decided to move a set of low-usage plugins out of active development, so our team can focus on features with broader impact for Python developers.

A smaller set of bundled plugins also means a leaner, more maintainable codebase. As PyCharm continues to grow, we want to invest our engineering effort where it has the most impact and keep the IDE fast and responsive over time.

Unbundling and deprecating a plugin doesn’t necessarily mean deleting it. If a certain plugin’s functionality is still used, we’ll move that plugin’s code to a separate Obsolete Plugins repository. The plugin will remain searchable and installable on JetBrains Marketplace with a fixed compatibility range, but will no longer be rebuilt with every new release or maintained by the PyCharm team.

Which plugins are affected

The following plugins are being deprecated; those currently bundled will be unbundled first:

  • Data Wrangler
  • Hugging Face
  • Google Colab (Jupyter Notebook Colab)
  • Spark, including PySpark support
  • AI Playground
  • AI Agents Debugger
  • dbt
  • Databricks

Other low-usage plugins may be deprecated in the same way in future releases.

Timeline and what to expect

v2026.2

  • The bundled plugins listed above will be unbundled from PyCharm.
  • The PyCharm team will no longer develop new features for these plugins or maintain them.
  • Compatible versions will remain available for installation from JetBrains Marketplace and stay compatible with v2026.2.
  • The plugin source will be published in the Obsolete Plugins repository, where you can continue to build and install it manually.

v2026.3 and beyond

  • The PyCharm team will no longer publish compatible versions of these plugins starting from v2026.3.

What this means for you

If you rely on any of these plugins, you can continue to install a compatible version from JetBrains Marketplace for PyCharm 2026.2. Because the source moves to the Obsolete Plugins repository under an open model, the community can keep building and installing the plugins manually. If you’re interested in maintaining one of them, we’d love to hear from you.

Thank you

We’re grateful to everyone who used these plugins, filed issues, and shared feedback over the years. Thank you!

The PyCharm team

show more
We Gave AI Agents a Live Jupyter Kernel in PyCharm
Feed: The JetBrains Blog (https://blog.jetbrains.com/feed/)
Published: 2026-08-12 12:00:34 | Created: 2026-08-12 13:42:55

If you’ve handed notebook work to an AI agent, you know how it tends to go: More often than not, it corrupts your .ipynb, loses your trained model the moment the run finishes, or burns budget sitting idle through a long job while you watch.

To solve this, we’re introducing a brand-new Jupyter skill. Built directly into PyCharm, it lets your AI agent work inside a live Jupyter kernel instead of handing the job to a subprocess and losing your progress. This one change means state persists across cells, the .ipynb isn’t corrupted, and long jobs wait until execution is completed instead of constantly checking and wasting precious tokens.

JUPYTER SKILL FOR PYCHARM A live kernel made Opus cheaper than the shell. 12% cheaper Claude Opus 5 across 12 ML tasks Kernel USD 59.09 Shell USD 67.06 12 ML tasks 98% cache reads State persists across cells

For Opus, the kernel ran cheaper than the shell

We tested the efficiency of the Jupyter skill by comparing the performance of agents when solving twelve different machine learning problems. We compared three different modes: strictly using bash, strictly using the kernel via the Jupyter skill, and a mixture of both.

While the agent was able to solve all twelve tasks in every mode, there was a difference in how much each mode spent. For Claude Opus 5, working through the kernel cost 59.09 USD versus 67.06 USD through the shell – about 12% cheaper.

MODE COST INPUT TOKENS CACHE READS Kernel (skill) Shell (baseline) USD 59.09 USD 67.06 72.7M 36.3M 98% 82%

Here’s the counterintuitive part: The kernel used more tokens, yet cost less. That’s because it keeps the prompt cache warm. 98% of its input was cache reads, versus 82% for the shell – and cache reads incur only 1/12 of the cost of creating a fresh cache.

Why we built this

Notebooks are where coding agents tend to fall apart. Most AI tools treat an .ipynb like a plain text file: They hand-edit the JSON (and corrupt it), and then run code by running a subprocess. The moment an agent starts the subprocess, the kernel state – the trained model, the loaded dataframe, and every import – lives in the child process, and vanishes when that process exits. The agent can’t inspect it, checkpoint it, or reuse it. Output is buffered until the run ends, so progress is invisible, and long training jobs get babysat – blind until the connection times out.

We asked the obvious question: What if the agent operated a live Jupyter kernel through the IDE?

So we built our new Jupyter skill, which exposes PyCharm’s own notebook intelligence – its notebook model and live-kernel control – to the agent. It does this through a single MCP wrapper, execute_tool, which covers the core notebook operations, including creating, editing, and reading notebooks; running cells; waiting on long runs; probing a running kernel; and controlling its lifecycle. The skill tells the agent when and how to use them.

How it works

The agent:

  • Runs directly in the kernel. The agent writes real Python into a cell and runs it, so variables, models, and data persist across cells – exactly like a human working in a notebook.
  • Waits instead of polling. Rather than polling on a fixed timer and re-billing context on every idle call, wait_cell_execution is blocked until the cell finishes (or a safe cap), and then hands control back. This helps reduce idle round-trips.
  • Reads only what’s new. As a long run streams output, the agent reads the delta – just the lines since its last check – instead of re-sending the whole, ever-growing cell output every time.

Methodology

We used twelve tasks from the MLGym machine-learning benchmark – classification, regression, and reinforcement-learning problems, each of which requires the agent to load data, train, evaluate, and save a result. We ran them across Claude Opus 5 and OpenAI’s GPT-5.6 models, Sol and Terra, through Codex. We compared three modes: through the kernel only, through the kernel plus the shell, and through the shell alone. As these benchmark tasks expose test labels to the agent, we treat cost – not accuracy – as the reliable signal.

One caveat, for transparency: An audit found that one of the twelve tasks, Titanic, was contaminated – the agent could peek at the test set, and each agent used this to select the best model to present as the final solution. Titanic is a well-known, easy task for LLMs, and the issue appeared consistently across all three modes, so it doesn’t skew the comparison. The pattern holds even with Titanic removed – the kernel still ran 10% cheaper than the shell for Opus (56.34 USD versus 62.65 USD).

Results

The cost win is model- and task-dependent. It was clearest for Claude Opus on long, stateful jobs, while the shell came out cheaper on short tasks and for the Codex models – which already use the cache efficiently, so there the skill earns its place on workflow, not cost.

Where it still falls short

Two things are worth keeping in mind:

  • Tell the agent to save its artifacts. In one run, the agent trained a solid model but never saved the submission file before finishing. This is easy to prevent from your side: Just add a clear instruction in your context file (e.g. CLAUDE.md) or a skill so the agent saves any model the moment it clears your target metric.
  • Some tasks are still beyond agents. On a hard task, the agent’s approach simply wasn’t strong enough to clear the bar. That’s genuine ML difficulty, not a tooling gap – some complex problems still need a human in the loop.

The skill removes the mechanical waste, but doesn’t turn a weak approach into a strong one.

Want to try it?

Open the AI chat in PyCharm 2026.2.1 and ask your agent to work in a notebook – create one, load a dataset, or kick off a training run. The agent will operate the kernel directly instead of running commands in the shell.

You can also browse and manage skills directly from the IDE, expand the built-in library with external registries like public GitHub repositories, or let PyCharm import skills you’ve already set up for Claude Code or Codex.

show more
We Stopped AI Agents From Installing Into the Wrong Python: Task Success Rates Jumped to 95%+
Feed: The JetBrains Blog (https://blog.jetbrains.com/feed/)
Published: 2026-08-12 12:01:07 | Created: 2026-08-12 13:42:54

AI agents are supposed to save you time. Ask one to install a dependency or run your project, though, and it often does the opposite: It installs into the wrong Python, ignores the uv or virtual environment your project uses, and hands back a broken setup for you to fix yourself.

PyCharm’s new Agent Environment Coordinator skill fixes this, and this blog post shows just how helpful it proves to be.

AGENT ENVIRONMENT COORDINATOR The agent stopped guessing Python. Average task success 68% -> 98% Baseline With skill 28 Python tasks 6 AI models No system Python pollution

We tested six AI models using 28 different Python programming tasks. Without access to the project’s real environment, they solved 68% of the tasks on average. After we gave them access, their average success rate shot up to 98% – and they didn’t even modify the system Python.

If you’re currently using AI agents in your Python projects, read on to see how the Agent Environment Coordinator can improve their performance.

When the agent could see the project’s environment, it stopped failing

When using the Agent Environment Coordinator skill, each agent, regardless of the model, was able to complete far more of the 28 tasks. (See the Methodology section below for details on what the tasks entailed.) Here is the share of successfully completed tasks for each model, comparing the baseline to running with the skill in PyCharm:

MODEL BASELINE WITH SKILL Claude Sonnet 4.6 36% 96% Claude Sonnet 5 73% 100% Claude Opus 4.8 67% 100% Claude Opus 5.0 94% 98% Codex / GPT-5.5 62% 95% Codex / GPT-5.6 80% 100%

Every model improved, with the weakest baseline improving the most.

Why we built this

LLMs almost never use a project’s dedicated virtual environment. They fall back to a system interpreter, ignoring the fact that there may be several system interpreters and real projects often have more complex, multi-interpreter setups already configured in PyCharm that the agent has no way to see.

For example, pip install httpx runs against the wrong Python, the package installs globally, the script fails, and the environment is polluted.

PyCharm already knows which interpreter belongs to your project and which tool manages it. The agent just couldn’t ask – so we gave it a way.

How it works

The Agent Environment Coordinator lets the agent ask PyCharm two things. get_python_environment returns the correct interpreter for the file or module in question – the path plus the tool behind it (uv, Poetry, pip + venv, conda). If no environment exists yet, configure_python_interpreter sets one up by reusing PyCharm’s existing configuration mechanism – the same one that offers to create a .venv – so the new interpreter also becomes visible in the IDE.

The important part is what the skill doesn’t do. It returns information; it never intercepts or rewrites the command. The agent asks which Python to use, gets an accurate answer, and decides whether and how to use it to write the command itself. We hand it the missing context using existing mechanisms in PyCharm – we don’t let it take the wheel.

The payoff is practical: The agent works with your project setup out of the box. You don’t need to coach it through prompts about which environment to use, or clean up wrong installs afterward.

Methodology

We built a dataset of 28 tasks covering everyday Python-environment work, like running tests, installing a library, listing dependencies, resolving a version conflict, and so forth.

Each task ultimately required the agent to pick the correct interpreter to execute a command. The eval also reduced the reward when the agent polluted the system environment, so a high score reflects a clean run, not just a passing one.

We ran the full set three times per model, with and without the skill, using Harbor, and averaged the results.

Results

Success rates climbed across the board – Sonnet 5 improved from 73% to 100%, Opus 5 from 94% to 100%, and Codex/GPT-5.6 from 80% to 100%. 

Two things stand out in addition to this numerical jump: 

  • The improved success rates demonstrate that the models lacked context, rather than being incapable of completing the tasks. The models didn’t get better – they just stopped guessing the interpreter, which is why the weakest baseline improved the most.
  • Because the eval docks points for polluting the system environment, these higher scores also imply cleaner runs. The agents didn’t just pass more often; they stopped leaving a mess behind.

Want to try it?

Open the AI chat in PyCharm 2026.2.1 and ask your agent to install a package or run something in your project – it’ll reach for the right interpreter on its own.

The Agent Environment Coordinator is one of PyCharm’s bundled skills. You can browse and manage all of them right in the IDE, expand the built-in library with external registries like public GitHub repositories, or import skills you’ve already set up for Claude Code or Codex.

show more
What’s New in PyCharm 2026.2.1
Feed: The JetBrains Blog (https://blog.jetbrains.com/feed/)
Published: 2026-08-12 12:05:32 | Created: 2026-08-12 13:42:54

This PyCharm release is a big one for anyone building with AI. Your agents can now roll up their sleeves inside your Jupyter notebooks – working against a live kernel instead of firing off disconnected scripts. And they finally know which Python to use, so packages land in the right environment every time.

We’re also welcoming marimo notebooks into the IDE and introducing changes to bundled plugins to keep PyCharm fast and focused.

Release highlights

Jupyter notebook skill for AI agents

Let AI agents such as Claude Code and Codex create, edit, and run .ipynb notebooks via PyCharm’s notebook model and a live kernel, so variables, models, and data persist across cells instead of disappearing when the agent shells out. For you, this means more reliable notebook and ML work – with fewer tokens used. To start, just open the AI chat and ask the agent to work in your notebook.

Agent environment coordinator

Tired of AI agents installing packages into the wrong Python environment? This new skill gives the agent your project’s configured interpreter and tool – uv, Poetry, pip in a venv, or conda – so commands target the right environment, not a system one. If none exists, it can set one up via PyCharm, and the agent decides how to use the information. To start, ask the agent to run or install something in your project.

marimo notebooks in PyCharm [third-party plugin]

You can now open, edit, and run marimo notebooks directly in PyCharm with the new plugin developed by the marimo team. 

Work with reactive cells and interactive UI elements in a dedicated notebook without leaving your IDE. Because marimo notebooks are stored as Python files, they are Git-friendly, executable as scripts, and easy to integrate into your existing Python projects.

Changes to bundled plugins in 2026.2

As part of ongoing maintenance, we are unbundling and deprecating low-usage plugins, including Data Wrangler, Hugging Face, and Google Colab support. You can continue to install compatible versions from JetBrains Marketplace, but these plugins are no longer bundled or actively maintained by the PyCharm team. A more focused set of bundled plugins means a leaner codebase, helping us keep PyCharm fast and responsive and invest our effort where it has the most impact.

Redesigned Python Packages tool window

  • Packages now appear in a collapsible tree alongside their dependencies so you can see what’s installed and why – with new icons, right-aligned versions, and inline Install/Update links.
  • A new floating search popup (think “Search Everywhere” but for packages) makes finding and installing fast. It also shows you which environment will be used and lets you pick a module and dependency group.
  • You can install a package into specific uv/Poetry dependency groups like dev or test per workspace member, change versions inline or through the new Change Version dialog, and install from VCS via Custom Installation.
  • Package repositories can be enabled or disabled, with state remembered across sessions. In addition, unreachable URLs show a clear error, and Remote Development support is substantially improved.
Redesigned Python Packages tool window in PyCharm

Clearer type checking

Get clearer, more actionable type messages:

  • Richer type-mismatch errors, now with a breakdown of why the types don’t match.
  • A type diff for callables and other composite types, so both sides read the same way.
  • Fully rendered names and types in inspection tooltips, with clickable links.
Clearer type checking in PyCharm

Bug fixes

  • Virtual environments for end-of-life Python: PyCharm no longer creates venvs for Python 2.7, 3.6, and 3.7. You can still create a new env from a command line and add it to the IDE manually.
  • SQLAlchemy 2.0 Session.get() inference: Session.get(Entity, id) (and SQLModel) is now inferred as a model instance rather than the class.

Download PyCharm

All of these updates are available in PyCharm 2026.2.1. Update right from the IDE or the Toolbox App, or download the latest version to try everything out on your own projects. As always, we’d love to hear your feedback.

show more
Agent Skills in IntelliJ IDEA
Feed: The JetBrains Blog (https://blog.jetbrains.com/feed/)
Published: 2026-08-12 07:58:12 | Created: 2026-08-12 09:42:54

Agent Skills have become a key building block of the Agent Harness for AI-driven agentic development. They give AI agents additional capabilities and knowledge, enabling them to complete tasks in a way that aligns with your preferences.

If you are new to Agent Skills, I recommend reading AI-Assisted Java Application Development with Agent Skills first.

IntelliJ IDEA and other JetBrains IDEs include AI Assistant, which helps developers with AI agentic development. AI Assistant provides an elegant and secure way to use and manage Agent Skills.

If you missed the announcement, see Introducing the Skill Manager and Skill Repository.

In this article, we will explore:

  • How to install Agent Skills via the Skills Manager.
  • Managing skills with the Skill Repository.
  • Installing skills globally, per project, or per agent.
  • Adding your own Skill Repository.

Skills Manager

AI Assistant supports a wide range of AI agents through ACP (Agent Client Protocol).

The Skills Manager in AI Assistant lets you view the list of available skills and install them.

If you have already installed Agent Skills globally, the Skills Manager detects them and helps you install them as IntelliJ IDEA agent skills.

You can install a skill globally, at the project level, or per agent.

Skill Repositories

The Skill Repository lets you manage a list of locations where your verified skills are stored.

By default, JetBrains provides a Skill Repository hosted at https://github.com/JetBrains/skills.

These skills are verified by JetBrains for security vulnerabilities.

It is essential to check for security issues before using agent skills downloaded from the internet. A better approach is to maintain an organization-wide Skill Repository, verified by your team, and add it to the Skill Repository list.

Agent Skills in action

Based on the prompt description, the AI agent automatically detects and uses relevant agent skills.

For example, I installed spring-boot-skill, and when I asked the AI agent to write tests for Spring Boot REST API endpoints, it used the spring-boot-skill.

You can also explicitly invoke an agent skill using $skill-name [prompt] with Codex or `/skill-name [prompt]` with Claude.

Summary

AI Assistant’s Skills Manager makes agent skills part of your regular IDE workflow. You can discover, install, and manage skills without leaving IntelliJ IDEA, then make them available globally, for a specific project, or only to a particular AI agent. The AI agent can automatically select a relevant skill from your prompt, while explicit invocation gives you control when you need it.

Just as importantly, the Skill Repository provides access to skills verified by JetBrains for security vulnerabilities. Teams can also add their own repositories containing internally reviewed skills. This makes it easier to benefit from reusable agent capabilities while maintaining control over which skills developers use in their projects.

show more
Top 5 AI Features in IntelliJ IDEA
Feed: The JetBrains Blog (https://blog.jetbrains.com/feed/)
Published: 2026-08-12 07:58:30 | Created: 2026-08-12 09:42:54

When developers hear “AI in the IDE”, the first thing that often comes to mind is a chat window. IntelliJ IDEA includes an AI chat, but JetBrains AI features also appear in many other parts of the development workflow.

Some of those features are easy to miss because they are built into existing IDE actions: editing code, generating code in place, explaining selected code, working with stack traces, writing commit messages, and choosing which model or agent should handle a task. This overview focuses on five AI features in IntelliJ IDEA that are worth knowing about, with a few additional capabilities explained at the end. The list starts with one that can help before you even open the chat.

1. AI completion

You change a line, and the IDE points out the next line that needs to be changed to match. Rename a field, and it walks you to the other places that reference it, one keystroke at a time. Press Tab to jump to the spot, and Tab again to accept the edit. Ordinary completion guesses what should follow directly under your cursor. This type looks a step ahead, at the edit you haven’t made yet.

It runs on JetBrains’ own models, tuned for coding, and it stays out of your way. Fix the spacing after one comma in a parameter list, and it will offer to fix every other comma in the file. On a larger scale, this is also where full-method generation is handled – the editor has enough local shape to fill in a method body without turning the task into a chat session.

The feature is easiest to understand in small edits. Change one line, and IntelliJ IDEA suggests the next related change in the file.

2. In-editor code generation

Press Ctrl+\ anywhere in a file, type what you want in plain words, like “turn this loop into a stream” or “give me a builder for this class”, and the code appears right there at the cursor. The code lands in place, and you never have to switch to a chat to copy an answer back out of a conversation.

For a small, well-scoped change, the convenience is that the prompt starts where the edit happens. You type the instruction in the editor, review the generated code in place, and keep moving.

The generated code appears as an in-editor diff, so you can accept it, reject it, or refine the prompt. If the first version misses a constraint, add more context, ,like  “Keep the method name” or “use Optional instead of null”. IntelliJ IDEA regenerates the code with the extra information and shows the new diff in the same place.

It is the hidden gem in the list – a general-purpose prompt you can invoke at the cursor for small, arbitrary edits, without opening the AI chat or copying code back into the file.

3. AI Actions

AI Actions is the menu for people who never want to have a conversation with our model. Select a piece of code, press Alt+Enter, and choose from a variety of useful actions – no chat required.

Explain Code takes a regex you didn’t write, a SQL query someone left you, or a cron expression, and tells you in plain English what it does. Generate Unit Tests opens the tests in a diff, so you can argue with them before they land in your project. Generate Documentation writes the doc comment for a public method. These actions keep you in the file. Point at your chosen code, pick an action, and get an actionable response immediately.

4. Bring your own agent

At some point, the task stops being a single editor action. It needs file changes, tests, and a diff you can review. Through the Agent Client Protocol (ACP), you connect an external coding agent and drive it from the same place where you already inspect files, diffs, tests, and problems. Think of ACP as the LSP for agents: one protocol, so the IDE doesn’t need a custom integration for every new agent that appears next month. JetBrains’ own agent, Junie, shows up in the same registry as the third-party agents and receives no special treatment.

You ask the agent to change one endpoint. It proposes the steps, edits the service and the test, runs the test command, and leaves you with a diff you can open from the chat before accepting anything. That is the IDE part of the story. The agent can act, but the review still happens where you already review code.

Skills sit next to that. A skill is a reusable capability you set up once: triaging a CI failure, working through PR comments, converting Java to Kotlin, or nudging an agent away from the usual Spring Data JPA pagination mistake. You add skills from the + menu in the chat, and supported agents can use them without you having to retype the same long set of instructions every time.

That is where the IDE demonstrates its worth. The agent can make a series of edits, but you can inspect each one as it appears – open the affected files, check test outputs, and review diffs before accepting anything. The chat, code, and review stay in the same window, making it easier to stay in control while the agent handles the mechanical work.

5. Bring Your Own Key

Once agents are in the IDE, the next decision is more straightforward – which provider your organization allows the IDE to call. Bring Your Own Key (BYOK) enables you to add the API key or endpoint for any provider your team already uses.

A configured key can sit behind the AI chat and selected IDE features, such as commit message generation, depending on what features the provider and model support. For some teams, the ability to use a provider that has already passed internal review matters more than support for the one at the top of the current model leaderboard. 

You can configure your keys in Settings | Tools | AI Assistant | Providers & API keys. Choose a provider under Third-party AI providers, enter the key or endpoint, and test the connection. Once it is connected, the provider’s models will appear in the AI chat’s model selector.

Beyond the top five

Aside from the top five headline features, a couple of smaller capabilities are still worth knowing about because they appear where the IDE already has context.

When the stack trace is already in the console

The run console is where optimism goes for a reality check. When your app throws an error and the stack trace lands there, the Explain with AI action is on hand. The IDE reads the trace and then gives you a likely cause and a suggested fix. That is a better use of thirty seconds than pasting the top line into a search engine and opening three tabs from 2017.

When the staged diff needs a sentence

Generate Commit Message reads your staged diff and writes the message for you. Edit it, commit, and move on. It is a small feature, but it is exactly the kind you keep using once you know it exists.

The part you may have missed

The AI Chat window is still here, and has gotten more interesting with agents and skills. The easy-to-miss part is the layer of AI-powered productivity features around it: edits suggested as you type, code generated at the cursor, explanations for selected code and stack traces, and commit messages written from the staged diff.

The final effect is boring in the best way: IntelliJ IDEA, doing a little more than it used to, without making a ceremony out of it.

If you tried AI Assistant a year ago and mostly remember the chat, this is the part you may have missed.

show more
The “LSP Moment” for AI Agents: WebStorm ACP
Feed: The JetBrains Blog (https://blog.jetbrains.com/feed/)
Published: 2026-08-11 14:01:53 | Created: 2026-08-11 15:40:54

WebStorm has always been at the forefront of technological advancements and developer experience enhancements. And with the arrival of the ACP, WebStorm becomes even more customizable, as developers can collaborate with their preferred agent to create software using their preferred technology.

For instance, if your team already has a subscription with Anthropic, OpenAI, or Google, you can now use it directly in WebStorm – with no additional JetBrains AI subscription required. JetBrains AI is still there as a convenient way to manage multiple models in one place, but it’s no longer your only option.

This is made possible by the Agent Client Protocol (ACP), an open standard that decouples the IDE from the AI agent – the same idea as the LSP, but for AI. Just as LSP meant you didn’t have to switch editors to get better tooling for a new language, ACP means you don’t have to leave WebStorm to use a specific agent that excels at, say, React refactoring or architectural planning.

In practice, this means you can orchestrate a fleet of specialized agents, switching between them as easily as you switch tabs, while keeping WebStorm’s deep local indexing.

This flexibility matters. Independent benchmarking of Figma-to-code tasks found that no single agent is the leader in every area: agents that scored well on component architecture (3.3–3.6 out of 5) dropped sharply on design token extraction (1.7–2.9). Every agent has different strengths. ACP lets you use them where they can deliver the most value.
And the landscape keeps shifting, so the agent that leads today may not be the one that leads next month. ACP means you don’t have to commit to a single provider to stay current; you can switch agents, not IDEs.

Interoperability via ACP

Instead of WebStorm building a custom integration for every new agent on the market, any agent that implements ACP becomes a first-class citizen in your editor. GitHub Copilot already ships an ACP server, Claude Code has an official ACP adapter, and more major agents are following suit.

  • Agent Client Protocol (ACP): Standardizes how the IDE sends context (files, diffs, and terminal output) to an agent and how the agent sends back actions (file edits, tool calls, and shell commands).
  • Registry and custom agents: Use curated agents from the JetBrains registry (like Junie) or connect your own private, ACP-compliant agent via a simple acp.json configuration.
  • BYOK and infrastructure control: Because ACP is provider-agnostic, teams can point their agents to any backend – Azure, AWS, Anthropic, or local LLMs – maintaining full governance over their data.

Specialization isn’t a bug

In addition to industry volatility, with new agents being released and the leading agents changing every month, agents are also trained on different data and built for different tasks. One might be great at turning a Figma spec into a component. Another could be better at reasoning through a messy refactor. A third might handle debugging well because it’s good at reading stack traces alongside source code.

None of these things are flaws – just specialization.

The catch is that using this knowledge means constantly switching tools, and each tool starts fresh, with no idea what you’re working on. So most developers don’t switch. They use one agent and live with results that are “good enough” but not great.

With ACP, switching agents is cheap. Your files, your project, and your current diff stay where they are. Only the agent changes.

Deep dive: The design → code → browser pipeline

Here’s what a multi-agent workflow looks like for building a complex React dashboard.

Scaffolding with the UI specialist

When converting a high-fidelity design to code, you need an agent tuned for your component library and styling system.

  • The action: Select a “Frontend Specialist” agent from your ACP list. Figma Connect for WebStorm will then pull design context directly into WebStorm.
  • The protocol: WebStorm sends the agent the relevant theme files and component specs.
  • The result: The agent returns a set of file edits that the ACP server applies directly to your project.

Closing the loop with Chrome DevTools

The agent doesn’t just write code – it can verify that the code runs correctly in the browser, too.

  • The action: Tell the agent to fix a console error and verify the fix in the browser.
  • The result: Chrome Connect, which is a bundled Chrome DevTools CLI skill in WebStorm, gives the agent direct access to Chrome. It reads console logs and network requests, traces the error to its source, applies the fix, and confirms it’s resolved. No switching environments. Only a one-time setup is required.

Built in partnership with Google’s Chrome DevTools team.

The rest of the stack

The Figma-to-browser workflow is a clear example, but the same logic applies to various other tasks that show up frequently in your day-to-day workflow:

  • Commit messages: An agent tuned for conventional commits gives you cleaner, more consistent history than asking a generalist as an afterthought.
  • Code review prep: Some agents are genuinely better at reading diffs and spotting patterns.
  • Refactoring: Multi-file changes work better with agents that stay coherent when handling a large number of files.
  • Documentation: Generated docs that people actually read tend to come from agents that write like humans, not spec sheets.

For teams

If you’re a tech lead, ACP fits into your AI governance structure. Approved providers, compliance requirements, and long-term contracts. ACP fits into that structure. Once a provider is approved, ACP provides an IDE integration that is clean, direct, and auditable, so there’s no need for middleware, a third-party relay, or extra subscriptions on top of what you already have. 

Standardized tooling. Define which agents are available for your team, curate them for your stack, and deploy them without individual setup. Every developer gets the same well-matched options without having to configure anything themselves.

Data compliance. ACP communicates directly between the IDE and the agent. If your legal team has approved only one provider, ACP keeps the data flow within those established boundaries.

Custom agent deployment. Build your own ACP-compliant agents pre-loaded with internal project knowledge, coding standards, and private API documentation. Every developer gets that context without manual configuration.

No mandatory subscription lock-in. ACP lets your team connect agents directly (including ones you already pay for) without an additional JetBrains AI subscription. JetBrains AI remains the most convenient option, but it’s no longer the only one.

And because everything stays in WebStorm, you keep the code intelligence that browser-based tools don’t offer: proper indexing, accurate navigation, and real refactoring.

Choice without compromise

ACP ensures that you’re always using the best agent for the task at hand. By bringing ACP to WebStorm, we’re giving development teams the freedom to innovate with AI without losing the world-class refactoring and navigation they expect from a JetBrains IDE.

ACP is available in WebStorm now. Open the Agents menu in JetBrains AI to find it. You’ll see third-party agents there alongside Junie and Quick Edit as they become available through the JetBrains AI platform.

To connect your own agent or set up BYOK, the WebStorm documentation on ACP walks you through the steps.

WebStorm is the best place for humans – in collaboration with their favorite agents –  to create software using the tools and stack of their choice. ACP makes this easier.

Tried ACP with a specific agent for a specific task? Share what you found in the comments.

show more
Blazingly Fast or Blazingly Hyped? A Reality Check on Rewriting in Rust
Feed: The JetBrains Blog (https://blog.jetbrains.com/feed/)
Published: 2026-08-10 15:42:57 | Created: 2026-08-10 17:39:54

This is a guest post by Mateusz Maćkowski and Marek Grzelak, co-maintainers of cot.rs and speakers at Rustikon 2026. You can watch the full talk here.

RIIR. If you’ve spent any time in open source communities, you’ve seen it. Someone opens an issue on a C or C++ project and suggests rewriting in Rust for memory safety and performance. Sometimes it’s a serious proposal. Sometimes it’s a meme. In 2026, it’s honestly a bit of both.

We wanted to find out which one it really is. Not in theory, but by looking at what actually happened when people did it. The wins, the performance numbers, the projects that were abandoned three years in, and the CVEs that showed up in freshly written Rust code. We’ve been in this ecosystem long enough to have seen all of it, and this blog post, based on our talk on Rustikon 2026, was our attempt to give it an honest look. 

TL;DR

  • RIIR can deliver real performance and safety gains, but not automatically. Some projects are faster because of Rust, some just because they were rewritten from scratch.
  • Rewrites introduce new bugs. Even well-funded teams with experienced engineers make mistakes.
  • Not every rewrite succeeds. Prisma, Loglog Games, and the curl/hyper integration all hit walls for different reasons.
  • Binary size, platform support, and interoperability with other languages are real practical challenges.
  • The best approach is almost always to expand incrementally rather than rewrite everything at once.
  • Rust in the Linux kernel and Windows is arguably the biggest validation the RIIR movement has ever had.

What is RIIR? Why did it take off?

RIIR stands for Rewrite It In Rust. The phrase started appearing in issue trackers on C and C++ projects as a way to suggest migration to a memory-safe, performant alternative. According to Google Trends, the “rewrite rust” term started climbing significantly around 2022, which we think aligns roughly with the Rust 2021 edition release, though a lot happened around that time, and we wouldn’t claim to know for certain.

The reasons people reach for Rust when considering a rewrite come down to three things: 

  1. Memory safety
  2. Performance
  3. Fearless concurrency

On memory safety, the Android team’s data is hard to argue with. After Android began transitioning new development to memory-safe languages, the velocity of Rust code in the codebase steadily increased. The data shows a clear linear correlation: as the velocity of memory-unsafe code decreases, so does the number of memory safety vulnerabilities.

In terms of performance, a 2017 paper comparing energy efficiency, execution time, and memory usage across programming languages ranked Rust near the top for both energy efficiency and execution speed. The methodology is not perfect, and direct comparisons between languages are difficult, but the results still point to a broader trend: Rust performs competitively on both speed and efficiency. Memory usage was higher than the absolute best performers, but still within the upper half of the comparison.

And then there’s the Stack Overflow Developer Survey. Rust has been the most admired language for years running. A lot of RIIR projects probably exist simply because developers want to write Rust. That’s worth being honest about.

Three types of rewrites

Not all rewrites are the same, and it helps to be specific about what category you’re talking about. Here we have three categories. 

Drop-in replacements aim to be functionally identical to the original. You replace the binary and nothing else changes. Projects like uutils coreutils, sudo-rs, youki as a container runtime replacement, and Arti as a Tor reimplementation all fall under this. There are thousands of these across the ecosystem, ranging from small file format libraries like the PNG crate replacing libpng, to larger infrastructure projects with serious corporate and community funding behind them.

Alternatives solve the same problem but make different choices. ripgrep instead of grep, delta instead of diff, bat instead of cat, Typst instead of LaTeX, Polars instead of pandas. These aren’t trying to be identical replacements. They’re often faster, more ergonomic, or designed with a different philosophy. Typst is a good example of the readability argument:

LaTeX and Typst can produce the same output, but the source code tells a very different story. And on raw performance, Marek ran both ripgrep and grep against a 37 GB cargo target directory searching for the word “cot”. grep finished in 52 seconds. ripgrep finished in six. That’s not a marginal difference.

Self-rewrites are when an existing project decides to rewrite part or all of itself in Rust, without replacing an external binary. Firefox, the Linux kernel, Windows, Cloudflare’s infrastructure, and the Fish shell all belong here. These are not small bets. Some of the most widely deployed software in the world now contains Rust, and it got there through this category.

Rust rewrite performance: Does it actually deliver?

Sometimes, yes. Sometimes for the wrong reasons. Looking at uutils, sort runs almost four times faster than GNU sort. The reason is parallel merge sort, which Rust’s concurrency model makes considerably easier to implement correctly. But some other utilities are faster simply because they’re a fresh rewrite with 30 years of hindsight. The original project couldn’t experiment as freely because production users depended on it.

The PNG crate is a better example of Rust-specific gains. The Rust implementation is nearly twice as fast as libpng. Part of this comes from auto-vectorization: the Rust compiler generates SIMD instructions automatically from a regular for loop, while most C implementations require hand-written SIMD. The other part comes from streaming DEFLATE decompression, which fits more data into the CPU cache at once. Both are genuine Rust advantages.

Rust binary size: The problem and how projects solve it

Rust binaries are famously large, and the reasons are real: panic handling code, Debug trait implementations, the standard library compiled into each binary, monomorphization from generics, and static linking of all dependencies.

uutils dealt with this through a multicall binary format, the same approach used by BusyBox. All utilities are compiled into one binary and invoked through symlinks. The result: 73 MB of individual binaries becomes 13.8 MB as a multicall binary, which actually beats the 18.4 MB of the GNU coreutils standard install. Compressed with UPX, it gets down to 5 MB.

The problem is solvable, but it requires serious effort.

Rewriting in Rust: What can go wrong and why?

This part doesn’t get talked about enough. Every rewrite introduces new bugs. You’re writing code from scratch, which means you’ll inevitably introduce new bugs or regressions not found in the original project. This isn’t a Rust problem specifically; it’s a software rewrite problem. But it’s worth being clear-eyed about.

Cloudflare introduced an unwrap in a request-scoring component. uutils formatted dates slightly incorrectly, breaking unattended upgrades. sudo-rs echoed a partially typed password back to the terminal after a timeout. The first CVE in Rust code in the Linux kernel came from a race condition in an unsafe block in the Android binder driver. TARmageddon was an RCE vulnerability in async-tar caused by incorrect parsing of the .tar format.

If projects backed by significant funding and experienced teams still make these mistakes, we will too. That’s not a reason not to rewrite, but it is a reason to take testing seriously.

Sometimes, Rust isn’t even the right choice at all. Microsoft chose Go for the TypeScript compiler rewrite largely because Go is much closer to TypeScript in its programming model, which mattered while the codebase would contain both languages for quite some time. The NTPsec project chose Go because, at the time, Go had better network primitives and a less fragmented ecosystem. These were reasonable decisions, not failures of imagination.

And some rewrites that chose Rust still didn’t succeed. Prisma migrated away from their Rust query engine back to TypeScript due to skill-set gaps, deployment complexity, and runtime issues. Loglog Games abandoned Rust after three years of game development. They found it excellent for refactoring but poor for iteration speed, and noted that the Rust game development community focuses more on engine technicalities than on shipping finished games. The curl/hyper integration got to 95% completion and was then abandoned due to the difficulty of the last 5% and the lack of community momentum. Interestingly, the collaboration still benefited both projects: the process of trying to integrate them led to forced cleanups in both codebases.

Licensing is a real decision

One thing that doesn’t get discussed enough in RIIR conversations is that if you’re creating a new project that reimplements an existing one, your license choice has consequences.

A more restrictive license, like GPL, may exclude users who can’t introduce copyleft dependencies into proprietary projects. A more permissive license may draw criticism from the open source community, as some fear companies will use the code without contributing back. There’s no universally correct answer. It depends entirely on your project’s goals and community. But it’s a decision worth making consciously rather than by default.

Is the RIIR movement still happening in 2026?

The RIIR meme has faded somewhat. But the actual movement hasn’t. Rust in the Linux kernel is no longer experimental, and the maintainers declared the experiment a success at the 2025 Maintainers Summit. Rust is running in the Windows kernel. Cloudflare, Firefox, and countless infrastructure projects have committed significant Rust code to production.

The scale is real. Between Linux and Windows alone, Rust is running on billions of devices. That’s arguably the biggest validation the “rewrite it in Rust” idea has ever received.

How to actually do it well

If you’re considering a rewrite, a few things we’d recommend thinking through first. Make sure it actually makes sense for your use case. Ask whether your codebase is in a memory-unsafe language, whether it’s critical software, whether you have real performance and reliability requirements, and whether you have significant parallel or concurrent code that’s hard to reason about. The more of those boxes you check, the stronger the case.

Make sure your team is ready. Either they already know Rust, or they’re genuinely willing to learn and contribute to it. Google’s data suggests that around two-thirds of developers feel confident contributing to a Rust codebase within two months. But that’s not a guarantee, and the last 5% of a rewrite is almost always harder than you expect. Small rewrites take months. Medium ones take one to two years, and large rewrites take two to five. It almost always takes longer than you estimated.

Prefer expanding incrementally over rewriting completely. Adding new components in Rust while keeping the old codebase running is almost always less risky than a full replacement. You get the benefits without betting the whole project on it.

When you do rewrite, build a serious test suite. The best example of this in practice is uutils, which runs against the official GNU coreutils test suite to track parity. As of early 2026, they’re at 92.2% pass rate and climbing.

So is it worth it?

If your project is written in a memory-unsafe language, handles critical functionality, has real performance requirements, and involves substantial concurrent code, yes. A rewrite is strongly justified, and the evidence supports it.

Outside of those conditions, it’s still potentially worth it, but the analysis needs to be more careful. The enthusiasm is understandable as Rust is genuinely good. But it was designed as a systems programming language, and that’s where it does its best work. Treating RIIR as a default answer to every performance or safety concern is how you end up with a two-year rewrite project that ships six months late and introduces bugs you already fixed.

Frequently Asked Questions

What does RIIR mean?
RIIR stands for Rewrite It In Rust. It started as a suggestion in open-source issue trackers to migrate C and C++ projects to Rust for memory safety and performance, and became a broader cultural meme in the Rust community.

Is rewriting software in Rust worth it?
It depends on your situation. If your codebase is in a memory-unsafe language, handles critical functionality, and has real performance or concurrency requirements, the case for a Rust rewrite is strong. In other situations, the benefits are less clear, and the costs, but the learning curve, rewrite time, and new bugs deserve serious consideration.

What are the risks of rewriting in Rust?
Every rewrite introduces new bugs, including bugs the original project already fixed. Rust rewrites also require developers to learn the language, can take significantly longer than estimated, and may face challenges with platform support, binary size, and interoperability with other languages.

What is the best approach to migrating to Rust?
Incremental expansion rather than full rewrite. Add new components in Rust while keeping existing code running. When you do rewrite, invest in a thorough test suite that validates the new implementation behaves identically to the original.

Did Rust succeed in the Linux kernel?
Yes. At the 2025 Linux Kernel Maintainers Summit, the consensus was that the Rust experiment was a success. Rust is now a core part of the kernel and is no longer considered experimental.

show more
JetBrains .NET Day Online 2026: Save the Date and Submit a Talk
Feed: The JetBrains Blog (https://blog.jetbrains.com/feed/)
Published: 2026-08-10 16:59:28 | Created: 2026-08-10 17:39:54

A free, online event for the .NET community.

JetBrains .NET Day Online 2026 takes place on Wednesday, October 7. Expect a day of practical talks, live demos, and real-world lessons from community speakers and the JetBrains .NET team.

Two things are different this year. The event was two days last time, while this year it’s one. We’re also opening the call for speakers now rather than a few weeks out, which means you have more time to put a proposal together.


Register now  Save the date


Event basics

  • Date: Wednesday, October 7, 2026
  • Format: One day online livestream with real-time chat
  • Time zone: Central European Summer Time, CEST (UTC+2). All agenda times will be listed in CEST.
  • Cost: Free
  • Recordings: Sessions will be available on demand after the event
  • Landing page: https://lp.jetbrains.com/dotnet-day-online-2026/

What’s on the agenda

The full lineup will come together over the next few weeks. Here’s what’s already locked in:

  • A keynote from the JetBrains .NET team on where the tools and the platform are heading and why.
  • A live panel with JetBrains PMs and engineers, scheduled around the European lunch break so you can drop in without rearranging your day. Bring your questions to the chat, and we’ll get through as many as we can.
  • Community talks, which is where you come in.


One thing that sets this event apart from most .NET content is that the people who build and support the tools are in the chat with you, including PMs, engineers, QA, and support staff. If you’ve been sitting on a question, October 7 is the day to ask it.

Call for speakers

We’re looking for talks that help .NET developers get better at the work they do. The goal is that they are practical, specific, and useful the day after the event.

Last year’s lineup covered .NET Aspire, clean architecture, C# nullability, messaging and queues, Blazor and Uno, F#, memory diagnostics, async/await, distributed logging, and what GenAI is doing to test-driven development.

We’re especially interested in talks on AI-assisted .NET development, where practitioners show what actually works on real projects rather than a polished demo.

Here’s how and when to apply online:

  • Submit your proposal: https://sessionize.com/jetbrains-net-day-online-2026
  • Deadline: Friday, September 4, 2026
  • Suggested length: 30 minutes. If your talk genuinely needs 45 minutes, tell us why in your submission and we’ll consider it.
  • What you get: a live audience, a professionally produced recording you can keep, and a team that handles the logistics so you can focus on the talk.
  • Timing: we start in the CEST morning and run through the European day, same as last year. We’ll confirm your exact slot with you once the schedule comes together.


Never spoken at an online event before? Submit your talk anyway! We’re actively looking for speakers we haven’t featured before, including from parts of the .NET community that don’t get enough stage time. If you have a topic and you’re not sure it fits, send it in and let us decide.

How to join

If you want to speak

If you want to watch

  • Registration opens in [mid-August]. We’ll announce it here and on the event page.
  • Tune in live on October 7 and bring your questions to the chat.

What’s coming next

We’ll announce the speaker lineup and the full agenda on this blog. For event updates in your feed, follow @JetBrainsRider and @ReSharper on Bluesky or X/Twitter.

show more
Chrome DevTools Connect for WebStorm: Your AI agent can now interact with the browser
Feed: The JetBrains Blog (https://blog.jetbrains.com/feed/)
Published: 2026-08-10 12:05:17 | Created: 2026-08-10 13:39:54

Frontend development has historically meant working in three separate environments: a design tool for specs and prototypes, the IDE for coding, and a browser to check if everything works. A few days ago, we released the new plugin Figma Connect for WebStorm, which eliminated the first context switch. Design intent, component specs, and design tokens flow directly from Figma into WebStorm, so the agent starts with the actual design, not a description of it.

That left the second switch untouched. The agent generates code, and then you leave the IDE, open the browser, check what’s rendering, catch something broken, describe it back to the agent, and repeat. The browser was still a separate environment – one that the agent couldn’t see.

Now, Chrome DevTools Connect eliminates the need for that second switch. It ships as a bundled Chrome DevTools CLI skill in WebStorm 2026.2.1, helping an AI agent interact with Chrome using the full power of Chrome DevTools. The first time the agent reaches for it, WebStorm prompts a one-time package install, and after that, it’s automatic.

Get started

What the agent can see and do in the browser

When you’re working on a UI with an AI agent, it can open Chrome, inspect what’s rendering, read console logs and network requests, take screenshots, and interact with the page directly – without you leaving the IDE or narrating what you see.

The agent reaches for the browser when it decides runtime verification is needed, or when you ask it to. No additional setup, MCP wiring, or researching which browser automation tool plays well with your setup.

It’s built in partnership with Google’s Chrome DevTools team, using the Chrome DevTools CLI.

What this changes in practice

Consider a bug in a multi-step checkout flow: The order summary shows stale prices after a user goes back and updates their cart. The component renders correctly on first load, and nothing in the code looks wrong. The bug only surfaces after a specific sequence: Add item → proceed to checkout → go back → change quantity → proceed again.

Previously, reproducing this bug meant clicking through that sequence manually every time. You’d spot the stale price, switch to the IDE, describe what you saw, wait for the agent’s fix, then click through the whole sequence again to verify. If the fix was off, you’d repeat. The agent was working from your description – you were the one doing the clicking.
With Chrome DevTools Connect, you tell the agent: “The order summary shows stale prices if you go back and change the cart contents, so fix it and verify the fix in the browser.”

The agent navigates through the flow, reproduces the bug, reads the stale state from the console, traces it to a missing dependency, applies the fix, and clicks through the sequence again to confirm it’s gone. You stay in the loop for decisions but stop being the relay between the IDE and the browser.

Design → code → browser workflow

Figma Connect for WebStorm was the first part of the design-to-code workflow which included design into the IDE at the start. Now, Chrome DevTools Connect is the second, with browser validation coming at the end.

The full design → code → browser workflow now takes place entirely inside WebStorm – no switching required.

If you enjoyed this, stay tuned because there are more integrations on the way!

show more
Page 1 of 2 (93 total items)