
RSS Feeds
Saudi Arabia is locked in a dangerous stand-off with the Houthis
Feed:
Latest Updates
(https://www.economist.com/latest/rss.xml)
Published: 2026-07-30 13:02:21
|
Created: 2026-07-31 01:13:00
By threatening shipping, the Yemeni rebels hope to wring concessions from the kingdom
show more
Colombia Presidential Election Heads to Run-Off: What to Know
Feed:
TIME
(https://time.com/feed/)
Published: 2026-06-01 11:15:03
|
Created: 2026-07-31 01:13:00

A conservative admirer of U.S. President Donald Trump and a leftist senator will go head-to-head in a run-off election that will decide Colombia’s next president later this month.
Abelardo de la Espriella, a tough-talking lawyer and businessman, took the lead in Colombia’s presidential election on Sunday night, with about 43.7% of the total votes according to results released by the national civil registry, while Iván Cepeda, a seasoned politician from the Pacto Histórico party led by incumbent President Gustavo Petro, followed with 40.9%.
But with neither securing an outright majority, the two are headed for what’s expected to be a highly polarized second round of voting on June 21, which may determine Colombia’s direction and the future of its relationships with other countries, including the U.S.
Petro, however, has cast doubt on the results of the first round of voting, alleging in a social media post that the preliminary vote-counting software added 800,000 voters who do not exist. Petro said that the only results that he would “heed and accept” are those that come out of the official scrutiny process—a dayslong process wherein Colombian commissions of judges, notaries, and other delegates review election records.
Cepeda similarly challenged Sunday’s vote results. “Only when the vote-counting commissions have fully clarified what happened will we comment on tonight’s results,” Cepeda said.
The elections are expected to be a referendum on Petro, Colombia’s first leftist President, as progressive leaders in Latin America increasingly face pressure—not only from their respective constituents, but also from the Trump Administration—to focus more on curbing gang violence and ramping up domestic security.
Here’s what to know.
Who is Abelardo de la Espriella?
De la Espriella, 47, who refers to himself as “The Tiger,” is a political novice running as an independent under a movement called Defensores de la Patria (Defenders of the Homeland) and positions himself as an anti-establishment conservative.
He has publicly spoken in favor of the Administrations of Donald Trump in the U.S., Nayib Bukele in El Salvador, and Javier Milei in Argentina. Milei congratulated de la Espriella on social media for his first-round victory, adding that if the second round yields the same results, Colombia will “rejoin the concert of Free Nations.”
De la Espriella rejects gender ideology and has been previously slammed for actions deemed homophobic. On abortion, de la Espriella said he was “pro-life”. On firearms, he has expressed support for the legalization of civilians carrying them.
Like Trump, de la Espriella has spoken against multilateral institutions like the United Nations and the Inter-American Court of Human Rights, and he said he would withdraw Colombia from organizations that “have served no purpose.”
Like El Salvador’s Bukele, de la Espriella presents himself as tough on crime, countering Petro’s “total peace” approach of attempting dialogue with armed rebels to end violence in the country. De la Espriella promised to “fight with an iron fist the criminals, the corrupt, the unpunished criminals and anyone who intends to continue threatening the existence of Colombia.” Also mirroring Bukele’s approach, de la Espriella has proposed the construction of 10 megaprisons.
The prisons are just one part of de la Espriella’s larger plans for Colombia’s security: in his campaign manifesto, he said he plans to launch a nationwide military offensive to enforce better state control in 90 days, and he pledged to strengthen the country’s armed forces through drones and artificial intelligence. He also plans to counter drug-trafficking by eliminating 330,000 hectares of coca farms—by any means necessary.
But de la Espriella’s opponents question his commitment to cracking down on crime, after he represented several controversial figures in Colombia. He was the former lawyer of David Murcia Guzmán, who masterminded a giant pyramid scheme in the country, and of Alex Saab, a close business associate of Venezuelan leader Nicolás Maduro who was deported to the U.S. last month and indicted for money laundering. De la Espriella also represented some high-profile victims, including Natalia Ponce de León, who was the target of an acid attack in 2014, and Rosa Elvira Cely, whose murder in 2012 generated national outrage and led to the creation of Colombia’s femicide laws.
The lawyer, who is married and has four children, denied that he is far-right. Speaking to Agence France-Presse in February, de la Espriella said it was “absurd” to describe him as such despite his links to right-wing figures and conservative rhetoric. "Someone who is far right does not believe in democracy or in the separation of powers," he said, adding that he will respect Colombia’s constitution. “I’m a democrat.”
Who is Iván Cepeda?
If de la Espriella promises radical change in Colombia, Cepeda, 63, offers continuity. Cepeda, a Bogotá native, is a political veteran who led in opinion polling before the Sunday elections.
Cepeda owes some of his popularity not only to Petro but also to his father Manuel Cepeda, a former Unión Patriótica senator and member of Colombia’s Communist Party who was assassinated by paramilitaries in 1994. The younger Cepeda then rallied for human rights and investigations into state and paramilitary violence. He established groups that intended to seek justice for victims of state-sponsored killings, but amid threats to his life, he went into self-exile overseas for a few years.
In 2010, back in Colombia, he entered politics by winning an election to be a congressman and later won a Senate seat in 2014. As senator, Cepeda exposed former President Álvaro Uribe's alleged ties to paramilitary groups. Uribe sued Cepeda for allegedly manipulating witnesses, but the Supreme Court cleared Cepeda of wrongdoing. Uribe was himself later charged and convicted of bribing witnesses in the same case, though the conviction was overturned months later.
In line with Petro’s progressive agenda, Cepeda has vowed to continue peace pact negotiations. Cepeda is often described as one of the architects of Petro’s “total peace” strategy, and he was also involved in talks that led to a 2016 deal between the Colombian government and the now-defunct Revolutionary Armed Forces of Colombia (FARC) guerrilla group, which demobilized thousands of rebel fighters. But critics, including the Nobel Peace Prize-winning former President Juan Manuel Santos, have called Petro’s “total peace” strategy a “failure” for its poor implementation that eventually paved the way for the proliferation of armed rebels in other parts of Colombia.
Compared to his political opponent de la Espriella, Cepeda espouses a human-centric approach to drugs in Colombia. He rejects widespread herbicide spraying as a means to cut the supply of drug crops, opting for farmers to agree to replace them with legal alternatives, with government assistance. According to El Espectador, Cepeda has explained that most farmers plant coca crops not out of choice but due to a lack of available resources.
Cepeda has pledged to implement "social capitalism" as President, including expanding income support and social benefits for marginalized groups. He has also promised an “agrarian revolution”—to expand rural land reform efforts by handing 1 million ha. to those who have lost land amid clashes between government forces, paramilitaries, and rebels.
What are the implications for U.S.-Colombia ties?
Both de la Espriella and Cepeda want to improve diplomatic ties with the U.S., but being on opposite sides of the political spectrum means their approaches are vastly different. The two countries are longstanding security allies, but Trump has criticized Colombia under Petro for supposedly failing to stem the supply of cocaine and has even mused about a possible military intervention similar to that in Venezuela.
Like Petro, Cepeda has publicly criticized the U.S.’s exertions of influence in Colombian affairs. “We’re open to having a constructive relationship with the U.S. government, but they can’t treat us like their lackeys, like slaves, like a colony,” Cepeda said in a speech last October. Cepeda said in early May that while he hopes Colombia has a “cordial” relationship with the U.S., it is not a “vassal state.”
If de la Espriella wins in the second round, he’s expected to bring the country ideologically closer to the U.S., in line with Trump’s push to influence affairs within Latin America. Recent elections in the region show a rightward shift, including in Chile, Costa Rica, and Peru.
Speaking to Agencia EFE in March, de la Espriella said that he admires Trump’s “cultural battle against wokism, against globalism,” and that, should he win, he will fortify “the military alliance with the United States and with the State of Israel,”after Petro broke off diplomatic relations with Israel in 2024 because of the war in the Gaza Strip.
Zendaya on working with Tom Holland in Spider-Man: ‘When you’re best friends it’s easy’
Feed:
BBC News
(http://feeds.bbci.co.uk/news/world/rss.xml)
Published: 2026-07-29 20:21:46
|
Created: 2026-07-31 01:13:00
The couple walked the white carpet at the London premiere of their latest film, Spiderman: Brand New Day.
show more
Iran’s war with the US is not its only conflict as internal crises mount
Feed:
World news | The Guardian
(https://www.theguardian.com/world/rss)
Link:
https://www.theguardian.com/world/2026/jul/30/iran-war-us-conflict-internal-crises-economy-dissent
Published: 2026-07-30 15:24:31
|
Created: 2026-07-31 01:13:00
Government fears social discontent on ‘most important battlefield’ of economy and livelihoods as war takes its toll amid anti-state dissent
Iran, in the middle of an escalating five-month war with the US, continues to stumble from one internal crisis to another – whether it is over public executions, the rising cost of living, the alleged bias of the state broadcaster or even the post-midnight destruction of pavements outside liberal-leaning Tehran cafes. Very little that happens in Iran, cultural or political, momentous or trivial, does so uncontested.
But there is now a growing threat of a long diplomatic deadlock, forged by mutual distrust in which neither side believes the other will stick to any agreement. That impasse has occurred as the war broadens, drawing in Yemen, Iraq and now Egypt. In Iran, at least, the advocates of escalation are winning. As a result, a convergence of Iran’s conflicts, internal and external, becomes more likely.
Continue reading...My partner’s mother dominates him and it makes me feel helpless | Ask Annalisa Barbieri
Feed:
The Guardian
(https://www.theguardian.com/international/rss)
Published: 2026-07-26 05:00:03
|
Created: 2026-07-31 01:13:00
You are stepping into a family system with its own history and loyalties; try to consider how you might set boundaries without rejecting his mum
I’m in my 30s and have been living in Spain for a decade. My partner is Spanish and we have lived together for a year.
The bond he has with his mum sometimes makes me feel angry, jealous and helpless. I’m aware that, culturally, Spanish people often have closer bonds with their families and I try to accept that. He is an only child and his father left his family when he was a teenager and started another. I feel my partner has developed an unhealthy and codependent relationship with his mum.
Continue reading...US hits dozens of targets in Iran overnight as peace efforts under threat
Feed:
World news | The Guardian
(https://www.theguardian.com/world/rss)
Published: 2026-07-30 15:30:33
|
Created: 2026-07-31 01:13:00
Central Command says strikes aimed at diminishing Iranian military while mediators say talks are continuing
The US struck Iran overnight and Tehran retaliated at US allies in the region, reigniting the low-intensity, tit-for-tat war as mediators struggled to pull the two countries back to the negotiating table.
The US carried out overnight strikes on Iran – the first in more than five days – hours after Donald Trump vowed to hit the country “very hard” following Tehran’s targeting of a base in Jordan that hosts American troops.
Continue reading...'It's our home, it's our forest': BBC speaks to locals fighting France wildfire
Feed:
BBC News
(http://feeds.bbci.co.uk/news/world/rss.xml)
Published: 2026-07-29 16:49:41
|
Created: 2026-07-31 01:13:00
Firefighters are battling flare-ups in 40C heat in the Gironde region, as some locals have refused to heed evacuations.
show more
Saudi Arabia prepares sea and possible land offensive against Houthis
Feed:
World news | The Guardian
(https://www.theguardian.com/world/rss)
Published: 2026-07-30 17:50:21
|
Created: 2026-07-31 01:13:00
Yemeni sources say Saudis concentrating forces for what could be attack in central Yemen
Saudi Arabia is preparing for a major military offensive against the Houthis by sea and possibly by land in central Yemen, Yemeni sources believe, in a move to break the chokehold on its oil exports through the southern Red Sea.
Saudi forces have been seen withdrawing from the east of Yemen in what could be preparation for a land offensive. At the same time, Riyadh is trying to organise a naval coalition to protect shipping from Houthi attacks in the Red Sea and the Bab al-Mandab strait.
Continue reading...How to Bring a Geothermal Well Back from the Dead
Feed:
WIRED
(https://www.wired.com/feed/rss)
Published: 2026-07-29 10:00:00
|
Created: 2026-07-31 01:13:00
Startup Zanskar has created one of the most productive geothermal wells in the US at a power plant that had been in decline for years.
show more
More Typos, Fewer Em Dashes: Writers Are Creating an Anti-AI ‘Literary Counterculture’
Feed:
WIRED
(https://www.wired.com/feed/rss)
Published: 2026-07-29 10:30:00
|
Created: 2026-07-31 01:13:00
Novelists, journalists, and power LinkedIn posters are embracing first-person narratives and idiosyncrasies to avoid being mistaken for chat bots.
show more
How do you rewrite C/C++ projects to Rust?
Feed:
The JetBrains Blog
(https://blog.jetbrains.com/feed/)
Published: 2026-07-27 11:02:50
|
Created: 2026-07-31 01:13:00
Disclaimer: This article was created with the assistance of AI and reviewed by the JetBrains RustRover team.
C and C++ to Rust migrations are no longer just an experimental idea. More teams are now looking at Rust as a practical way to improve memory safety, reduce long-term maintenance costs, and modernize performance-critical systems. But a successful migration is not about rewriting everything just because Rust is popular. The hard question is more practical:
‘’Why should teams consider Rust for existing C or C++ systems, which parts of those systems should move to Rust, and how do you do it without breaking what already works?’’

This was one of the main topics in our recent livestream with Luca Palmieri from Mainmatter, author of 100 Exercises To Learn Rust and the upcoming C to Rust Migration book, and Vitaly Bragilevsky from JetBrains. Mainmatter works with teams adopting Rust in real-world software projects, including through consulting, training, and migration support. In the livestream, Luca Palmieri shared what that practical experience shows: where C and C++ to Rust migration projects succeed, where they usually get stuck, and why incremental migration is often the safer path.
The full livestream is available here:
Tldr: For many production systems, the safest C++-to Rust migration strategy is not a full rewrite. It is an incremental migration: start with isolated modules, make Rust work inside the existing build and release process, and expand gradually as confidence grows.
Related resources: Mainmatter offers Rust consulting for teams planning or running migration projects. For a deeper look at migration patterns, check out Mainmatter’s C to Rust Migration book. And if your team wants to strengthen its Rust foundations first, Luca Palmieri’s 100 Exercises To Learn Rust is available as a JetBrains Academy course.
Why teams are migrating from C and C++ to Rust
A few years ago, suggesting a C or C++ to Rust migration could feel risky. Nobody wants to be the canary in the coal mine, especially when the project is load-bearing, serving production traffic, or important to the business. If a team is investing years of engineering effort into a migration, they need to know they will not discover a roadblock halfway through.
That hesitation is weaker today. Companies like Google aren’t just migrating to Rust; they’re publishing data arguing that Rust adoption improves safety, especially by reducing memory-safety vulnerabilities, and reducing defect rates compared to their C++ predecessors. Beyond de-risking, there are several factors that have had an impact on today’s situation:
- Expertise is spreading. Engineers who learned Rust at one company bring that knowledge to their next role, creating a multiplier effect across the industry.
- Tooling has matured. The ecosystem gaps that made early adoption painful have largely been filled.
- Hiring concerns are fading. The argument that “we can’t find Rust developers” loses substance when more developers have production Rust experience.
- AI assistance reduces friction. Generative AI tools help flatten the learning curve, making the initial ramp-up less daunting.
The question has changed. Teams are now asking whether their C or C++ codebase has a problem that looks like a good fit for Rust. For a broader look at how the two languages compare, including memory safety, performance, and concurrency, see our Rust vs C++ comparison. Let’s see which projects should migrate and how.
Which Projects Should Migrate?
Not every C or C++ project benefits from a Rust migration. For hobby projects, the calculus is simple: migrate if you want to learn Rust or if it feels right. For production systems, migration needs to make business sense. The strongest candidates are usually codebases where maintainability is already expensive:
- Performance-sensitive codebases where squeezing every ounce of efficiency pushes teams toward complex patterns that are hard to reason about. Rust’s safety guarantees don’t compromise performance, but they do make those complex patterns more manageable.
- Concurrent or multi-threaded systems where the borrow checker provides safety nets that are difficult to replicate in C++. Data races and memory safety issues that require constant vigilance in C++ become compile-time errors in Rust.
- Security-critical components where vulnerabilities carry high costs. If your code is an attractive attack target, preventing memory safety issues before they reach production has clear economic value.
- High-scale deployments where even modest efficiency improvements translate to meaningful infrastructure savings. If migrating to Rust lets you run on less powerful hardware, those savings compound quickly.
The common thread is maintainability. Successful migrations improve the ability to ship features faster, reduce defect rates, or both. The migration cost must be justified by reduced rework, fewer security incidents, improved developer productivity, or operational savings.
C++ to Rust migration: Full Rewrite vs. Incremental Migration
The choice between a complete rewrite and an incremental migration isn’t ideological. It depends on your deployment model, codebase characteristics, and available testing infrastructure.
A full rewrite can sound appealing. You start from scratch, set up the codebase the way you want, draw the boundaries where you like, and leave old decisions behind. But let’s see where a full rewrite makes sense?
When Full Rewrites C/C++ to Rust Make Sense
- The codebase is relatively small, and the scope is tractable
- You have an exhaustive black-box test suite that validates behavior without assuming internal structure
- The API surface is well-defined and stable
- You control the deployment environment
Services deployed as backends can be good candidates. You can route shadow traffic to the new implementation, compare responses against the old system, and gradually shift load. If something breaks, you have multiple levers to pull: roll back instantly, route only a tiny percentage of traffic, or limit the migration to specific customer segments.
The key is confidence-building mechanisms. You need mechanisms that prove the new implementation behaves like the old one, including the small details that users may unknowingly depend on.
When Incremental Migration Is Better
For many teams, the safest C++ to Rust migration path is incremental, especially for large, active, or customer-deployed systems. Instead of replacing the whole codebase at once, you migrate one piece, ship it, learn from it, and continue. Success looks like steady progress, ideally accelerating progress. One release may contain 95% C or C++ and 5% Rust. A later release may contain 90% C or C++ and 10% Rust.
Over time, the Rust part grows, the old code shrinks, and the team keeps watching the important signals such as defect rates, performance, user feedback, and developer velocity.
The value of this approach is that every migrated piece is integrated into the real product. Users get the new code. The team sees whether it performs better or worse. Bugs show up in the normal issue tracker. The migration builds confidence release by release.
Ideally, the more Rust you have, the easier it becomes to add more Rust. The lift-off phase is the hardest. Once the build system, testing setup, FFI conventions, and release process are in place, the next modules should be easier than the first.
Incremental migration also makes sense when institutional knowledge matters. If you migrate piece by piece, the developers who maintain the code stay involved throughout the process. A full rewrite risks knowledge loss: you might end up with better-structured code, but nobody remembers why certain decisions were made.
Where to start: eat the graph from the leaves
One practical approach is to look at the module graph and find isolated modules. Start from the leaves: modules that have no dependencies, or only a few dependencies on the rest of the system. This is usually the easiest starting point because the first Rust code does not need to call into C or C++ code. It only needs to be callable from the existing C or C++ codebase.
In other words, the Rust module exposes an extern API, but inside it can still be structured as normal Rust. This matters more than it seems. Before you write meaningful Rust code, you need to solve integration problems:
- How does Rust fit into the existing build system?
- How do C, C++, and Rust code link together?
- Can memory sanitizers still run across language boundaries?
- Does everything work on all supported platforms?
- How will the team test and release mixed-language code?
Starting with a simple, low-complexity module lets you solve these problems before tackling harder software challenges. You want to ship a line of Rust that does almost nothing but builds correctly, links properly, and works in all your CI flows.
Once that first module is done, you’ve freed other modules from dependencies. You tackle those next, gradually expanding your island of Rust code. Eventually, you have C on the outside and Rust on the inside, and you keep expanding until the C disappears.
The downside is that you might spend months working on modules far from the action, modules that haven’t been touched in years. It can feel like you’re not adding business value. But you’re building the foundation that lets you rewrite the complex, important parts without managing C dependencies underneath.
The alternative: vertical slices
The opposite approach is to drive a specific user flow or feature through Rust, cutting a vertical slice through the stack. This puts Rust code in the critical path immediately, demonstrating business value from day one.
The challenge is complexity. Your Rust code will constantly call into C and be called from C. You’ll have raw pointers everywhere. It will be Rust, but it will feel like C-style Rust. You won’t get safety benefits for a long time because most of the action happens outside the domain the borrow checker can verify.
This approach can leave teams wondering: “Is this Rust code actually better than the C++ it replaced? It looks and feels the same.” Both strategies have merit. Bottom-up from the leaves is generally cleaner and allows for better restructuring. Vertical slices show business value faster but require navigating more complexity upfront.
Rust FFI is where the migration gets tricky
The hardest part of incremental migration is crossing the language boundary. Inside pure Rust, the compiler helps enforce ownership, borrowing, and lifetimes. You can try a design, and the borrow checker tells you whether the memory-safety story works.
Once raw pointers cross between Rust and C or C++, that safety net becomes weaker. The programmer has to track assumptions manually:
- Is this pointer still alive?
- Does it have aliases?
- Who owns the value?
- Who is allowed to free it?
At that point, you become the borrow checker. This is where Rust FFI becomes central. The team needs clear rules for ownership, allocation, and cleanup.
A useful principle is: whoever allocates memory should free it. Avoid allocating in C and freeing in Rust, or the other way around, unless the boundary is designed very carefully. Unsafe code is expected in mixed C, C++, and Rust codebases. That does not make the migration wrong.
It means unsafe code needs to be treated as an important design surface, not as glue code nobody reviews. A lot of migration work is about making behavior that already exists in C or C++ visible and correct in the eyes of the Rust compiler. That can feel like hard work, but it is essential. The point of moving to Rust is to benefit from static analysis, and the code has to be structured in a way that lets those tools help.
What to do before you start migrating
A C++ to Rust migration is not just a rewrite. It is a long-term engineering project that affects the build system, release process, testing strategy, and the people who will maintain the code afterward. That’s why the safest migrations are usually the ones that build confidence step by step. Start small, solve the integration problems early, keep the Rust FFI boundary understandable, and make sure the team learns enough Rust to own the new code.
The practical takeaway is simple: C++ to Rust migration is not about replacing every line of code as quickly as possible. It is about moving the right parts of the system to Rust in a way that reduces risk, preserves knowledge, and keeps the product moving forward.
Trump says ‘complete disarmament’ of Hamas agreed in Gaza but Israel yet to accept
Feed:
World news | The Guardian
(https://www.theguardian.com/world/rss)
Link:
https://www.theguardian.com/world/2026/jul/31/trump-hamas-disarmament-agreement-gaza-board-of-peace
Published: 2026-07-31 14:09:46
|
Created: 2026-07-31 01:13:00
US president hails breakthrough but Israeli far-right minister says ‘only solution’ is ‘encouraging emigration and destroying Hamas’
Donald Trump has declared a breakthrough in negotiations over the disarmament of Hamas in Gaza and the withdrawal of Israeli forces, issues that have so far stalled the implementation of last October’s ceasefire, but Israel has yet to respond officially to the plan and government officials have voiced scepticism over the deal.
Announcing the agreement in a social media post on Thursday night, Trump said it involved the “complete disarmament” of Hamas and other armed groups in Gaza and was “a monumental step toward ending the fighting”.
Continue reading...Best Ethernet Switches: Fast, Reliable, and Secure
Feed:
WIRED
(https://www.wired.com/feed/rss)
Published: 2026-07-29 10:30:00
|
Created: 2026-07-31 01:13:00
If your router is short on ports, you can add more with one of the best Ethernet switches. These are my top picks from what I’ve tested.
show more
Critical Security Issue Affecting TeamCity On-Premises (CVE-2026-63077) – Update to 2025.11.7 or 2026.1.3 Now
Feed:
The JetBrains Blog
(https://blog.jetbrains.com/feed/)
Published: 2026-07-27 14:09:14
|
Created: 2026-07-31 01:13:00
Summary
- A critical security vulnerability has been identified in TeamCity On-Premises and assigned the Common Vulnerabilities and Exposures (CVE) identifier CVE-2026-63077.
- If exploited, this vulnerability may allow an unauthenticated attacker with HTTP(S) access to a TeamCity server to bypass authentication checks and execute arbitrary operating system commands.
- This vulnerability affects all TeamCity On-Premises versions.
- The issue has been fixed in versions 2025.11.7 and 2026.1.3.
- We strongly recommend that all users update their servers to one of the above versions.
- For those who are unable to do so, we have released a security patch plugin.
- TeamCity Cloud customers are not required to take any action.
Details
A critical security vulnerability has been identified in TeamCity On-Premises. If exploited, this flaw may enable an unauthenticated attacker with HTTP(S) access to a TeamCity server to bypass authentication checks and execute arbitrary operating system commands with the privileges of the TeamCity server process.
All versions of TeamCity On-Premises are affected. TeamCity Cloud customers are not required to take any action, as the necessary measures have already been applied. We have verified that there is no evidence of TeamCity Cloud environments being exploited through this vulnerability.
This unauthenticated remote code execution vulnerability was reported to us privately on July 10, 2026, by Antoni Tremblay in accordance with our coordinated disclosure policy.
This vulnerability has been assigned the Common Vulnerabilities and Exposures (CVE) identifier CVE-2026-63077.
A fix for this vulnerability has been introduced in versions 2025.11.7 and 2026.1.3. We have also released a security patch plugin for 2017.1+ so that customers who are unable to upgrade can still patch their environments.
Mitigation option 1: Update your server to 2025.11.7 or 2026.1.3
To update your TeamCity server, download and install the latest patched version (2025.11.7 or 2026.1.3) or use the automatic update option within TeamCity. These versions include a fix for CVE-2026-63077.
Mitigation option 2: Apply the security patch plugin
If you are unable to update your server to version 2025.11.7 or 2026.1.3, we have also released a security patch plugin that can be installed on TeamCity 2017.1+ and will patch the specific vulnerability described above.
To get the security patch plugin:
- Download and install it manually.
- For TeamCity 2024.03 and newer, TeamCity automatically downloads available security patch plugins and notifies administrators (if notifications are configured). You can review and apply pending security patches from Administration | Updates, under Available security updates.
For TeamCity 2017.1 to 2018.1, a server restart is required after installing the security patch plugin. Starting from TeamCity 2018.2, you can enable the plugin without restarting the TeamCity server.
See the TeamCity plugin installation instructions for more information.
Important: The security patch plugin will address only the vulnerability described above (CVE-2026-63077). We always recommend upgrading your server to the latest version to benefit from many other security updates.
Best practices
As a longer-term security best practice for internet-facing TeamCity servers (those accessible to external users who can reach the TeamCity login screen), consider requiring VPN connections or implementing an additional security layer to help prevent unauthorized access. Even exposing the TeamCity login screen or REST API can provide attackers with potential entry points to exploit newly disclosed vulnerabilities.
Technical details
This vulnerability affects TeamCity servers that are reachable over HTTP(S).
Exploitation of this vulnerability does not require authentication. An unauthenticated attacker could exploit the vulnerability via the TeamCity agent polling protocol to bypass authentication checks and execute arbitrary operating system commands with the privileges of the TeamCity server process.
Depending on the privileges granted to the TeamCity server process, a successful attack could expose TeamCity data, configurations, and stored credentials, modify server state, and potentially compromise the integrity of build artifacts and downstream CI/CD pipelines.
At the time of publishing this advisory, we are not aware of any active exploitation of this vulnerability.
As a general best practice, we strongly recommend limiting network access to TeamCity servers to trusted networks wherever possible. We also recommend running the TeamCity server with the minimum operating system privileges required for normal operation.
TeamCity servers should also run on dedicated hosts separate from build agents, as described in our documentation.
Support
If you have any questions about this issue or encounter problems updating your server or installing the security patch plugin, please contact the TeamCity Support team by submitting a ticket.
Apple Upgrade Isn’t the Best Way to Buy an iPhone
Feed:
WIRED
(https://www.wired.com/feed/rss)
Published: 2026-07-29 10:45:00
|
Created: 2026-07-31 01:13:00
With Apple Upgrade, the company is making it easier to pay for its products in monthly installments. Critics call it the “financialization of the affordability crisis.”
show more
Iraq says it had ‘no prior knowledge’ of US-Saudi attacks – as it happened
Feed:
World news | The Guardian
(https://www.theguardian.com/world/rss)
Published: 2026-07-31 05:47:32
|
Created: 2026-07-31 01:13:00
This blog is now closed – our live coverage of the Middle East continues here
A liquefied natural gas tanker controlled by QatarEnergy exited the strait of Hormuz overnight – the first such vessel visible on ship-tracking data to leave the waterway since 11 July, data from analytics firms showed on Thursday.
The Al Areesh tanker, which loaded a cargo at Qatar’s Ras Laffan terminal around 4-6 July, sailed out of the strait overnight on 29 July, according to Kpler and LSEG data.
Continue reading...Why Rwandans are warming to dogs
Feed:
Latest Updates
(https://www.economist.com/latest/rss.xml)
Published: 2026-07-30 13:02:21
|
Created: 2026-07-31 01:13:00
Shunned after the genocide, they have become a status symbol
show more
‘It was a big shock’: new border rules left couple stuck in Kraków after living in UK for 80 years
Feed:
World news | The Guardian
(https://www.theguardian.com/world/rss)
Link:
https://www.theguardian.com/politics/2026/jul/30/how-couple-lived-in-uk-80-years-got-stuck-in-krakow
Published: 2026-07-30 16:59:20
|
Created: 2026-07-31 01:13:00
Maria and Czeslaw Krupa, who arrived as children of displaced Polish veterans, told they have no post-Brexit rights to return home to Bury
Two Polish citizens who have lived in the UK for nearly 80 years after their parents fled the second world war have spoken of their terrifying experience after being told they did not have post-Brexit rights to return to the UK.
In May, while visiting Poland, they learned that although they had been welcomed as refugees after the war, they now needed special post-Brexit paperwork to return to their home in Bury, Greater Manchester.
Continue reading...Mac Mini Availability: Long Waits and Higher Prices
Feed:
WIRED
(https://www.wired.com/feed/rss)
Published: 2026-07-29 11:00:00
|
Created: 2026-07-31 01:13:00
Thanks to the surge in local AI processing and the ongoing memory shortage, it’s incredibly difficult to buy a Mac Mini.
show more
TeamCity 2026.1.3 and 2025.11.7 Are Now Available
Feed:
The JetBrains Blog
(https://blog.jetbrains.com/feed/)
Published: 2026-07-27 14:17:02
|
Created: 2026-07-31 01:13:00
We’re rolling out new maintenance updates for TeamCity On-Premises 2026.1 and 2025.11. Both releases are primarily focused on security, addressing more than 20 security vulnerabilities each (including a critical CVE-2026-63077 vulnerability that allows attackers to bypass authentication checks and execute arbitrary operating system commands with the privileges of the TeamCity server process).
In addition, 2026.1.3 resolves several functional issues, including:
- Incorrect or inconsistent test results when running test assemblies in parallel;
- Perforce child stream changes not being detected, causing commit hooks to match no VCS root instances.
Because these updates contain a significant number of security fixes, we strongly recommend upgrading as soon as possible.
See TeamCity 2026.1.3 Release Notes and TeamCity 2025.11.7 Release Notes for the complete list of resolved issues.
Why update?
Staying up to date with minor releases ensures your TeamCity instance benefits from the following:
- Performance improvements.
- Better compatibility with integrations.
- Faster, more stable builds.
- Enhanced security for your workflows.
Compatibility
TeamCity 2026.1.3 shares the same data format as all 2026.1.x releases. You can upgrade or downgrade within this series without the need for backup and restoration.
How to upgrade
- Use the automatic update feature in your current TeamCity version.
- Download the latest version directly from the JetBrains website.
- Pull the updated TeamCity Docker image.
Need help?
Thank you for reporting issues and providing feedback! If you have questions or run into any problems, please let us know via the TeamCity Forum or Issue Tracker.
Happy building!
Saudi Arabia's dilemma as it tries to stay out of US-Iran war
Feed:
BBC News
(http://feeds.bbci.co.uk/news/world/rss.xml)
Published: 2026-07-29 18:41:31
|
Created: 2026-07-31 01:13:00
The kingdom faces a choice of whether to keep hitting back as a deterrent or to try to de-escalate the situation.
show more
Canada turns to Europe for its security
Feed:
Latest Updates
(https://www.economist.com/latest/rss.xml)
Published: 2026-07-30 13:02:21
|
Created: 2026-07-31 01:13:00
Donald Trump’s capriciousness has pushed Canada’s military spending towards Europe
show more
The kindness of strangers: When Mum was hospitalised on a family holiday, our hotel’s owners were heaven-sent
Feed:
The Guardian
(https://www.theguardian.com/international/rss)
Published: 2026-07-26 15:00:15
|
Created: 2026-07-31 01:13:00
I was just 10 at the time but my siblings and I will never forget the sense of safety, comfort and warmth they offered
Read more in the kindness of strangers series
We were doing the groceries when a blood vessel burst in my mother’s brain. I was 10 years old and on a family holiday to France that very suddenly changed its tenor. In the following weeks Mum went through brain surgery, suffered a stroke and was placed in intensive care.
We had been staying in a gîte but moved to a small hotel closer to the hospital. It was a terrifying and stressful time, even as a young kid who knew things were serious – but didn’t understand quite how serious.
Continue reading...What to Know About the Hunger Strike and Protests at a New Jersey ICE Facility
Feed:
TIME
(https://time.com/feed/)
Published: 2026-06-01 20:53:25
|
Created: 2026-07-31 01:13:00
A detention facility in New Jersey has become the latest flashpoint over the Trump Administration’s immigration agenda, as Immigration and Customs Enforcement officials clashed with protesters denouncing alleged inhumane conditions detainees face inside.
Federal agents fired pepper balls and mace at protesters outside Delaney Hall, a privately-run immigration facility in Newark, on Monday. CBS News reported that ICE agents in riot gear arrived late Monday afternoon to remove protesters blocking the facility entrance. Among those caught in the clashes was Sen. Andy Kim (D, N.J.), who had been trying to defuse the chaos.
“What we saw here is unfortunately just what we see all over the country,” Kim told local news outlet NJ.com after the incident. “It’s sad, it’s a sad day.”
The Department of Homeland Security said in a post on X late Monday that “rioters” blocked law enforcement from exiting the facility, and federal agents “used the minimum amount of force necessary to protect themselves, the public, and federal property,” adding that the pepper balls did not strike anyone directly.
The clashes at Delaney Hall are an apparent culmination of monthslong accusations about the facility’s subpar conditions from detainees, their relatives, and local officials. But Delaney Hall is just one of many immigration detention centers reportedly operating below standard as significantly more migrants have been detained under President Donald Trump’s Administration. Rights groups have raised concerns over rising deaths in these immigration centers, and politicians have called for increased oversight of how these facilities are being run.
Here’s what to know about the situation in the New Jersey facility.
Detainees on hunger strike
On Friday, some 300 detainees launched a hunger strike inside Delaney Hall, a 1,000-bed facility operated by GEO Group, one of ICE’s biggest contractors for building and managing detention centers.
According to the New Jersey Monitor, detainees shared with their loved ones outside, via calls and video chats, how they are being mistreated inside Delaney Hall. These include allegedly finding live worms in their meals and crowding in non-air-conditioned rooms.
The detainees also claimed instances of judges allegedly snubbing their cases, or bonds being denied, to pressure them to self-deport. The strikers are calling for the release of innocent detainees and for immigration judges to attend to their cases.
But the New Jersey Monitor reported that calls from inside were later cut, with one activist telling the news outlet that it was “punishment and retaliation because of the ongoing organizing going on inside.”
The situation in Delaney Hall caught the attention of state and federal Democratic officials, who have panned the alleged mistreatment of detainees and demanded that the facility be shut down.
Sen. Kim and U.S. Rep. Rob Menendez visited the facility on Saturday, and, in several posts on X, Kim outlined what he found inside, including a pregnant woman allegedly denied full OB-GYN support, another who says she had a miscarriage inside the facility, and individuals who were arrested at scheduled interviews for green cards, among others.
It also invited a larger crowd, with Gothamist estimating that more than 100 people gathered outside the facility at one point.
Gothamist reported that protests escalated outside Delaney Hall’s gates from Sunday afternoon until the early hours of Monday after word spread that ICE had attempted to move a detainee who was a key organizer of the strike.
Gov. Mikie Sherrill, another Democrat, also went to the complex on Monday morning but was denied access, which she said raised “even more questions about what [ICE] are trying to hide from public view.”
DHS refutes claims of subpar conditions
DHS, in a Monday press release, denied allegations of poor conditions inside Delaney Hall and accused New Jersey politicians of “spreading smears” about ICE and the facility.
The department claimed that all detainees are given three meals daily—evaluated by certified dietitians—as well as clean water, clothes, bedding, and toiletries. It also claimed detainees could access phones and communicate with family members and lawyers and that medical, dental, and mental health services, including 24-hour emergency care, are available to those in ICE custody.
“In fact, ICE has higher detention standards than most U.S. prisons that hold actual U.S. citizens,” DHS added.
Homeland Security Secretary Markwayne Mullin on Monday accused New Jersey’s “sanctuary politicians” on social media of staging a “political stunt,” adding that “there is NO hunger strike at Delaney Hall,” and that “there are no subprime conditions.” (Per ICE policy, a detainee observed to have not eaten for 72 hours is considered on a hunger strike and should be referred to medical authorities.)
TIME has reached out to GEO Group for comment on the specific allegations from detainees. A spokesperson told independent news outlet TheCity that they were “proud of the role our company has played for 40 years to support the law enforcement mission” of ICE, highlighting detainees having “around-the-clock access to medical care, in-person and virtual legal and family visitation, general and legal library access, translation services, dietician-approved meals.”
Delaney Hall’s history of issues
The facility in Newark has been a lightning rod of controversy ever since GEO Group announced in February 2025 that it secured a 15-year contract with ICE to reopen the facility and establish a federal immigration processing center there, which GEO Group estimated to be valued at $1 billion. Court documents show that the facility opened in 2000 and that, from 2011 through its closure in 2017, ICE previously housed up to 450 immigration detainees at a time there.
In April 2025, a month before Delaney Hall began accepting new detainees again, the city of Newark sued GEO Group for lacking the proper city permits. At the time, GEO Group accused Newark Mayor Ras Baraka, also a Democrat, of politicizing the issue. A federal judge ordered the city and the operator to try to resolve differences, according to a May 22 report from the Jersey Vindicator.
In May 2025, Baraka was arrested outside the jail and charged with trespassing, though the charge was later dropped. U.S. Rep. LaMonica McIver, another New Jersey Democrat, was also charged with assaulting officers when she intervened during Baraka’s arrest. She has denounced the charges.
In June 2025, four detainees escaped from Delaney Hall after dozens of others inside the facility mounted an uprising in apparent revolt against detention conditions. The four were eventually apprehended.
Before the strike, detainees in the facility penned letters pleading for help from officials and lamenting alleged violations of their rights and lack of due process.
How Filipino immigrants revitalised a small Canadian town
Feed:
Latest Updates
(https://www.economist.com/latest/rss.xml)
Published: 2026-07-30 13:02:21
|
Created: 2026-07-31 01:13:00
And how Mark Carney’s immigration curbs threaten the model
show more
KotlinLLM is Going Open Source
Feed:
The JetBrains Blog
(https://blog.jetbrains.com/feed/)
Published: 2026-07-28 07:50:41
|
Created: 2026-07-31 01:13:00
TL;DR
KotlinLLM is now public. It’s a research prototype for delegating runtime logic to an LLM from Kotlin code. Instead of calling an LLM on every request or running a separate agent, you can write an explicit Kotlin call. Its body is generated Kotlin source code, and that code is updated as your application hits new runtime scenarios.
👉 KotlinConf 2026 talk
What is KotlinLLM?
KotlinLLM is an IntelliJ IDEA plugin for Kotlin/JVM projects. It adds a language feature we call Smart macros. A Smart macro is a regular Kotlin function call whose body is generated Kotlin code. The public API has the following two Smart macros:
asLlm<F, T>(from, hint)converts an input of type F into a typed value T (data class, enum, list, or primitive). Use it to parse unstructured or semi-structured data into typed Kotlin values at runtime.mockLlm<T>()generates a stateful implementation of an interface T. Its behavior depends on which methods are called on it, so it works as a test double that you don’t have to write by hand.
// One level of abstraction higher: describe intent, let KotlinLLM fill in the logic.
val issuesApiUrl: String = asLlm(repoInput, hint = "GitHub API URL: get all issues, including closed")
val issues: List<Issue> = asLlm(response, hint = "Return all beginner-friendly issues for this repository")
The behavior comes from actual runtime usage rather than being fully specified before the program runs. The call site stays compact and explicit: a clear, keyword-like API over generated code.
The problem it solves
In software engineering, LLMs are during development, i.e. code completion, code generation, and program comprehension. Using an LLM at the runtime of a compiled application is less common, and the existing options have clear trade-offs:
- Direct runtime delegation (calling the model on every invocation) is slow, non-deterministic, and costly. It also makes the application depend on an LLM service at runtime.
- External agent workflows keep the generated logic outside the codebase, where it’s harder to review, test, and ship.
- Most prior work (e.g. byLLM, nightjar, Healer) targets interpreted languages like Python, not a compiled, statically typed language like Kotlin.
KotlinLLM is built around three properties:
- Explicit – the call site shows that a feature is LLM-backed, so it’s visible in code review.
- Persistent – generated behavior is saved as an ordinary Kotlin source, not kept only in the runtime session. It can be committed, reviewed, tested, and distributed like any other code.
- Portable – once generated, the code runs as plain Kotlin without the plugin. For scenarios that are already covered, there’s no further LLM call, so no added latency or cost, and the result is reproducible.
Does it actually work?
We tested the approach on two Kotlin/JVM projects:
- An adapted Spring Petclinic Kotlin – 18
asLlmcall sites, 24/24 application scenarios completed after Smart macro evolution, with a 100% hot-reload success rate and compilation/redefinition adding ~1% of total runtime overhead. - A synthetic “GitHub Beginner Issue Radar” – parsing real GitHub issue data across 20 repositories (30k+ issues), reaching ~0.89 recall on ground-truth beginner labels.
These results show that persistent runtime evolution for compiled Kotlin is feasible. The evaluation also documents the current limits.
We’re making it public
KotlinLLM is open source under the Apache License 2.0. The repository contains:
- The IntelliJ plugin prototype and the stable Smart macro API.
- Runnable example projects (GitHub Issue Radar, an adapted Petclinic), including committed generated sources, so you can inspect what the LLM produced and run it as ordinary Kotlin.
- The KotlinConf2026 talk recording and the theoretical write-up with the full design rationale and evaluation.
Try it and tell us what you think
KotlinLLM is a research prototype, so feedback is useful at this stage. A few ways to help:
- Start and explore the repo
- Try it on your own Kotlin/JVM project. Add the
KotlinLLM.ktAPI file, launch with the Run with KotlinLLM executor, and let the Smart macros evolve. Setup steps are in the README. - Open issues for anything you run into: rough edges, unexpected LLM behavior, missing cases, or behavior you’d expect to be different.
- Send PRs with use cases. Real scenarios where
asLlm/mockLlmwork well – or break – are the most useful. New examples, target types, and agent tools are all welcome.
If you find a place where runtime logic delegation fits your code, open an issue. If you build something with it, send a PR.
Russia accused of violating Polish airspace after missile explosion near village
Feed:
World news | The Guardian
(https://www.theguardian.com/world/rss)
Published: 2026-07-30 17:22:31
|
Created: 2026-07-31 01:13:00
Polish PM visits scene of crater thought to have occurred during deadly wave of attacks on Ukraine
Russia has been accused of violating Polish airspace, after a missile exploded in a field in the east of the country, triggering Nato air defences, in the midst of a massive air raid that killed 13 people in neighbouring Ukraine.
Polish authorities said that the explosion near the village of Tarnawa-Kolonia, close to Lublin, had created a 10-metre-wide crater. Residents of Tarnawa-Kolonia reported hearing an explosion at about 4am that shook the windows of their homes, police said.
Continue reading...China bets that Donald Trump won’t mind it bullying American allies
Feed:
Latest Updates
(https://www.economist.com/latest/rss.xml)
Published: 2026-07-30 13:02:21
|
Created: 2026-07-31 01:12:59
It has stepped up its abuse of Australia, the Philippines and Japan
show more
The State of CI/CD 2026 Survey Is Now Open
Feed:
The JetBrains Blog
(https://blog.jetbrains.com/feed/)
Published: 2026-07-28 10:12:25
|
Created: 2026-07-31 01:12:59

CI/CD is changing rapidly. Or is it?..
AI-assisted development is increasing the volume of code being written, software systems are becoming more distributed, and engineering teams are continuously rethinking how they build, test, and ship applications.
At the same time, organizations are modernizing their CI/CD platforms, adopting new workflows, and experimenting with AI in their delivery pipelines.
But what does CI/CD actually look like in 2026?
To answer that question, we’re launching the JetBrains State of CI/CD 2026 Survey. Every year, hundreds of software developers, DevOps engineers, platform engineers, and engineering leaders share how they build and deliver software, which CI/CD tools they rely on, and where they see the industry heading.
If you’re interested, here’s a link to the 2025 edition.
This year’s survey explores topics such as:
- The most widely used CI/CD platforms in 2026
- How AI is changing software delivery workflows
- Why organizations are modernizing their CI/CD infrastructure
- The biggest challenges facing DevOps and platform teams
- Emerging trends in automation, testing, and deployment
Whether you’re running production pipelines every day or simply interested in the future of software delivery, we’d love to hear your perspective.
👉 Take the survey: https://jb.gg/uv2e9x
As a thank you, you’ll be entered into a drawing to win either a one-year JetBrains All Products Pack subscription or one of several USD 100 Amazon Gift Cards.
The survey takes only a few minutes to complete, and we’ll publish the results later this year on the TeamCity Blog.
We look forward to hearing from you!
Russian missile destroys US firm’s Kyiv drone factory
Feed:
World news | The Guardian
(https://www.theguardian.com/world/rss)
Link:
https://www.theguardian.com/world/2026/jul/30/us-firm-drone-factory-terminal-autonomy-ukraine-russia
Published: 2026-07-30 17:40:29
|
Created: 2026-07-31 01:12:59
Strike on Terminal Autonomy plant appears to be first time in the war that Moscow has targeted a US company
A drone factory in Kyiv destroyed by a Russian ballistic missile on Friday was owned by a US corporation registered in Delaware, in what appears to be the first time Moscow has targeted a US company in the conflict.
Terminal Autonomy makes precision “deep-strike” drones with guidance systems that are resistant to Russian jamming signals, according to a person familiar with the company.
Continue reading...Ponytail Skill for Claude Code: Does It Really Cut Agent Code by 54%?
Feed:
The JetBrains Blog
(https://blog.jetbrains.com/feed/)
Published: 2026-07-28 13:30:08
|
Created: 2026-07-31 01:12:59
Part 3 of a series where we take public “token saver” add-ons for coding agents and run the same paired A/B benchmark against each of them. Part 1 was the caveman skill (advertised −65%, measured −8.5%). Part 2 was rtk (advertised −60–90%, measured +7.6%).
We ran 80 paired tasks to test the ponytail skill for Claude Code. Advertised: −54% code, -22% tokens, -20% cost, -27% time. Measured: −15% code, −10.3% cost and -11% time. Here’s what actually happened.
Real savings, although roughly a quarter to a half of what is advertised, it is the first tool in this series with a statistically solid cost-saving signal. We found no quality difference, though ~80 pairs can only rule out large ones. The catch: the code cut only shows up where there was room to over-build.
Why we ran this
Ponytail skill is designed to make AI agents write less code. Its core premise: a senior developer who has seen everything replaces your fifty lines with one. Ask for a date picker and instead of installing flatpickr and writing a wrapper component, it writes <input type="date"> and moves on.
Mechanically it is a ladder the model climbs before writing anything. Does this need to exist at all? Is it already in the codebase? Does the standard library do it? A native platform feature? An installed dependency? Can it be one line? Only then: write the minimum that works. The ladder runs after understanding the problem, not instead of it, and validation, error handling, security and accessibility are explicitly off the chopping block.
Here is what that looks like in practice, from our own run. Both agents were asked to export a three.js scene to a Blender-ready OBJ file; both produced a file the verifier accepted. Both wrote the same fiddly loop to expand instanced meshes, because three.js’s OBJExporter cannot handle them. The difference is everything around that loop. To rotate the scene into Blender’s orientation and write it out, the plain agent builds a wrapper object to hold the rotation and names every intermediate step:
// no skill — 10 statements to rotate the scene and write the file
const exportRoot = new THREE.Group();
exportRoot.name = 'blender_export_root';
exportRoot.rotation.x = -Math.PI / 2;
exportRoot.add(root);
exportRoot.updateMatrixWorld(true);

const exporter = new OBJExporter();
const objString = exporter.parse(exportRoot);

const outputPath = '/root/output/object.obj';
fs.mkdirSync(path.dirname(outputPath), { recursive: true });
fs.writeFileSync(outputPath, objString);


// ponytail — the same job, 5 statements
root.rotation.x = -Math.PI / 2;
root.updateMatrixWorld(true);

const obj = new OBJExporter().parse(root);
fs.mkdirSync('/root/output', { recursive: true });
fs.writeFileSync('/root/output/object.obj', obj);
Nothing was sacrificed there. Ponytail rotated the object it already had instead of building a parent to rotate it for it, and skipped an import while it was at it. Ten statements became five, both files exported the same geometry, and both scored 1.0. That is the effect working exactly as advertised — on one file, on one task.
The headline claim is −54% code, plus −22% tokens, −20% cost and
−27% time. What made this one worth testing is that the claim is unusually well
documented. The authors rebuilt their benchmark in response to a critique
(issue #126) that
their original numbers came from a chatty baseline, and they publish the honest version:
a real headless Claude Code session editing a real FastAPI + React repo, scored on the
git diff it leaves behind. They even document a contamination bug they found
in their own harness, where a SessionStart hook was firing on every arm and
secretly running ponytail in the baseline.
That is more methodological candour than most tools in this space manage. So the question here is whether the effect survives a benchmark the authors did not choose, on a stronger model, with verifier-scored quality.
Setup
| Harness | Harbor 0.18 — Docker sandboxes, task verifiers, paired runs |
|---|---|
| Agent | Claude Code 2.1.201, headless, bypassPermissions, pinned in both arms |
| Model | claude-sonnet-5 at medium reasoning effort |
| Benchmark | SkillsBench, 80 paired tasks, auto-graded 0–1 with partial credit |
| Arm A | stock Claude Code |
| Arm B | ponytail v4.8.4: skill installed and its ruleset injected, byte-identical to the ruleset text its own SessionStart hook generates (the hook’s other first-run output is not reproduced). A close emulation of the shipped plugin’s full mode, with three documented differences (no first-run statusline nudge, no subagent re-injection, ruleset appended after the task rather than before it) |
| Volume | 3 paired stages (10-task smoke, same 10 at k=3, full 80), plus self-activation and wiring checks — 251 billed agent trials in the complete evaluation program, USD 246.09. A few SkillsBench tasks are excluded: one that cannot run in a local sandbox, and a handful that fail identically in both arms on our hardware |
One detail matters more than it looks. We generated arm B’s injected text by calling
ponytail’s own hooks/ponytail-instructions.js rather than writing a summary
of it, so the ruleset the model saw is the skill’s own text rather than our paraphrase of
it. That covers the ruleset the hook generates, not every side-effect the hook has on a
real first run. Every
with-ponytail trial is audited afterwards to confirm the ruleset actually reached the
model; every baseline trial is audited to confirm it did not. That check is the direct
descendant of the contamination bug ponytail found in its own benchmark, and it came
back clean: 100% of treatment trials, 0% of baselines.
Finding 1 — Does ponytail skill self-activate in Claude Code?
Before the paid runs we tested the obvious install path: drop the skill in and let Claude Code decide when to use it. Ponytail’s description invites exactly that, telling the model to use it on “ANY coding task: writing, adding, refactoring, fixing, reviewing, or designing code.”
Across all ten sessions it self-activated zero times. Not rarely. Never. The skill sat installed and visible and the model did not once reach for it.
This is not a bug in ponytail, and it is why the tool ships as a plugin with a
SessionStart hook that injects the ruleset whether you ask or not. But it
does mean the install method decides whether you get anything at all. Copy the
SKILL.md into a skills folder and you will very likely measure nothing.
Every number below comes from the arm where the ruleset is actually injected.
Finding 2 — the observed code cut is a third of the advertised size
Across 80 paired tasks a typical task shed 15.4% of the code the agent wrote; in total, 10,205 lines became 8,756. That is a substantial observed reduction. At p=0.088, however, it is the softest of our headline numbers. It is also nowhere near 54%.
Two things to say about the gap, both fair to the tool. First, their −54% is a mean across twelve hand-picked feature tickets; ours is a median across 80 tasks nobody chose for this purpose. Means and medians on skewed data are different animals, and their own writeup is explicit that the figure “reaches 94% where an agent over-builds and is near zero where the code is already minimal.”
Second, and this is the more interesting half: our own data points the same way.
Finding 3 — the saving concentrates where there was room to over-build
Split the tasks by how much code the baseline wrote. Ponytail cannot pick its own bucket that way, since the plain agent decides it. Worth saying plainly though: we chose these thresholds after seeing the data, and grouping by the baseline’s own output can stretch a gradient like this on its own. Read the chart as a strong hint about where the effect lives, not as a measured law.
On big builds the cut reaches −31%. On tasks where the plain agent already wrote almost nothing, the typical task moved by zero — though the totals in that group actually rose, 104 lines to 910, and that gap is where the run’s one real surprise turned up.
On seven tasks our counter recorded zero lines for the plain agent and 51 to 230 for ponytail. Reading the transcripts, that gap is mostly about where the code lived rather than how much of it there was. The plain agent piped its solution straight into a Python interpreter as a heredoc, which produced the deliverable and left no script behind. Ponytail wrote the same kind of logic to a file. Our counter treats a saved file as code and an inline heredoc as scratch, so one arm got charged for it and the other did not.
To be clear about what those files are: all seven are ordinary work scripts —
edit.py, diff.py, build_model.py — not tests. So this
is not ponytail’s “leave one runnable check behind” rule showing up; it simply saved its
solution to disk where the plain agent piped the equivalent through an interpreter. We
cannot say ponytail wrote more code on those tasks, only that more of its code was
persisted.
Does that bias the headline? Slightly, and in both directions. Ponytail alone persisted code on 7 tasks (761 lines); the plain agent alone did on 4 (567 lines). Net, about 190 lines out of 10,205 land against ponytail — under 2%, and too small to lean on either way. We are not claiming the −15.4% is conservative because of it.
Finding 4 — the bill drops, and this time the signal is solid
A typical task cost 10.3% less with ponytail installed: p=0.004 across 80 pairs, cheaper on 46 tasks and dearer on 34. That is the strongest positive cost result in this series so far, and the first that is a solid saving rather than a solid penalty — rtk’s +7.6% was every bit as significant, just pointing the wrong way. Caveman also came out around 10% cheaper once we removed a single pricing-tier outlier, but that was a fragile number resting on one exclusion; this is the first time the cost difference has survived a paired test on a full run.
One honest qualifier, because we would want it applied to a vendor: the median saving is −10.3%, but the spread around it is wide enough that a bootstrap interval on the median just touches zero. The direction is well supported and the per-task test is clear. “Roughly 10% cheaper on this workload” is defensible; “ponytail saves you 10%” is not.
Worth noting what did not move cleanly: the input side. Re-reading its own history fell 8.4% and fresh tokens 3.9%, neither of them significant (p=0.138 and p=0.085). In part 2 we found that an agent’s bill is dominated by that re-reading, which is why a tool compressing command output barely dented it. Ponytail attacks the other side of the ledger, what the model writes, and on this benchmark that is the side the money moved on.
Finding 5 — no quality difference we can detect
The obvious worry about a skill whose whole personality is “write less” is that it gets there by deleting things that mattered. Ponytail claims it never touches validation, error handling, security or accessibility, and reports 100% safety in a separate adversarial tier of its own benchmark.
We cannot speak to that safety claim, and want to be explicit about why: SkillsBench verifiers score whether a task was completed. They are not a security, validation or accessibility suite. Nothing below tests whether ponytail preserves a guard, only whether the work still passes.
Nine tasks scored slightly worse, six slightly better, 65 identical — statistically indistinguishable. That is a null result, not a clean bill of health: this run was never powered to prove equivalence, and the data remain compatible with a small degradation as well as a small improvement. What we can say is that nothing here looks like the obvious failure mode, where writing less quietly stops the tests passing.
One small note on adherence. Ponytail’s ruleset asks the model to mark deliberate
shortcuts with a ponytail: comment naming the ceiling and the upgrade path.
Across 80 trials with the ruleset demonstrably in context, that happened once.
The ladder gets followed; the paperwork does not.
Finding 6 — small samples lied to us, in both directions
Worth showing because it is the trap this whole series exists to avoid. Our ten-task smoke run said ponytail cut code by 3% and made things 9.6% more expensive, with mean task scores collapsing from 0.51 to 0.31. Had we published that, we would have written a very different and completely wrong article.
Verdict
Ponytail works. Across 80 paired tasks, it cut the typical bill by 10.3% and reduced code written by 15%, with no quality difference we could detect. It is the first tool in this series that clearly saved money. If you install it and forget about it, you should be modestly better off.
Do not expect the advertised 54% everywhere. Ponytail’s benchmark uses tasks with obvious over-building traps. Ours did not. In our runs, code fell 31% on larger builds and barely moved on tasks that were already lean. The more over-building your agent does, the more ponytail can cut.
Got a tool that claims to save tokens? Tell us which one and we will run it through the same benchmark.
Methodology notes
- Never trust k=1. Escalation ladder: a free transcript audit, then a 10-task smoke, then the same 10 at k=3, then the full 80. Finding 6 shows what the smoke would have told us.
- Paired analysis only. Per-task comparison between arms; any task that errored in either arm is dropped from both. Sign test for quality, per-task medians plus Wilcoxon for everything else, because one long-context session can bill 25× normal and wreck a mean.
- Endpoints fixed before the paid runs: reward, code written, output
tokens, fresh input tokens, cost, turns, wall-clock. Total tokens was added afterwards,
once we checked which metric ponytail’s own
benchmarks/agentic/run.pyactually advertises. It sums input, cache and output, so comparing our output-only figure against its −22% would have flattered us threefold. - What a null result here does and does not mean. The quality comparison is a significance test, not an equivalence test. “No difference detected” is the honest reading; proving quality is genuinely unchanged would take a non-inferiority design with a pre-declared margin, and — for a 5-point shift in pass rate at 80% power around this benchmark’s ~40% baseline — on the order of several hundred paired tasks per arm rather than 80.
- Adoption instrumented. Every trial audited for whether the ruleset reached the model — 100% in the treatment arm, 0% in the baseline — so “ponytail saved nothing” can never be confused with “ponytail never ran.”
- Measuring code without a workspace diff. Ponytail’s own benchmark
counts
git diffadded lines. Harbor keeps no post-agent workspace, so we reconstruct the equivalent from the agent’s tool calls:Write,Editand shell heredocs redirected into a file, counted as non-blank non-comment lines exactly as ponytail’sbenchmarks/loc.jsdoes. This is cumulative lines emitted, not final implementation size: a line written and later rewritten counts each time. Heredocs piped to an interpreter are throwaway analysis and are excluded. We audited the extractor’s coverage on the run these figures come from:WriteandEditaccount for 95.6% of counted lines (15,632 and 2,496 of 18,961), so the metric is not an artifact of missing where the code went. Two things it cannot see, in both arms equally: files written by a script at runtime, and code written inside a subagent. - Provenance. ponytail pinned at commit
16f2980(v4.8.4, MIT); agent version pinned in both arms; the injected ruleset generated by ponytail’s own hook code, sha256 recorded. Seven of SkillsBench’s 87 tasks are excluded: one that cannot run in a local sandbox at all, and six that fail identically in both arms on our hardware. Exclusions are symmetric — a task is dropped from both arms or neither — and the full list is retained with the evaluation artifacts. - What this cannot tell you. SkillsBench is data, analysis and repair work; it contains few of the front-end over-build traps that produce ponytail’s largest wins. This is a fair test of the cost, speed and quality claims and a conservative test of the code claim. It does not refute their −54% on their own task set.
Chart style borrowed from dither-kit, reimplemented here as a dependency-free inline widget.
Frequently asked questions
Does ponytail skill work with Claude Code?
Yes, but installation method matters. If you copy the SKILL.md into a skills folder and let the model decide when to use it, it will self-activate zero times — we confirmed this across ten sessions. Ponytail is designed to run as a plugin with a SessionStart hook that injects its ruleset automatically. That's the only configuration that produces measurable results.
How much does ponytail skill actually reduce code and token usage?
Across 80 paired tasks, we measured a median −15% reduction in code written and −10.3% reduction in cost. The advertised −54% code reduction is real on tasks with obvious over-building traps; our benchmark skewed toward data and analysis work, which is a more conservative test. On larger builds in our run, code fell 31%.
Does ponytail skill reduce code quality?
We found no statistically significant quality difference across 80 tasks — 65 scored identically, 9 slightly worse, 6 slightly better. This is a null result, not a clean bill of health: the run wasn't powered to prove equivalence. What it rules out is the obvious failure mode where writing less quietly breaks things.
What is the ponytail skill for Claude Code?
Ponytail is an open-source AI Agent skill that constrains the model to write minimal code. Before generating anything, it runs through a ladder of questions: does this need to exist, is it already in the codebase, does the standard library handle it, can it be one line? Validation, error handling, security, and accessibility are explicitly excluded from its minimalism rules.
How does ponytail skill compare to other token-saving skills?
In our series, ponytail is the only tool that produced a statistically significant cost saving. The caveman skill measured −8.5% code against an advertised −65%. RTK produced a +7.6% cost increase. Ponytail delivered −10.3% cost reduction with p=0.004 — the first solid positive result in the series.
Race to extinguish blazes across Europe as fire weather breaks records
Feed:
World news | The Guardian
(https://www.theguardian.com/world/rss)
Published: 2026-07-30 18:16:08
|
Created: 2026-07-31 01:12:59
Figures show hot, dry, windy conditions in EU are 43% more severe than the average over last 20 years
Fire weather in the EU has broken records for severity for this time of year, data shows, as firefighters race to extinguish blazes across the Mediterranean.
Inflamed by carbon pollution, the hot, dry and windy weather across the EU from the start of the year until the end of July has been 43% more severe than the average for the same period over the last two decades, data from the European Forest Fire Information Service (Effis) shows.
Continue reading...Japanese politics is becoming less of a turn-off for the young
Feed:
Latest Updates
(https://www.economist.com/latest/rss.xml)
Published: 2026-07-30 13:02:21
|
Created: 2026-07-31 01:12:59
Social-media-savvy politicians are drawing them in
show more
French riot police used teargas on people trying to board small boat, charity claims
Feed:
World news | The Guardian
(https://www.theguardian.com/world/rss)
Published: 2026-07-30 19:20:16
|
Created: 2026-07-31 01:12:59
CRS officers funded by UK tried to stop boarding of boat, on day four asylum seekers died trying to cross Channel
French riot police funded by UK taxpayers used teargas on asylum seekers in an attempt to stop them from boarding a boat in which three women were later found dead, a charity has claimed.
Footage and photographs seen by the Guardian show CS gas canisters being fired towards groups of people on Plage du Braek near Dunkirk at 4am on Thursday. At 6am, three women were found dead in a boat near the same beach.
Continue reading...Secure Your APIs: OAuth2 and JWT for Beginners
Feed:
The JetBrains Blog
(https://blog.jetbrains.com/feed/)
Published: 2026-07-29 11:28:21
|
Created: 2026-07-31 01:12:59
This tutorial was written by an external contributor.

Mdu Sibisi
Mdu Sibisi is an Oracle-certified software developer and blogger with over ten years of experience working primarily with object-oriented languages. He has been writing about technology for more than eight years, focusing on making complex topics easier to understand. Mdu is passionate about accessible developer education, clean code, and creating content that helps developers learn and grow.
APIs are frequent targets for bad actors since they expose data and functionality. Securing them while maintaining usability is often one of the most challenging and time-consuming parts of API development. OAuth 2.0 and JSON Web Tokens (JWT) help make these processes more manageable and reliable. They allow developers to represent and verify identity and manage access by safely transmitting claims and enabling delegated authorization.
This article discusses these technologies and the most efficient ways you can use them to secure your Spring Boot-built APIs and backends. If you’re interested in a coroutine‑driven solution, a companion tutorial using Ktor is also planned and will be published soon.
OAuth2 and JWT Primer
OAuth2 and JWT(s) aren’t competing technologies. They’re complementary pieces of the puzzle, with one handling the delegation of authorization and the other serving as the compact, verifiable token format that carries secure information.
Authentication vs. Authorization
Authentication verifies identity (who you are), usually through credentials like passwords, tokens, or certificates. JWTs can carry identity information and act like a form of ID once issued. Roles and other claims within a JWT are then used for authorization.
Authorization helps control what a user has access to (what they can do). This includes the scopes or resources that they can “touch” and how those permissions are managed. In a system that uses OAuth2 and JWT, the access badge is bundled into your ID card. OAuth2 oversees and manages this process.
The Role of OAuth2
OAuth2 is a framework for delegated access. Instead of sharing passwords directly, users grant applications a token that represents their permissions. This means that your backend (acting as a Resource Server) doesn’t have to issue tokens. Instead, it trusts and validates the ones coming from the Authorization Server within OAuth2’s framework. This decoupling of duties allows you to simplify your APIs while reducing security risks and ensuring all tokens follow a clear, consistent, centralized policy.
You don’t have to worry about implementing user logins or browser redirects within your API. As far as validation and authorization are concerned, your backend or API’s job is to receive the Bearer Token, authenticate the signature, check expiration, and enforce scopes/roles.
Your API just checks badges; it’s not responsible for printing them. So how do JWTs fit into the equation?
What Is a JWT?
A JWT is a small, web-friendly piece of text (string) that securely transports information between systems. Their compactness makes them easy to pass around in HTTP headers or URLs. Each token uses Base64URL encoding, making them safe to include in query strings or headers.
JWTs are signed (and sometimes encrypted), so that recipients can verify that they weren’t tampered with. They’re also self-contained, carrying details like user ID, roles, or permissions. These elements (especially self-containment and signing) allow for stateless authentication without Session Storage. This means that you don’t need a database or cache to track active sessions. It also encourages fewer lookups and less infrastructure complexity, which reduces your system’s overhead.
JWTs have a very simple, standardized structure made up of three parts, separated by dots:
- The Header contains metadata about the token, such as the type (
JWT) and the signing algorithm (HS256,RS256). - The Payload features the claims, which are statements about the user or system (like user ID, roles, or token expiry).
- The Signature is a cryptographic signature created using the header, payload, and a secret or private key. This ensures the token has not been tampered with.
The basic structure of a JWT looks like this:
xxxxx.yyyyy.zzzzz
A real-world Base64URL-encoded token typically resembles the following:
eyJhbGciOiJIUzI1NiIsInR5cCI6IkpXVCJ9
.eyJzdWIiOiIxMjM0NTY3ODkwIiwibmFtZSI6IkpvaG4gRG9lIiwiaWF0IjoxNTE2MjM5MDIyfQ
.SflKxwRJSMeKKF2QT4fwpMeJf36POk6yJV_adQssw5c
When OAuth2 meets JWT
There are four key roles in OAuth2’s implementation:
- Resource Owner: The entity (usually the user) granting access to the protected resources.
- Client: The application requesting access to the resource on behalf of the resource owner.
- Authorization Server: The server that authenticates the resource owner and issues access tokens to the client.
- Resource Server: The server hosting the protected resources, which accepts and validates tokens.
The Resource Owner grants permission (e.g., you click “Allow” when an app requests access), the Client then requests authorization from the Authorization Server, which issues an access token (JWT) if the Resource Owner approves. The Client uses this access token to access data from the Resource Server.
Note: It’s important to note that JWTs aren’t the only token format that OAuth2 can work with; it’s just the most popular because of its perks. OAuth2 can also work with Opaque Tokens, SAML Tokens, or custom token formats like Microsoft’s reference tokens or Google’s access tokens.
How to Implement OAuth2 and JWT
Imagine you’re building a simple document management system with a Kotlin and Spring-based backend that exposes a REST API. This implementation lets clients upload documents, list them, view specific ones, etc. Some potential endpoints the API can expose include:
GET /documents: Lists all documents.GET /documents/{id}: View a specific document.POST /documents: Upload a new document.
You want to restrict access so that only authenticated users can view or upload documents, but you don’t want to manage passwords in your backend. You also don’t have to maintain sessions or deal with login forms.
Prerequisites
If you want to follow along, you’ll need:
- IntelliJ IDEA
- JDK 17+
- Google Cloud Console
- A basic understanding of Kotlin, Spring Boot, and Spring Security
All the code used in this tutorial is available on GitHub repository.
Initial Application Setup
To start, run IntelliJ IDEA and create a new project (File > New > Project):

Select Spring Boot under the Generators section on the left panel. Give your project a name (like doc-manager), select Kotlin as the Language, Gradle – Kotlin as the Type, 17 as the Java version, Jar as the packaging, and Properties as the configuration. Leave all other properties in their default state and then click Next.
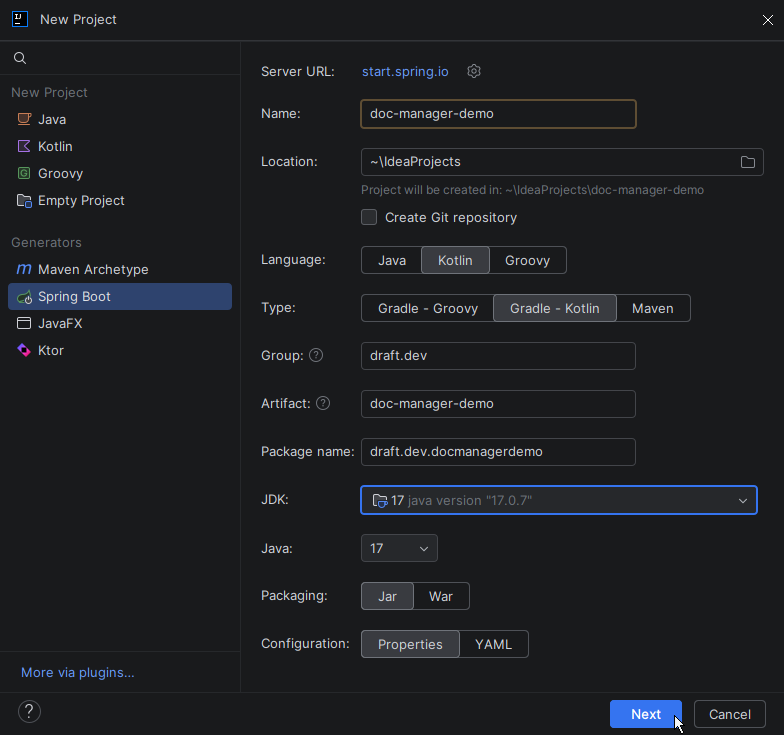
On the next screen, select dependencies for your project. Make sure you’re using the latest stable version of Spring Boot (4.0.3 at the time of writing) and then use the search bar to find and add the following dependencies:
- Spring Security
- OAuth2 Authorization Server
- OAuth2 Resource Server
- Spring Web
Once that’s done, click Create.
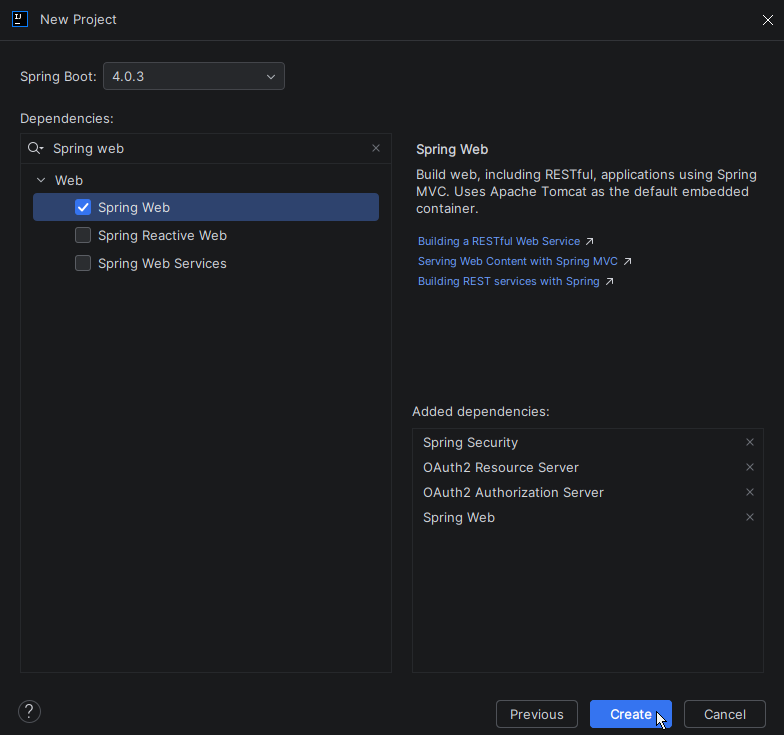
After your project’s done importing and loading, expand your project, scroll down, and find the application.properties file under the resources folder (src > main > resources). Add the following lines to it:
spring.application.name=doc-manager-kotlin-demo

spring.security.oauth2.resourceserver.jwt.public-key-location=classpath:public.pem
In most cases, you’d specify an Authorization Server (issuer-uri) here. But to keep things simple, you won’t be using a real Authorization Server for this part of the implementation (this will come in later). So you need to supply your application with a public key to verify signed tokens. You can generate your own publickey.pem using OpenSSL or use the ones provided in this project’s resources folder. Make sure to save and store the private.pem. You’ll need it for JWT generation.
Configure Your Resource Server
Create a resource controller for your endpoint:
// Insert Your Package Name Here + .controller

import org.springframework.web.bind.annotation.GetMapping
import org.springframework.web.bind.annotation.RequestMapping
import org.springframework.web.bind.annotation.RestController

@RestController
@RequestMapping("/api")
class ResourceController {
    @GetMapping("/fetchDocuments")
    fun fetchDocumentsEndpoint(): String {
        return "Here are your documents"
    }
}
For now, the ResourceController class contains only one endpoint.
Next, create a security configuration for your Resource Server:
// Insert Your Package Name Here + .config

import org.springframework.context.annotation.Bean
import org.springframework.context.annotation.Configuration
import org.springframework.http.HttpMethod
import org.springframework.security.config.annotation.web.builders.HttpSecurity
import org.springframework.security.config.annotation.web.configuration.EnableWebSecurity
import org.springframework.security.config.http.SessionCreationPolicy
import org.springframework.security.web.SecurityFilterChain

@Configuration
@EnableWebSecurity
class OAuth2ResourceServerSecurityConfiguration {

    @Bean
    @Throws(Exception::class)
    fun securityFilterChain(http: HttpSecurity): SecurityFilterChain =
        http
            .httpBasic { it.disable() }
            .formLogin { it.disable() } 	// Disables Spring's default form-based login
            .csrf { it.disable() }
            .authorizeHttpRequests {
                it.requestMatchers(HttpMethod.GET, "/api/fetchDocuments").hasAuthority("SCOPE_read:documents") // Verifies that client has read access
                it.anyRequest().authenticated()
            }
            .oauth2ResourceServer {  // Enables JWT‑based authentication for an OAuth2 Resource Server.
                it.jwt { }
            }
            .sessionManagement { it.sessionCreationPolicy(SessionCreationPolicy.STATELESS) }
            .build()
}
If you’ve worked with Spring Security in Java before, you’ll likely notice how clean the Kotlin DSL looks in comparison. References to OAuth2LoginConfigurer, wrapping lambdas in Customizer, or even annotations like @Throws(Exception::class) aren’t strictly necessary (unless you’re working with a mix of Java and Kotlin). Kotlin’s DSL trims that away and lets you express the rules directly.
Now, generate the JWT using the private key (found in the private.pem). Make sure to encode it using the RS256 and that the claims are set and formatted correctly:
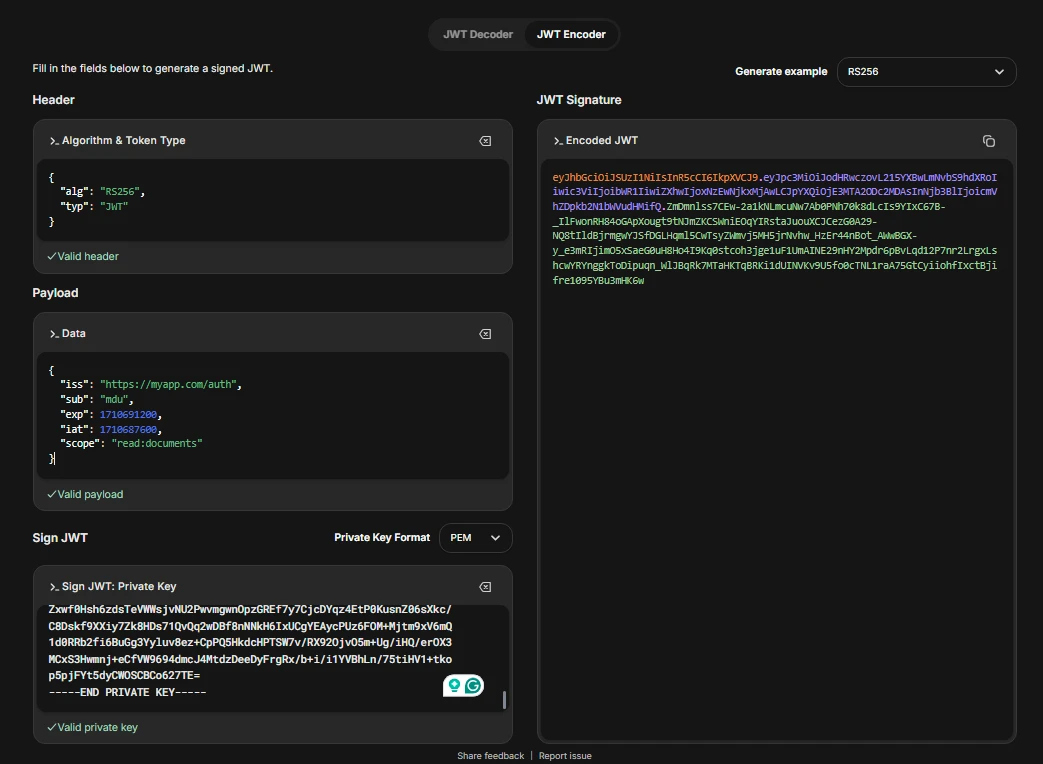
Run your Spring Boot application and then initiate an authenticated request to the /fetchDocuments API endpoint with your generated JWT as the bearer token:
GET http://localhost:8080/api/fetchDocuments
Bearer Token <JWT>
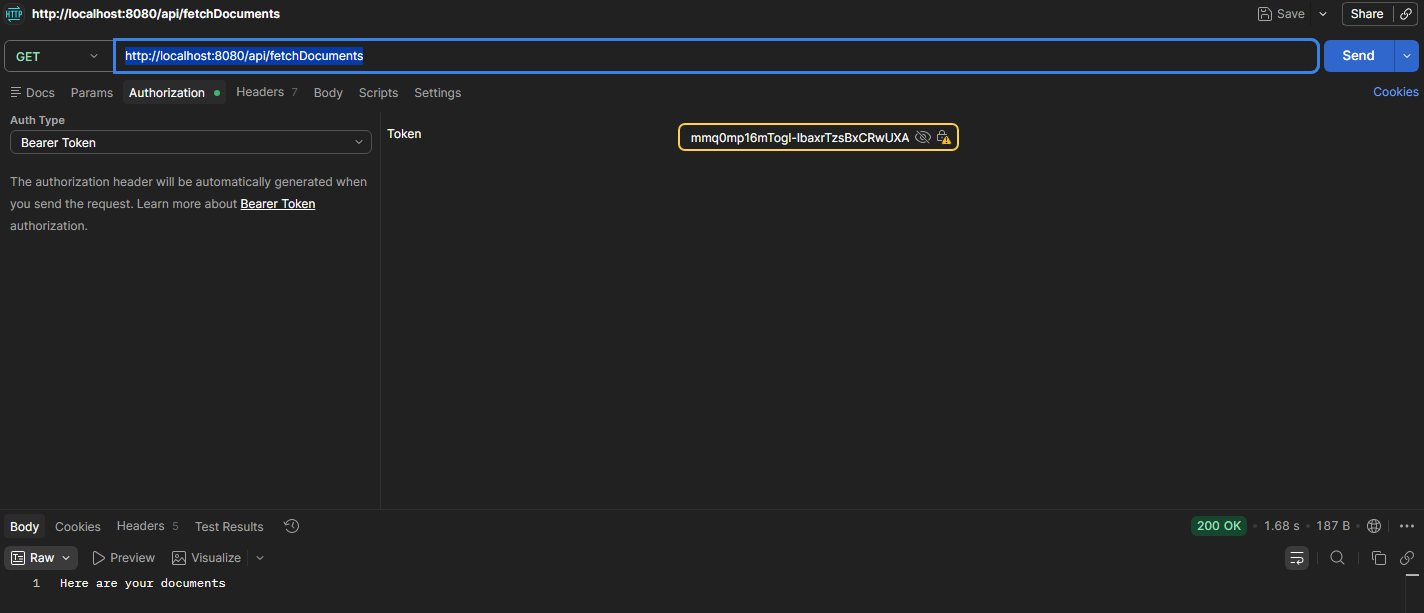
If it works as it should, you should see “Here are your documents” as a response. This implementation enables you to simulate a client sending a request with a Bearer token (JWT). Upon receiving the token, your Resource Server (backend) checks the expiry date and signature using the details in your application’s properties file. It also looks for the read:documents scope before granting access to the fetchDocument endpoint.
Handling Advanced Patterns and Validations
In a document management API (and most complex systems), simple scope checks aren’t enough. They can grant coarse permissions, but they often fail to capture the nuance of real-world access control. To address this, the system must separate token validation (ensuring the JWT is authentic) from business authorization (deciding what actions a user can perform).
Scopes alone can’t enforce ownership or hierarchical rules, and they don’t capture organizational roles. That’s why you need a combination of scope and role-based access, where administrators can access all features, while lower-level users are granted only a few. By layering roles, scopes, and resource checks, the API achieves fine-grained, context-aware authorization that balances security with usability.
Hardcoding security decisions in such systems should be avoided at all costs. Practices like embedding role checks or scope logic directly into controller methods may seem convenient at first, but it introduces significant risks as your system grows. A developer might forget to update one of these hardcoded checks when business requirements change, leaving certain endpoints exposed or inconsistent. Hardcoding also undermines separations of concerns. Security decisions should be modeled in a dedicated layer, not mixed into business logic.
Using Custom Claim Extraction and Spring Security’s PreAuthorize
Like most token formats, JWTs can carry custom claims in their payloads. A JWT with custom claims for roles and permissions would look something like this:
{
  "iss": "https://myapp.com/auth",
  "sub": "mdu",
  "iat": 1773754406,
  "exp": 1773840838,
  "scope": "read:documents",
  "roles": ["admin", "editor"],
  "permissions": ["documents:read:all", "documents:write:own"]
}
Spring handles authority mapping for scopes out of the box and provides a hasRole function. However, roles aren’t automatically extracted from JWTs because there is no universal standard for how identity providers represent them. Scopes are standardized in OAuth2 and OpenID Connect, so Spring can safely map them into authorities. Roles often appear under custom claims and require a custom converter to translate them into Spring’s expected format before they can be used effectively.
Let’s say you want to authenticate and authorize based on roles and scope. Navigate to your security config and add the following function:
@Bean
fun jwtAuthenticationConverter(): JwtAuthenticationConverter {
    val converter = JwtAuthenticationConverter()
    converter.setJwtGrantedAuthoritiesConverter { jwt ->
        val authorities = mutableListOf<GrantedAuthority>()

        // Map scopes
        val scopes = (jwt.claims["scope"] as? String)?.split(" ") ?: emptyList()
        authorities.addAll(scopes.map { SimpleGrantedAuthority("SCOPE_$it") })

        // Map roles
        val roles = jwt.claims["roles"] as? Collection<*> ?: emptyList<Any>()
        authorities.addAll(roles.map { SimpleGrantedAuthority("ROLE_$it") })

        // Map permissions
        val permissions = jwt.claims["permissions"] as? Collection<*> ?: emptyList<Any>()
        authorities.addAll(permissions.map { SimpleGrantedAuthority(it.toString()) })

        authorities
    }
    return converter
}
This changes the behaviour of the JwtAuthenticationConverter so that it no longer relies solely on Spring Security’s default scope mapping. Instead, it explicitly maps both scopes and roles from the JWT into Spring authorities. If you mapped only roles, then Spring Security would ignore the scope claim entirely.
Kotlin ensures the safe extraction of custom claims thanks to its null-safety. For instance, take a look at the scope mapping section of the code. The safe call operator (?.) ensures that if jwt.claims["scope"] is null, the chain stops gracefully instead of throwing a NullPointerException. The safe cast operator (as? String) attempts to convert the value returned from the jwt.claims["scope"] operation into a String from an Any? (could be anything or null). If the safe cast operator fails, it returns null instead of throwing a ClassCastException. This allows for type-safe conversions that won’t interrupt or break your code. The Elvis operator (?:) provides a fallback value when the left-hand side is null. So if the role is missing for whatever reason, the function returns an empty list as a default value.
The tricky part is adding validations for all these claims. If you were checking these claims individually, you could use the hasRole function for roles, and hasAuthority for scopes and permissions. One way to chain these validations together would be to use the access function. Here, you’ll use [Spring’s Method Security](Spring @EnableMethodSecurity Annotation | Baeldung) (@PreAuthorize) because it offers a more fine-grained and cleaner approach.
Return to your Security Config file and place the @EnableMethodSecurity(prePostEnabled = true) above the class definition:
...
import org.springframework.security.config.annotation.method.configuration.EnableMethodSecurity

@Configuration
@EnableWebSecurity
@EnableMethodSecurity(prePostEnabled = true)
class OAuth2ResourceServerSecurityConfiguration {
    class SecurityConfig(
...
You can keep your security filter chain as is for now. Navigate to your resource controller, and add the @PreAuthorize annotation to it:
...
@GetMapping("/fetchDocuments")
@PreAuthorize("hasRole('admin') and hasAuthority('documents:read:all')")
fun fetchDocumentsEndpoint(): String {
    return "Here are your documents"
}
...
Note: You’ll need to import the PreAuthorize annotation for this to work.
This ensures that only admins with read-all permissions can access the fetchDocuments endpoint. You can create more endpoints, like getDocument and deleteDocument to test the combination of your roles and permissions. The @PreAuthorize annotation helps you avoid embedding role checks or scope logic directly inside controller methods (for example, writing if (user.hasRole("admin")) { ... } in the body of a controller). Alternatively, you can perform your role checks in your filter chain and your scope and permission checks on the method level.
Strengthening Token Trust: Issuer and Audience Enforcement
Under most normal circumstances, you’d supply Spring Security with an issuer URI in your application properties file. Then Spring would do the work of finding the Provider Configuration or Authorization Server Metadata and using them to decode your JWT. But as you learned here, these can be bypassed when you’re using custom-generated keys.
Regardless of whether you’ve configured an issuer URI or not, it’s important to explicitly verify the issuer (iss) in your code to ensure that every incoming token actually claims the same issuer and prevent token replay across apps. This adds defense in depth and makes your security posture clear in code. Likewise, audience (aud) ensures that the token is meant for your API, not for some other application. When both the issuer and the audience are checked, it prevents tokens from other apps or environments from being accepted by your API.
To validate these claims, you’ll need to create a custom JwtDecoder. But, because Spring doesn’t have a dedicated OAuth2TokenValidator for its audience, you’ll need to create one. Re-open your Security Configuration file and add the following class (nested):
class AudienceValidator(private val audience: String) : OAuth2TokenValidator<Jwt> {
    override fun validate(token: Jwt): OAuth2TokenValidatorResult =
        if (token.audience.contains(audience)) {
            OAuth2TokenValidatorResult.success()
        } else {
            OAuth2TokenValidatorResult.failure(OAuth2Error("invalid_token", "The required audience is missing", null))
        }
}
Warning: Don’t forget to import all necessary classes and interfaces
Then, add the following method:
@Bean
fun jwtDecoder(): JwtDecoder {
        val issuer = "https://myapp.com/auth"           // Replace with your own official issuer URI
        val audience = "http://localhost:8080/api/"

        val decoder = JwtDecoders.fromIssuerLocation<NimbusJwtDecoder>(issuer)

        // Add audience validation
        val audienceValidator = AudienceValidator(audience)
        val issuerValidator = JwtValidators.createDefaultWithIssuer(issuer)

        val validator = DelegatingOAuth2TokenValidator(listOf(issuerValidator, audienceValidator))
        (decoder as NimbusJwtDecoder).setJwtValidator(validator)

        return decoder
}
This function builds a custom JwtDecoder that enforces stricter validation on incoming JWTs. It starts by creating a decoder from the configured issuer, then defines two validators: one to ensure the token’s aud claim matches the expected audience, and another to ensure the iss claim matches the trusted issuer. These validators are combined into a DelegatingOAuth2TokenValidator and applied to the decoder, so that only tokens issued by the correct identity provider and intended for your application are accepted.
Note: If you need an Authorization Server (issuer) to test this flow, you can use a local or mock server like mock-oauth2-server. It also supports custom JWT generation.
Add the validation to your security filter chain:
@Bean
@Throws(Exception::class)
fun securityFilterChain(http: HttpSecurity): SecurityFilterChain =
    http
        .httpBasic { it.disable() }
        .formLogin { it.disable() }
        .csrf { it.disable() }
        .authorizeHttpRequests {
            it.requestMatchers("/api/fetchDocuments").hasAuthority("SCOPE_read:documents")

            it.anyRequest().authenticated()
        }
        .oauth2ResourceServer {
            it.jwt { jwt ->
                jwt.jwtAuthenticationConverter(jwtAuthenticationConverter())
                jwt.decoder(jwtDecoder())         // Add custom JwtDecoder
            }
        }
        .sessionManagement { it.sessionCreationPolicy(SessionCreationPolicy.STATELESS) }
        .build()
This allows the strict enforcement of the rules by the backend, never leaving it up to frontend logic to authorize or validate sensitive information.
Repository with the companion code for the tutorial
Go to GitHubWhat’s Next?
Strong security requires fine-grained control and layered safeguards beyond basic authentication. Use short-lived tokens with clear refresh and revocation strategies to limit exposure and prevent compromised tokens from persisting. Avoid using JWTs for session storage, as this leads to token bloat, complicates revocation, and increases the risk of exposing sensitive data. Instead, keep JWTs focused on authentication and authorization claims, and enforce validation of issuer, audience, signature, and expiry to ensure tokens are trustworthy and intended for your application.
Ultimately, securing Spring Boot APIs with OAuth2 and JWT depends on careful design, explicit configuration, and a clear understanding of how tokens, scopes, and identities are validated and enforced. Kotlin complements this by promoting null safety, immutability, and concise configuration, helping reduce misconfigurations and overlooked edge cases.
Kumanjayi Little Baby murder trial delayed until December – as it happened
Feed:
World news | The Guardian
(https://www.theguardian.com/world/rss)
Published: 2026-07-30 08:08:59
|
Created: 2026-07-31 01:12:59
This blog is now closed
Get our breaking news email, free app or daily news podcast
Minister says meeting Closing the Gap target a major step, but more work needed on others
Malarndirri McCarthy, the minister for Indigenous Australians, said early childhood education enrolment for First Nations children was a milestone in the effort to reach the Closing the Gap targets.
It is important to see this milestone achieved, and that is because of the work of the Aboriginal and community controlled sector and those involved in the preschool sector. … Clearly, the challenges with all the other targets remain, but I do take heart at the fact that this has been achieved.
It’s very, very difficult to deal with these situations where you have particular pieces of legislation that see the high incarceration rates of First Nations people. What that means is that we have to go harder, we have to keep pushing the states and territories around the justice factors. Clearly, that is a real concern.
Continue reading...Bad benchmarks and evals: Senior SWE-Bench, napkin math, and winter tires
Feed:
https://danluu.com/atom.xml
(https://danluu.com/atom.xml)
Published: 2026-07-23 00:00:00
|
Created: 2026-07-31 01:12:59
We're going to look at three different kinds of benchmarks, one set of calculations for baseline numbers for performance "napkin math" estimates, one set of AI model evals, and one on car tires. To build my intuition for things, I like thinking about them before seeing the explanation, so these are presented with the benchmark information first and the explanation later in case you want to think about your answer before seeing my thoughts.
29. A friend of mine is reviewing performance orders of magnitude to prep for computer performance interviews and found that https://github.com/sirupsen/napkin-math (5.4k stars) was the top hit. The README's tables include:
| Operation | Latency | Throughput | 1 MiB | 1 GiB |
|---|---|---|---|---|
| Sequential Memory R/W (64 bytes) | 0.5 ns | |||
| ├ Single Thread | 20 GiB/s | 50 μs | 50 ms | |
| ├ Threaded | 200 GiB/s | 5 μs | 5 ms | |
| Network Same-Zone | 10 GiB/s | 100 μs | 100 ms | |
| ├ Inside VPC | 10 GiB/s | 100 μs | 100 ms | |
| ├ Outside VPC | 3 GiB/s | 300 μs | 300 ms | |
| Hashing, not crypto-safe (64 bytes) | 10 ns | 5 GiB/s | 200 μs | 200 ms |
| Random Memory R/W (64 bytes) | 20 ns | 3 GiB/s | 300 μs | 300 ms |
Fast Serialization [8] [9] † | N/A | 1 GiB/s | 1 ms | 1s |
Fast Deserialization [8] [9] † | N/A | 1 GiB/s | 1 ms | 1s |
| System Call | 300 ns | N/A | N/A | N/A |
| Hashing, crypto-safe (64 bytes) | 100 ns | 1 GiB/s | 1 ms | 1s |
| Sequential SSD read (8 KiB) | 1 μs | 8 GiB/s | 100 μs | 100 ms |
Context Switch [1] [2] | 10 μs | N/A | N/A | N/A |
| Sequential SSD write, -fsync (8KiB) | 2 μs | 3 GiB/s | 300 μs | 300 ms |
| TCP Echo Server (32 KiB) | 50 μs | 500 MiB/s | 2 ms | 2s |
| Random SSD Read (8 KiB) | 100 μs | 70 MiB/s | 15 ms | 15s |
Decompression [11] | N/A | 1 GiB/s | 1 ms | 1s |
Compression [11] | N/A | 500 MiB/s | 2 ms | 2s |
| Sorting (64-bit integers) | N/A | 500 MiB/s | 2 ms | 2s |
| Proxy: Envoy/ProxySQL/Nginx/HAProxy | 50 μs | ? | ? | ? |
| Network within same region | 250 μs | 2 GiB/s | 500 μs | 500 ms |
| Premium network within zone/VPC | 250 μs | 25 GiB/s | 50 μs | 40 ms |
| Sequential SSD write, +fsync (8KiB) | 300 μs | 30 MiB/s | 30 ms | 30s |
| {MySQL, Memcached, Redis, ..} Query | 500 μs | ? | ? | ? |
Serialization [8] [9] † | N/A | 100 MiB/s | 10 ms | 10s |
Deserialization [8] [9] † | N/A | 100 MiB/s | 10 ms | 10s |
| Sequential HDD Read (8 KiB) | 10 ms | 250 MiB/s | 2 ms | 2s |
| Random HDD Read (8 KiB) | 10 ms | 0.7 MiB/s | 2 s | 30m |
| Blob Storage GET, if-not-match 304 | 30 ms | |||
| Blob Storage GET, 1 conn (128KiB) | 80 ms | 100 MiB/s | 10 ms | 10s |
| Blob Storage GET, n conn (offsets) | 80 ms | NW limit | ||
| Blob Storage LIST | 100 ms | |||
| Blob Storage PUT, 1 conn (128KiB) | 200 ms | 100 MiB/s | 10 ms | 10s |
| Blob Storage PUT, n conn (multipart) | 200 ms | NW limit | 10 ms | 10s |
Network between regions [6] | Varies | 25 MiB/s | 40 ms | 40s |
| Network NA Central <-> East | 25 ms | 25 MiB/s | 40 ms | 40s |
| Network NA Central <-> West | 40 ms | 25 MiB/s | 40 ms | 40s |
| Network NA East <-> West | 60 ms | 25 MiB/s | 40 ms | 40s |
| Network EU West <-> NA East | 80 ms | 25 MiB/s | 40 ms | 40s |
| Network EU West <-> NA Central | 100 ms | 25 MiB/s | 40 ms | 40s |
| Network NA West <-> Singapore | 180 ms | 25 MiB/s | 40 ms | 40s |
| Network EU West <-> Singapore | 160 ms | 25 MiB/s | 40 ms | 40s |
What's wrong with this benchmark?
30. I keep seeing people reference DeepSWE and Senior SWE-Bench to "prove" that their favorite model is better than other people's favorite models or just as generally good benchmarks, such as in
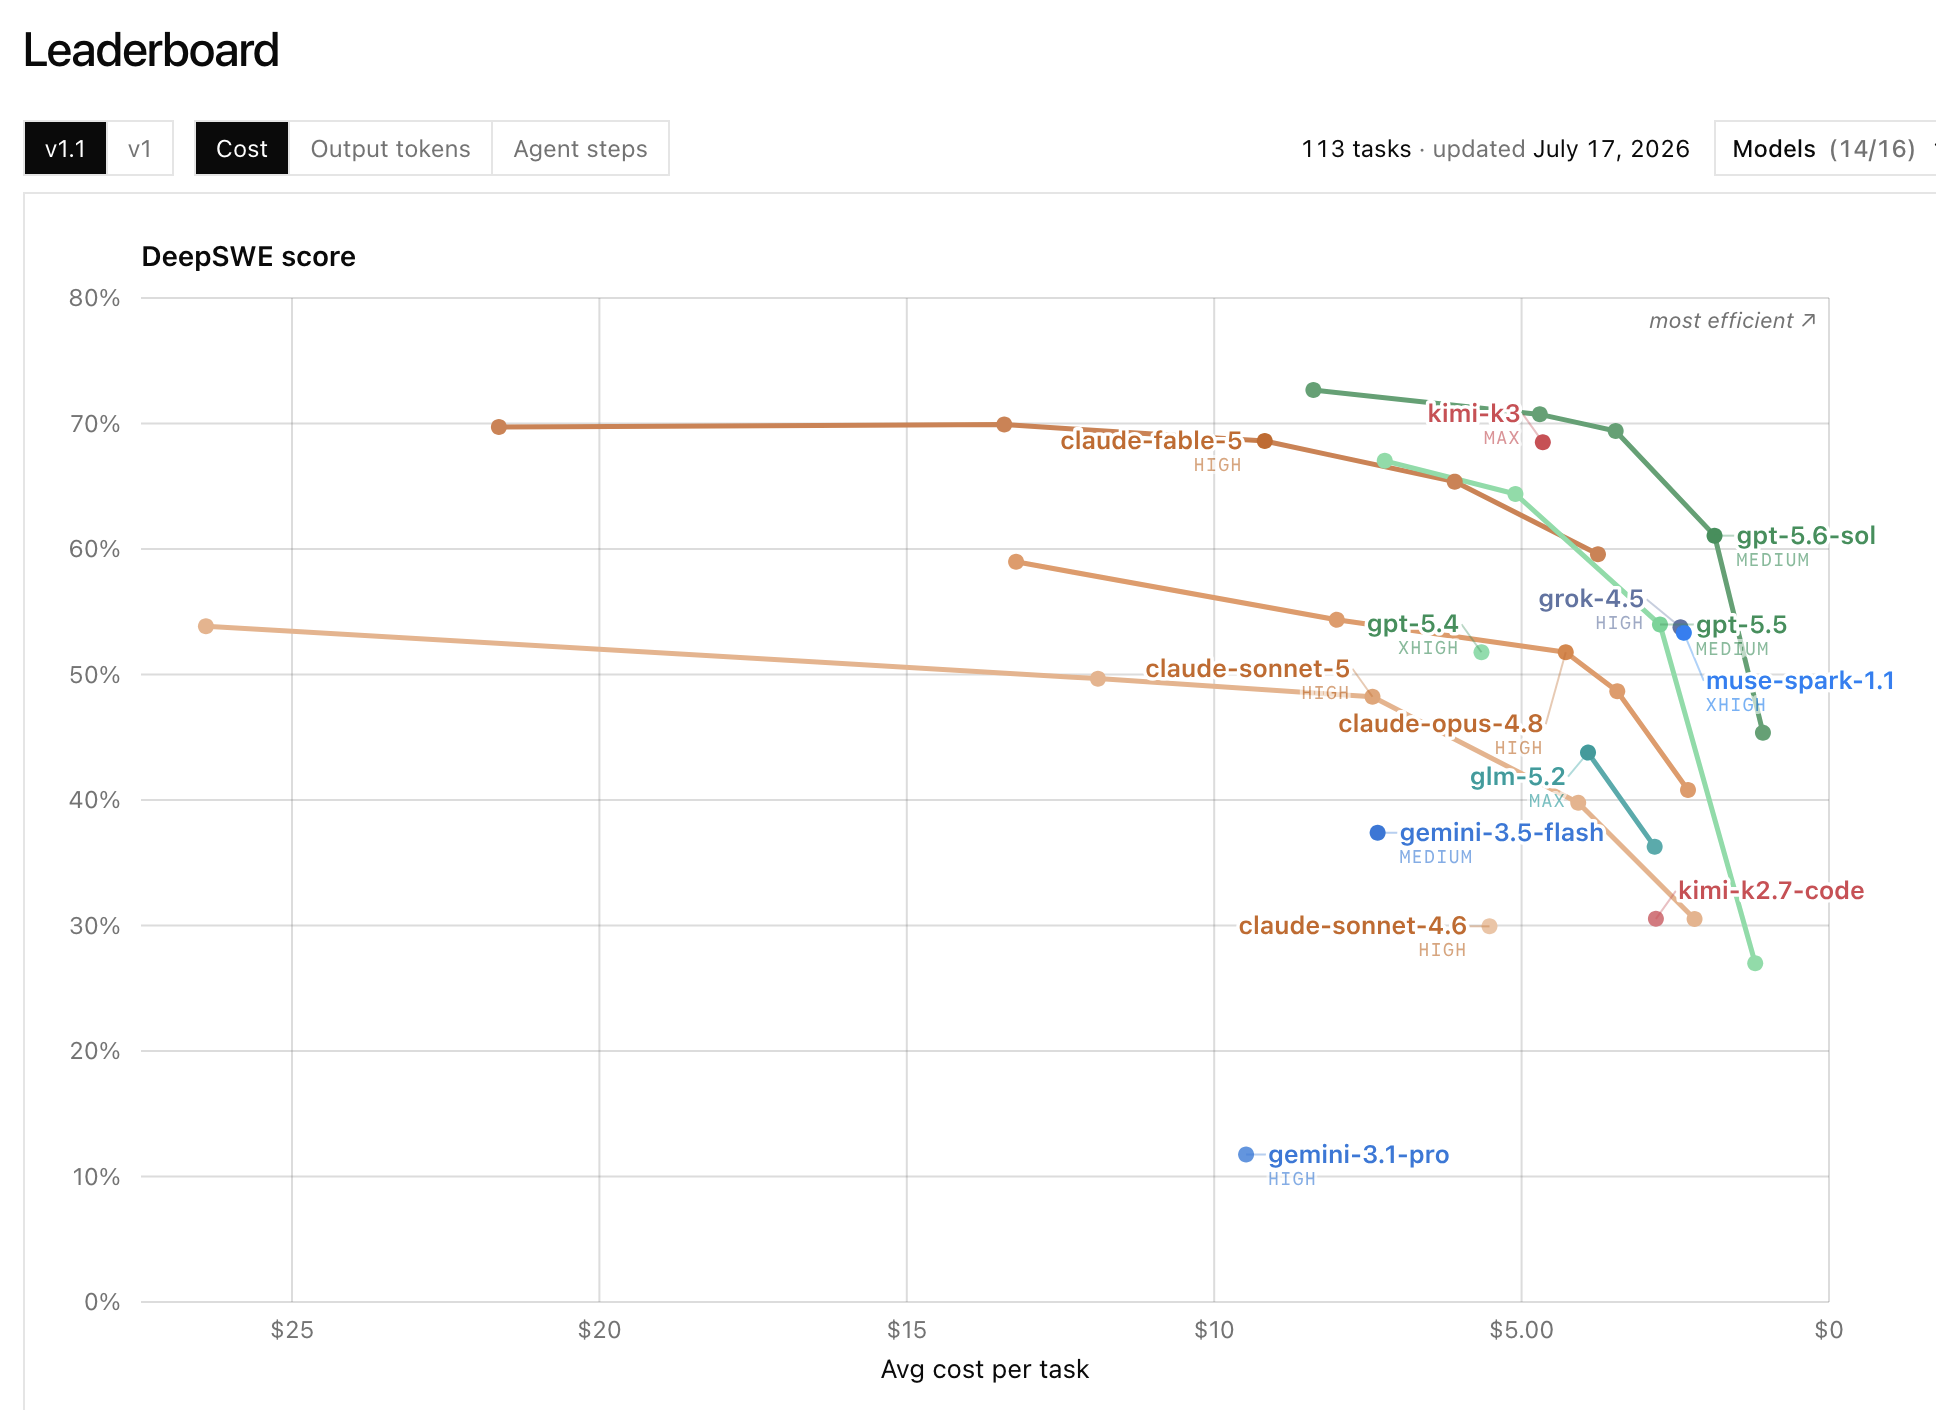
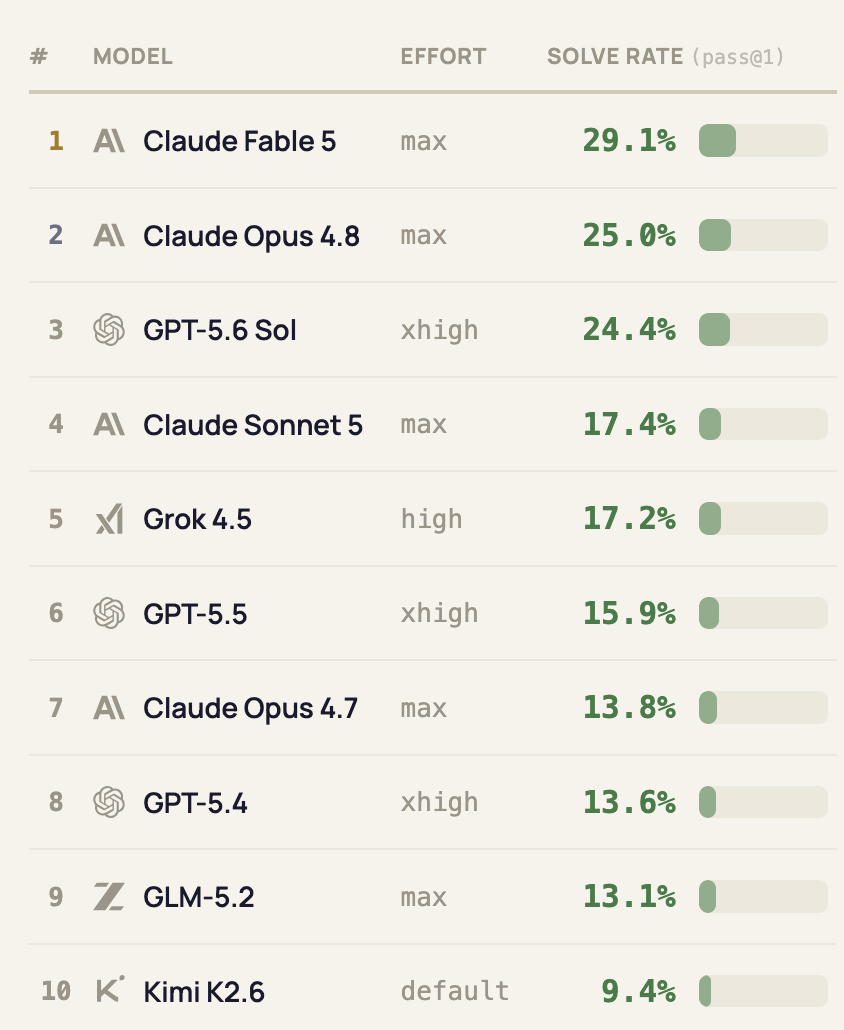
What's wrong with these benchmarks?
31. People frequently say that winter tires are superior to all-season tires in cold weather. For example, on googling "all season tires during winter cold" (no quotes), the Google AI summary leads with
All-season tires lose traction and stiffen in freezing winter temperatures. Their rubber compounds are designed for warmer weather and become hard below 7°C (45°F), leading to significantly longer braking distances and reduced grip ... The rubber in all-season tires cannot maintain pliability in sub-zero temperatures, causing them to perform more like hard plastic on snow and ice.
Given that there are a lot of internet comments in the training data, this is a reasonable comment, in that I frequently see variations on this comment on discussions of which tires one should use.
What's wrong with this benchmark?
29. Napkin math numbers
Random memory access latency
The thing that immediately jumped out to my friend (Jamie) as odd was random memory R/W listed as 20ns, since random memory R/W is implied to be a real DRAM read (as opposed to a cache hit), which he felt this should be around 100ns for an order of magnitude estimate.
As we were chatting about this, he noted that the README uses the term "latency" for some things that aren't really latencies. Then, when he pulled up the code for random memory read latency, he found the following (if you want another exercise, consider what's wrong with the following code before reading the explanation below):
  while test.i < test.vec.len() {
      let random_index = test.order[test.i];
      black_box(test.vec[random_index]);
      test.i += 1;
  }
Jamie noted that there's no data dependency between the loop iterations, so the memory reads here happen in parallel. Since the alleged latency number is determined by finding the average time for an access, this is incorrect because the CPU can have multiple loads in flight at once. If you wanted to measure latency this way, you'd have to introduce a dependence between loads, to prevent overlapping accesses (we discussed a related topic in exercise 19, covered in part 4 of this series).
Random SSD read
I agree with all of Jamie's comments, although I didn't really flag the use of the term latency myself because maybe it's shorthand for latency in some cases and something a bit latency-like in other cases (such as reciprocal throughput), which makes the table simpler.
What first jumped out to me, besides the memory latency number, was some of the other numbers. For example, random SSD read is listed as 100 us / 70 MB/s. You can get much faster (as well as much slower) SSDs. For example, if you have a fast (but non-exotic, e.g., non Optane) device, you might see latencies below 40us, e.g., the Kioxia CD9P-R was measured at ~30 us here. Other than for some trivial scripts, I haven't worked on anything where I care about disk performance, so I don't have an intuition for what numbers someone would want to have in mind1, but I also wonder if having a single number for random read latency and throughput is less useful than it is for DRAM accesses. Whenever I've looked at disk benchmarks, it seems like there's a huge range of results based on read size, queue depth, and number of jobs (e.g., see the previous link on the Kioxia CD9P-R). Of course, there are analogous factors that influence DRAM latency and bandwidth, but it seems like you're much more often in a regime where knowing one or two numbers is helpful when thinking about memory accesses. Since I don't know anything about disk performance, I asked Peter Geoghegan, who's done work on Postgres disk performance; he concurred and also wrote some additional comments on the complexity of disk performance below
If we look at the code for this SSD random read number, it feels off to me in the same way that the random memory read code felt off to Jamie. It generates offsets with
for i in 0..(buffer.len() / page_size) {
    pages.push((i * page_size + 1) as u64);
}
and then does 8 KiB reads (offsets are shuffled to create random reads). Some things that don't feel right about this are:
- The +1 makes every read unaligned. With a 4KiB page size, this makes one read touch 3 pages
- Different offsets can overlap the same pages, causing seemingly unintended reads from page cache
- Depending on the page size, reads can extend past the end of the file and cause a panic
The "buffer.len() / page_size" construction seems to be intended to keep accesses in bounds, but this is independent of the access length. If we want to be lazy and not think about exact offsets, consider some huge access length like 4 GiB (the buffer size is 8 GiB). That will surely overflow. If we want to be more precise, the overflow case will be more like a 4KiB page with 8KiB access length, but the same idea applies.
The very last offset is going to be SIZE - 4096 + 1. This gives us 4095 bytes we can access, but we try to access 8192 bytes. Because the benchmark only runs for 5 seconds, it may or may not actually try to read past EOF and fail, but there's a bug here regardless of whether or not it randomly fails on any given run.
Sequential SSD read
Just looking at the code, a lot of it doesn't feel quite right to me. For example, consider the code that's used to generate the sequential 8 KiB SSD read, which is said to have 1us latency and 8 GiB/s throughput. Like I said, I haven't worked on any problems where disk performance matters, so I don't have an intuition on whether or not numbers like this are plausible, but the code feels off to me. The code takes a 1 GiB file, flushing it, and then re-reading it repeatedly, so we'll have one uncached read followed by cached reads. It seems like the intent is to measure uncached reads here, but if the intent is to measure cached reads, the code isn't doing that either (this appears to be an issue for some of the other numbers as well, such as 3 GiB/s of fsync'd reads). One could argue that it's realistic to have an uncached read followed by cached reads, but it's not clear what someone who's using the aggregate number of 1 uncached read followed by N cached reads should do with the number when they don't have the exact same workload; N isn't stated in an obvious way, so they wouldn't even know if they have the same workload.
Since I have no idea what the numbers should be here, maybe we can look up some numbers. The measurement was said to be done on a c4-standard-48-lssd. Google's docs for that instance claim that the maximum throughput for all 8 attached disks is 5000 MiB/s (from Google's table, this scales per number of attached disks and is 625 MiB/s per disk). From the very little I know of disk benchmarks, it seems like peak throughput numbers are generally done when using larger reads, so 8 GiB/s seems excessive and the feeling that something is off from the code seems to be right. And if we look at other numbers, it seems like the broader point that having a few single numbers for specific read sizes isn't representative of disk performance in general.
Representativeness
But the idea behind this kind of "napkin math" generally isn't to know how exactly one cloud instance performs; it's to get some basic numbers that can be used to estimate performance in various ways. If we look back to the Kioxia CD9P benchmarks, there are plenty of read benchmarks with higher bandwidth than that, with various parameters (and also plenty with lower bandwidth, with various parameters). For latency, the latency is higher even for sequential reads at settings that minimize latency (including for the other disks in the benchmark), which is another sign that the sirupsen benchmark is inadvertently reading from cache, but even if the numbers were correct, it's not clear what you'd do with the numbers.
It seems like the sirupsen code has an attempt to prevent caching and prefetching. If it detects the test is being run on Linux, it sets an advisory POSIX_FADV_RANDOM and, before the test starts, it sets an advisory POSIX_FADV_DONTNEED, but neither of these will prevent caching on this benchmark at the OS level, nor should these be expected to prevent lower-level caching (such as inside the SSD). On Mac, the benchmark calls Command::new("sudo").arg("purge").output().expect("failed to flush page cache") beforehand, but there's no equivalent of POSIX_FADV_RANDOM and there doesn't seem to be anything done on other OSes (such as BSD or Windows).
There are other issues in other parts of the code, but rather than get into the weeds on every specific issue and most of the presented values, if we come back to this idea that there are things where we want to get an idea of a range of numbers in different regimes, there are quite a few places where that seems to be the case. To pick another example, the README cites "Decompression" at 1 GiB/s and "Compression" at 500 MiB/s. Of course, any kind of napkin math isn't going to be precise, but just playing with different zstd compression options, we get more than two orders of magnitude difference in compression speeds and there are algorithms that are more specialized for high speed compression, giving an even larger range (and of course you can spend more effort to get lower speed and denser compression).
Going back to the disk example, we noted that the disk numbers come from a VM configuration with 8 disks. The numbers appear to be incorrect but, if the numbers were correct, of course you'd get different numbers for something like read bandwidth if you used a single-disk version of the VM. You'd expect roughly 1/8th the read bandwidth for the read benchmarks if it wasn't reading from the page cache. It's not clear why it's particularly useful to have a read bandwidth number for one particular 8-disk configuration on GCP memorized as a napkin math figure.
What's useful to learn?
Overall, I do find knowing some of these kinds of numbers useful, but I don't know that I'd necessarily want to look at a table to see the numbers (except maybe as interview prep that I'd expect to forget immediately after the interview if I had good reason to believe I'd be asked about them in an interview). In general, if you're doing things where it makes sense to know these numbers, you'll pick them up just by using them. For example, I still remember that dispersion in standard single-mode fiber is 17 ps / nm * km because I did some optics / photonics work twenty years ago. This comes up often enough in back-of-the-envelope calculations that you'll just remember this at some point if you use it enough. Likewise for various powers of 2 (e.g., 2^8 = 256, 2^16 = 65536, etc.), which I didn't try to memorize but picked up because, if you do enough coding where you touch these numbers, you end up remembering the numbers that often come in handy.
The linked napkin math repo notes that "numbers [are] rounded for memorization", implying that it makes sense to memorize these. In addition to what's mentioned above, a lot of these numbers are derivable and, in my opinion, if you're using these for work, it often makes sense to understand the derivation even if you have a ballpark number memorized. For example, we derived the single-core memory bandwidth number for a Sandy Bridge processor from some basic parameters in part 4. If you just want to know how fast a piece of code is going to run, you generally don't to rederive everything from first principles. But, if you're trying to understand the implications of changing something, it's helpful to know the what mechanisms are in play and how they'll interact, which is something you don't get from having a handful of numbers memorized.
Going back to the context for this question, my friend who was doing interview prep, the last concern he mentioned was that this repo is very popular, so the interviewer might be use it without knowing that most of the numbers that are listed are wrong.
Bonus info: memory latency over time
BTW, I was curious what memory latency is actually observed on real systems, so I plotted the data from the instlatx64 site, which reveals the following:
There are two graphs here because two different, non-comparable, methodologies were used. The original methodology used accesses with a 1024 byte stride to find memory latency, which worked fine for accesses over a large enough data set on older processors. Newer processors added mechanisms that can make this fail to be a pure DRAM access, so the newer methodology uses random accesses to find memory latency (some of the later numbers using the old methodology aren't really valid if you're thinking of them as a random memory access time). The latencies come from the instlatx64 site and the CPU release year was found by asking GPT-5.6 Sol ultra in codex without verifying the results, so some of the years are probably incorrect.
Just from eyeballing the graphs, we can see that memory latency improved tremendously for a while, but this improvement eventually stalled out and we actually see higher observed latencies over time for reasons that are outside the scope of the post.
690ns?
We also see some extremely high outlier results from the 90s. Without spending too much time looking at these results, it's not obvious that the results are incorrect. On the Intel side, the big outlier is an 83 MHz Intel Pentium Overdrive. The other old Intel results are all non-Overdrive Pentiums.
The Overdrive Pentiums were chips you could slap into a motherboard for a previous generation CPU. It looks like the test was run on a Gigabyte GA-5486AL motherboard with an ALi M1489/M1487 chipset set to a 33 MHz bus speed. According to the ALi M1489/M1487 datasheet, there are four possible DRAM read timings. If it's configured to the "normal" setting, a read page miss is CP+8, with a 4-4-4 read timing. I'm even less familiar with 486 bus timing than I am with disk performance, so I asked an LLM about this and it told me that this is correct and we should expect 21, 22, or 23 cycles for a memory access here. This doesn't feel quite right since, on asking the LLM what the heck these numbers mean, it's for the first word followed by each additional word, so that number of cycles is for a full cache line fill. The actual load-to-use latency for a word access should then be the first part, or 11 bus cycles, but if you want the time for the whole cache line, then the number seems plausibly like it's in the right benchmark.
On looking at the outlier AMD K5 PR166 result, there's something a bit odd about it, but we're pretty far off into the weeds on a question about modern computer performance, so maybe that can be another question for later in the series.
30. DeepSWE / Senior SWE-Bench
General plausibility
Before looking at the methodology of these benchmarks and just looking at the results, neither DeepSWE nor Senior SWE-Bench feel plausible as summaries for how well coding agents work overall. A surface-level reading of the DeepSWE homepage has OpenAI's last-generation model (GPT-5.5) being as good as Anthropic's current-generation model (Fable 5) and a surface-level reading of the Senior SWE-Bench has Anthropic's last-generation model (Opus 4.8) as being better than OpenAI's current generation model (GPT 5.6). In general, the surface-level reading is what most people will take away and this is how I generally see these used (e.g., in work slack, when people send these to me directly, etc.).
Methodlogy issues
If we look at how the sausage is made, very few of the publicly available benchmarks seem like reasonable things to rely on for getting a general idea of how good coding agents are. In terms of methodology, the benchmarks don't really make sense with respect to what you'd need to measure to get a generalizable result. Just like I don't know anything about disk performance, I don't know anything about AI, so I asked someone who ran an evals team at Anthropic for a while (Aaron Levin) to review the reasoning and conclusion and he concurred with the general idea and the reasoning. As with the consultation with the disk-performance expert, the point of this isn't to say that you should agree because an expert agrees; it's to say that, in these cases, you don't need any kind of specialized knowledge about the field to come to the same conclusion an expert would come to. You just need to apply the same kind of generic reasoning you'd use to evaluate any benchmarking or experimental design problem.
Summary score representativeness
In the last post, we discussed the high-level idea that a single summary score can say pretty much anything because, when we look at subbenchmark results, there will be plenty that favor model X over model Y and there isn't a particularly good way to, in general, sample the distribution of tasks out there to say that benchmark A is better than benchmark B because it's more representative.
If we look more at the details of these benchmarks, for DeepSWE, there are 113 tasks (or that's what codex told me, anyway), each one of which is run four times, with what generally appears to be a pass/fail score (models appear to score 0%, 25%, 50%, 75%, or 100% on each task). On the graph, we can see that GPT-5.5 is much better than Opus 4.8; the difference between GPT-5.5 and Opus 4.8 is about as large as the difference between Opus 4.8 and Gemini-3.5 Flash. As we noted above, if you've used these models, this doesn't really match the experience I or anyone whose judgement I trust has, overall (of course there are specific tasks or sub-benchmarks where this is true).
If we look at why this is supposedly the case, GPT-5.5 xhigh is allegedly a bit cheaper than Opus 4.8 xhigh and much better (scoring 67% vs. 54%). Of the 113 tasks, the models tie on 34 tasks, GPT-5.5 xhigh wins on 57 tasks, and Opus 4.8 wins on 22 tasks. For me or another programmer, this might be meaningful if these tasks are representative of tasks I or another programmer do. 113 tasks (or even just the 79 differing tasks) are more than we're going to look at in detail in this post, but from looking at the names of the tasks, few to none of them seem relevant to tasks I do at all. And then looking at language, of the tasks that differ, 4 tasks are in a language I often use coding agents for (Rust), and the rest of the tasks are in languages where I don't use coding agents or use them for trivial problems where any model is fine2.
The four Rust tasks where results differ are:
Hierarchical evaluation cancellation in Boa (https://deepswe.datacurve.ai/data/v1.1/tasks/boa-hierarchical-evaluation-cancellation), Deterministic multi-key sorting in fd (https://deepswe.datacurve.ai/data/v1.1/tasks/fd-deterministic-multi-key-sorting), Preserve stylesheet-selector structure in oxvg (https://deepswe.datacurve.ai/data/v1.1/tasks/oxvg-structural-selector-preservation), and Trap coredump generation in wasmi (https://deepswe.datacurve.ai/data/v1.1/tasks/wasmi-trap-coredumps). None of these seem all that related to things I use coding agents for, so this is worthless to me.
One of these seems vaguely like something I've done in the past year and the other three don't. We know from looking at individual benchmarks that there's significant variance in results between different benchmarks (for example, in the Optimization 1 benchmark in the last post, we get a vaguely DeepSWE-like model ranking, but in the GameAI we get a Senior SWE-Bench-like ranking, but as we also observed in that post, you can have one benchmark that nominally appears to resemble a task we care about that gives a result that's the opposite of what we see on the actual task, again because variance is very high). Having 1 out of 113 tasks sort of be similar to a task I've done means the DeepSWE benchmark score is meaningless to me personally.
Senior SWE-Bench
Moving on to the other benchmark, Senior SWE-Bench has all of the problems noted above, and it also presents the results in a more misleading way and has the additional issue of doing more subjective grading of results. I don't want to do one of these super long point-by-point teardowns, but to look at one issue with it, to qualify as a "tasteful solve", a solution has to meet multiple criteria, including scoring better than a certain score on a rubric and having a result that isn't >= 2x the length of a reference result.
Arbitrary and subjective scoring function
Without even looking at it more deeply, we already see this is a classic https://danluu.com/discontinuities/ situation. The benchmark has these continuous scores and then it introduces threshold effects by requiring a strict cutoff. From what I've seen, this kind of thing is often done because it makes things simpler, but if you believe the underlying criteria are important, in general, you often don't want to say that a score of X is a pass and a score of X-epsilon is a failure. Instead, the scores should be aggregated in some non-discontinuous way. I think there's often a hesitancy to do this because trying to write down a formula for this often makes it obvious that the weights are arbitrary and the score is meaningless. We probably know we don't want to give up to N extra score for a 1 LOC solution if the reference is R LOC, so we need some function that will cap the value there. Maybe we can cap the bonus at 2 by doing something like (2R)/(R+N). Maybe this doesn't penalize large functions enough, so we should switch to (2R^2)/(R^2+N^2). It might be easier to see the behavior of this if we write it as 1+tanh(ln(R/N)), so you can mentally substitute that if you prefer. We then need to combine this with the other scores, so we need to add at least M-1 of the M formulas so we have some relative weighting for them.
This would clearly be an arbitrary formula that's hard to justify. But the actual formula used has these discontinuities is another completely arbitrary function, but with worse properies that make it even harder to justify! It's just that whoever's writing it down doesn't have to think of it as a formula so they can avoid thinking about how arbitrary it is.
Threshold effects
If we look specifically at the LOC measure as defined by Senior SWE-Bench, of course we see threshold effects. For example, on https://senior-swe-bench.snorkel.ai/tasks/paperless-ngx-perf-workflow-queries, GLM-5.2 scores tasteful at 121 LOC vs. 61 for the reference. If there was one single LOC more, it would be 122, or double, which would cause GLM-5.2 to fail instead of pass. We can also see from the link that the benchmark was run once per condition. As anyone who's used LLMs knows and as we saw in the last post, there's tremendous variance between runs (quite often, there is commonly variance between runs than across different models and effort levels, which we observed in the last post), which already makes a single run not very meaningful when scored with some kind of reasonable continuous score. When noisy metrics like this then have information removed with these threshold effects, the result becomes even less meaningful.
That isn't even a particularly problematic benchmark with respect to the LOC score. plausible-fix-top-pages-comparison is worse because the reference solution is 1 LOC (since addition and deletion each count as 1 LOC, this is scored as 2 LOC). This makes the maximum size of a tasteful solve 3 LOC; if additions and deletions both happen, this would have to be 1 LOC deleted and 2 added or vice versa.
Code quality
If we look at the actual results, they don't make sense. We can see that, on this task, Opus 4.8 scores "tasteful" while Opus 4.7 and Fable 5 don't. If we look at the actual diffs and compare them to the reference solution, we find the following (note that only changes to the actual code count for the LOC criteria; test LOC, comments, etc., do not count).
Reference
  --- a/lib/plausible_web/controllers/api/stats_controller.ex
  +++ b/lib/plausible_web/controllers/api/stats_controller.ex
  @@ -723,7 +723,7 @@ defmodule PlausibleWeb.Api.StatsController do
       else
         json(conn, %{
           results: pages,
  -        meta: Map.merge(meta, Stats.Breakdown.formatted_date_ranges(query)),
  +        meta: Map.new(meta.values) |> Map.merge(Stats.Breakdown.formatted_date_ranges(query)),
           skip_imported_reason: meta[:imports_skip_reason]
         })
       end
Opus 4.8 (pass)
  --- CHANGELOG.md
  +++ CHANGELOG.md
  +- Fixed blank comparison dates in row tooltips on the Top Pages report

  --- lib/plausible_web/controllers/api/stats_controller.ex
  +++ lib/plausible_web/controllers/api/stats_controller.ex
  -        meta: Map.merge(meta, Stats.Breakdown.formatted_date_ranges(query)),
  +        meta: Map.merge(Map.new(meta), Stats.Breakdown.formatted_date_ranges(query)),

  --- test/plausible_web/controllers/api/stats_controller/pages_test.exs
  +++ test/plausible_web/controllers/api/stats_controller/pages_test.exs
  +      assert json_response(conn, 200)["meta"] == %{
  +               "date_range_label" => "2 Jan 2021",
  +               "comparison_date_range_label" => "1 Jan 2021"
  +             }
Opus 4.7 (fail)
  --- lib/plausible_web/controllers/api/stats_controller.ex
  +++ lib/plausible_web/controllers/api/stats_controller.ex
  -        meta: Map.merge(meta, Stats.Breakdown.formatted_date_ranges(query)),
  +        meta:
  +          meta.values
  +          |> Map.new()
  +          |> Map.merge(Stats.Breakdown.formatted_date_ranges(query)),

  --- test/plausible_web/controllers/api/stats_controller/pages_test.exs
  +++ test/plausible_web/controllers/api/stats_controller/pages_test.exs
  +      assert json_response(conn, 200)["meta"]["date_range_label"] == "2 Jan 2021"
  +      assert json_response(conn, 200)["meta"]["comparison_date_range_label"] == "1 Jan 2021"
Fable 5 (fail)
  --- lib/plausible/stats/breakdown.ex
  +++ lib/plausible/stats/breakdown.ex
       %{
         results: build_breakdown_result(results, query_with_metrics, metrics),
  -      meta: meta
  +      # `meta` is a `Jason.OrderedObject` - convert it to a plain map so that
  +      # callers can safely `Map.merge/2` extra fields into it. Merging into the
  +      # struct would add keys outside of its `values` field, which the JSON
  +      # encoder for `Jason.OrderedObject` silently ignores.
  +      meta: Map.new(meta.values)
       }

  --- lib/plausible_web/controllers/api/external_stats_controller.ex
  +++ lib/plausible_web/controllers/api/external_stats_controller.ex
  -  defp maybe_add_warning(payload, %Jason.OrderedObject{} = meta) do
  +  defp maybe_add_warning(payload, meta) do

  --- test/plausible_web/controllers/api/stats_controller/pages_test.exs
  +++ test/plausible_web/controllers/api/stats_controller/pages_test.exs
  +      assert json_response(conn, 200)["meta"] == %{
  +               "date_range_label" => "2 Jan 2021",
  +               "comparison_date_range_label" => "1 Jan 2021"
  +             }
I'm not an Elixir programmer, nor am I familiar with this codebase, but just looking at the code, the failing, "non-tasteful" Opus 4.7 solution looks semantically identical to the reference solution. The only difference is that the pipeline was expanded onto multiple lines for readability. Without knowing Elixir, it strikes me as absurd to fail this based on "tastefulness".
I've used other languages where you commonly use a pipe operator like this (such as F# or R with tidyverse) and I don't believe I've ever run into anyone who would reject the Opus 4.7 change for being "untasteful" (unless there was a style guide which had strict rules about what should be expanded into multiple lines and what shouldn't, but if that were the case, an autoformatter should deal with this and the formatting of the solution is irrelevant).
The Fable 5 solution should arguably be rejected for expanding the scope of the change too much but, whether or not it should be rejected for other reasons, it seems wrong to additionally reject it as "untasteful" due to the length.
Grader variance
LLM variance also applies to the grading itself. Of course it must be the case that if we feed the results of one single run to an LLM grader multiple times, we'll get different scores for the same reason we often get wildly different results when we ask an LLM to solve the same problem multiple times. I tried having my friendly neighborhood coding agent re-run grading 10 times for each condition that GPT-5.6 Sol and Opus 4.8 were tested under (codex tells me grading was run using Sonnet 4.6, so it re-ran with that). The expected LLM-graded tastefulness result flips from the official result 23% of the time when using the same model and effort level (in terms of sub-results, relative taste flips in 32% of cases, practice alignment flips in 5% of cases, and task rubric flips in 3% of cases). If we instead look at the fraction of the time the official result differed from the typical/median result, there's a 21% difference overall (27% for relative taste, 3% for practice alignment, and 2% for task rubric). The overall flip rate is lower than the individual flip rate because, in some cases, a result flipped from tasteful to untasteful in a sub-score when the overall score was already untasteful.
Just to be clear, this is not run-to-run variance. This is the variance from using LLM grading on a single run, which, across the publicly available GPT-5.6 Sol and Opus 4.8 benchmarks, appears to give an incorrect result about 20% of the time (if we assume what's being measured is correct and reasonable to measure in the first place and tha the most likely Sonnet score is the correct score).
Of course we get different results if we grade with different models as well. If we re-grade with GPT-5.6 Sol instead of Sonnet 4.6, the number of solutions that are judged to be tasteful is cut by more than half for both models. Is that more or less accurate? Who knows?
Overall validity
Sometimes, you can look at a benchmark and say that, while some individual results are wrong, in aggregate, the noise cancels out and the overall results make sense. I don't think that's the case here. I've seen a lot of people passing Senior SWE-Bench around, seemingly because it purports to give realistic problems and score them in a reasonable way. We already noted that, prima facie, the results don't seem plausible, and, that looking at the methodology supports the prima facie thought that the result is not meaningful3.
The presentation of results also leaves something to be desired. On a Slack I'm on, someone linked to this, which shows a preview snippet with the following:
- Claude Fable 5: 29.1%
- Claude Opus 4.8: 25.0%
- GPT-5.6 Sol: 24.4%
They gave an approving comment, saying this was more realistic than other benchmarks (referring to one of the many benchmarks that put GPT-5.5 ahead of Opus 4.8). If you actually look at the results, it's clear that the difference between 25.0% and 24.4% is pretty much meaningless, but the results are presented as if these are meaningful differences. Although the page makes it clear that GPT-5.6 Sol is, as measured, much cheaper than Opus 4.8, most discussions I've seen that refer to Senior SWE-Bench elide this and mention only the headline result. It also seems odd that the headline result uses max for Fable, Opus, and Sonnet, but xhigh for GPT-5.6, GPT-5.5, and GPT-5.4.
31. Cold weather tire performance
Although people commonly say that all-season tires become hard (for some reason, the phrasing that they become as hard as "hockey pucks" is common) at 7C / 45F and have poor grip, there's no benchmark! This has been a common theme in this series: people repeating a claim that has no apparent basis in a measurement4.
Luckily, as we discussed in this post on platforms and monetization, Jonathan Benson has been able to monetize in-depth explorations on tires, resulting in a never-before seen level of detail in public tire benchmarks. He tested how well different kinds of tires perform at different temperatures and in different conditions. I'm sure tire manufacturers have all sorts of tests like this but, AFAIK, this hadn't been done publicly in a comprehensive way before (hmm, this doesn't seem so different from public benchmarks of coding agents).
In Benson's testing, he finds that, in dry conditions, summer tires have the best grip down to 0C / 32 F (he didn't test colder conditions), followed by all-seasons, with winter being worse than both summer tires and all-seasons by a fairly large margin. In wet conditions, he only tested down to 2C since, at 0C, you have icy conditions and not just wet conditions. The ranking is a bit different since all-season tires wildly outperformed summer tires at 2C in the wet, but summer tires still outperformed winter tires.
Note that, in the video, what Benson calls a winter tire is a UHP winter tire, which I very rarely see people using in the US or Canada (although it's what I use for a winter tire since that makes sense for the local conditions where I live). What he calls a "nordic" tire is what most people use for a winter tire even locally here and everywhere else I've lived, all of which are locations where that kind of tire doesn't really make sense unless you're spending a lot of time driving into the mountains (and even then, it's probably still not the right choice for most people where I've lived) or you spend a lot of time driving on ice. But even if you look at the UHP winter tire results compared to all-seasons, it's still true that all-seasons are better in dry or wet conditions above 0C, although the magnitude of the difference is much smaller than it is relative to the "nordic" winter tires that most people in the US use (I think the terminology he's using might be more common in Europe?).
Of course different tires will perform differently and we'd see some variation in results with different tires, and of course there are many conditions where it's better to have winter tires than all-season tires or summer tires, but the idea that all-season tires become too hard to grip and you have to have winter tires for cold alone is clearly false.
Who cares about tires?
BTW, if you're wondering why you should care about tires at all, on average, motor vehicle accidents are a fairly major cause of death and, if you look at the impact of velocity on accident severity, it's pretty significant, so it stands to reason that having tires that let you brake more rapidly or corner a little better and maybe avoid or deflect the accident a bit, it's reasonable to think this would have a substantial impact on accident severity. I don't think this is the kind of thing there's really good data for (it would be very hard to run the randomized trial and observational data is going to be highly confounded, in general). But, as part of an analysis I did last year, I tried to find the relationship between HIC and velocity in actual crash test data. Surprisingly to me, I couldn't find a paper that had done this (I did find some papers that could serve as exercises for this series, though), but a straightforward analysis put the relationship as roughly to the fourth power. I should really write that up into a post that's like this other post on crash testing, but specifically about the HIC and concussion risk of various vehicles! Anyway, I try to drive a car with the right tires for the locale because it seems like that's plausibly one of the higher impact interventions I could do for my own safety per dollar and/or effort. But I've never gotten close to a situation where my really good tires have made a difference and someone who's going to try to find the right tires for safety reasons may be less likely to get into an accident in the first place, so this may just be a silly hobby that doesn't matter at all.

More problems in benchmarking and evals
If you liked this post. this is part of a series of exercises on benchmarking, evals, and experimental design (1, 2, 3, 4, 5, 6)5.
Thanks to Peter Geoghegan, Aaron Levin, Luke Burton, Em Chu, Jamie Brandon, Yossi Kreinin, Jeshua Smith, and Ikhwan Lee, for comments/corrections/discussion.
Appendix: more on disk performance
Here are some follow-up comments by Peter Geoghegan who, unlike me, actually knows something about disk performance:
I've seen significant variation in performance across more or less comparable SSDs for certain access patterns. This is likely due to FTL/firmware level differences. Evidently some SSDs are much better than others at reading backwards sequentially, independent of OS read ahead (with direct IO). Here's a blog post about it from the person I'm working with on IO prefetching for index scans in Postgres: https://vondra.me/posts/fun-and-weirdness-with-ssds.
I'm fairly sure that these things are still opaque to the OS/filesystem. This admittedly-dated LWN.net article provides some justification for this: https://lwn.net/Articles/353411, "The message to file systems developers is "Just trust us" and "Don't worry your pretty little systems programmers' heads about it" whenever we ask for more information on SSD implementation".
I asked Linux hacker Matthew Wilcox about this in 2023. He said that it was about the same, and that if I wanted to account for performance variation for microbenchmarking purposes the best way was still to be very defensive about provisioning, running TRIM regularly, etc.
At one point (I think around 2015), I wrote some code with the intention of turning it into some exercises or a tutorial on CPU performance. It was sort of like the napkin math repo, but much narrower. The idea was that you could have questions like:
- You have CPU X. If you want to know how fast this loop is, what parameters do you need to know?
- Given these parameters, how fast should the loop be?
I had the code I wanted for various things but, for some reason, the code I wrote didn't elicit a difference between a DRAM open page access and a closed page access and then I got distracted with other things and didn't end up writing it up. Pre-LLM, doing this kind of thing was fairly time consuming, because to get it right, you have to know enough about what the mechanisms that are in play are and then take some care in writing the code and checking what it does. And then, because I screwed something up and make enough time to debug it, I never ended up writing up the exercises because I didn't want to write it up when there was some kind of mystery that implied that my code had at least one issue.
Anyway, disk is way more complicated and getting good numbers would take a lot more care. With LLMs, I think this would now be doable without it taking a ton of time, but some care would still be necessary.
P.S. The friend of mine mentioned in (29) is Jamie Brandon, who's actively interviewing and looking for work. He's done a fair amount of work on databases (query engines) and streaming systems. His best-known writing is probably Against SQL, but he's also written quite a few other posts I like, such as this analysis of streaming systems consistency bugs. He's mainly looking for a Vancouver-local job or a remote job. If you'd like to talk to him, you can reach him at jamie@scattered-thoughts.net.
- I'm often mistaken for a performance engineer, but I think it's more like, I sometimes solve performance problems due to a combination of having an unusual degree of experience with benchmarking / evals / experimental design for a programmer due to my hardware background (where this is a more mature field than it is in software, as discussed here) and my propensity to go after problems that can easily be linked to dollar value such as this, or this, but I'm as likely to solve a performance problem as any other problem and I don't have a particularly deep or broad knowledge of performance problems compared to people who do performance work day in and day out. [return]
- On the topic of whether or not it makes sense to filter by language, I looked into this after seeing people cite this post about token efficiency of languages; the results from that post didn't replicate for non-trivial tasks, but there seemed to be real enough differences between languages that it plausibly made sense to filter by language. In particular, when agents fail to implement something, especially on lower effort levels, it's often due to some idiosyncratic incorrect usage of a language. For example, for the zstd eval in that post, agents using Clojure would very often rely in incorrect semantics of byte conversion, but agents using Java, which fundamentally has the same operations available, wouldn't make that mistake. [return]
At a meta level, people who I talk to who generally have comments I find reasonable on other topics don't take these headline/summary results very seriously.
For example, In a comment on the usefulness of these benchmarks, Em Chu said:
twitter/hacker news sentiment, which at least won't be misleadingly precise, feels like a better way to tell whether or not a model is useful, as strange as that is (which unfortunately requires reading a lot of hacker news posts, so I cannot recommend.) I usually find my eyes skipping over anything that looks like an LLM benchmark since the chances that it's worth reading are near zero. (I wish I would do this for hacker news comments too.)
Most people I know whose judgment I trust take a similar approach (sometimes substituting opinions of people they know for online sentiment). The exceptions to this are generally people who work in the field and look at a ton of benchmarks and do some kind of mental aggregation of them. For example, when I talk to Max Bitker (who runs an RL environment startup), he's familiar with seemingly every public benchmark and can seem to predict what sentiment will be like a couple weeks after a model release based on his mental model of the aggregate landscape of all the benchmarks out there, but that's a very different thing than looking at a summary score metric and time-consuming enough that, unless you work on AI, this seems more like a hobby interest than something you'd reasonably do to evaluate model effectiveness (nothing against hobby interests; I have lots of hobby interests).
For a concrete example of what it looks like to take the results of these benchmarks seriously vs. what's observed in the real world, here's a thread where someone creates an effectiveness vs. cost table of the then-new 5.6 Sol/Terra/Luna vs. 5.5 using DeepSWE results. Someone (who I'd agree with, although I'd phrase it differently) replies
Bullshit. Have you actually used the models or are you having a wank? According to this table 5.6-sol xhigh would be both cheaper and better than 5.5 xhigh. In what reality is that actually true?
Another person replies to them with
In none. I think the benchmark tasks are really straighforward in which case the table may be true.
I don't think that's quite fair (I've tried tasks where it seems to be true) but, in general, people mostly have very different experiences than public benchmarks are showing. This seems to be understood by quite a few people, from people I know in person to random internet commenters. But it's not universal, as I still see people passing around these scores to explain why they use some model and effort level, which doesn't seem justified in general.
[return]- In general, I don't turn these examples into an exercise unless it's a common claim that I see many times because completely unsupported incorrect claims happen so frequently that it's not really interesting in the general case. [return]
I've been publishing these on Patreon without a strong reason to. I make a bit of money off Patreon, but if I was optimizing for money I think it would obviously be the right choice to just publish everything publicly since the potential delta in earnings from maybe getting connected to a potential job dwarfs what I could earn directly via Patreon. That goes double considering how bad I am at interviews (I've almost exclusively gotten jobs where the interview is formality as my odds of passing an interview are otherwise close to zero; the last time I did an interview, I failed a phone screen on a leetcode-style question, and when I pass those I'll typically fail the full interview later if it's a real interview).
I originally started publishing things on Patreon that I thought were too small or inconsequential to turn into a "real" blog post, but then I got in the habit of publishing things on Patreon and haven't written much publicly for a while.
This kind of post, which is part of a long set of exercises, falls squarely into the category of things that seems too small and inconsequential to put onto the main blog. If you have opinions on this, I'd be curious to hear what you think.
The idea behind this series was that I wanted to write some kind of tutorial or blog post to help people with better benchmarking and evals. But, my feeling on evals is that it's more about avoiding mistakes than following some particular process, so there isn't really a step-by-step guide format that works in the general case. I know there are approaches to experimental design where they teach you to do things like drawing a causal graph and then looking at the graph to figure out the potential problems, e.g., collider bias. Just from seeing how people do data analysis before and after learning techniques like this, I don't think this makes a huge difference on average (although a few people do find it very useful).
I saw a criticism of this as a generalized way to avoid experimental design issues somewhere (maybe from Andrew Gelman) that the problem is that everything is related to everything, so you're still applying your judgement when you create the causal graph. Being able to mechanically see the problems once the graph is created doesn't stop someone from drawing the wrong graph in the first place.
A vaguely related idea that I saw when I read the first chunk of McElreath's Statistical Rethinking many years ago, hoping to learn some process that would lead to rigorous statistical analysis is that there isn't really such a process and you ultimately have to use your judgement to decide if something makes sense or not.
That being the case, I thought a series of exercises might work, so I had this idea to write maybe 50 or 100 exercises into a single post. That seems quite do-able for small exercises, but it's clear from watching people learn a variety of things that giving people a bunch of small exercises and then hoping that people generalize the techniques onto larger, more complex, exercises, doesn't usually work very well. Once you start adding in larger, more complex, exercises, you quickly get beyond the length of a long post, even by the standards of this blog, which has this 32k word post on what the FTC got wrong in their 2011-2012 investigation of Google (for reference, a typical novel is often said to be 80k-100k words).
In general, I've avoided putting multi-part posts on the blog because, as a reader, I much prefer it if things are all in one post instead of spread across some kind of long series of posts. I get that authors often prefer multi-part posts because it generally results in more traffic, better odds of a post going viral on social media, etc., but I've always optimized this blog to be more like what I want to read than to maximize page views. In this case, it seems like the single-post version could easily be as long as a doorstop fantasy novel (for reference, Brandon Sanderson's Stormlight Archive books are said to be around 450k words), compared to this post with 3 exercises and maybe 7k words. I suppose I need 64 posts at that rate, and I'm only on 7, but there are certainly enough problems out there to write up 64 posts and it's just a question of making time for them.
[return]
23 WIRED-Approved Gifts for Frequent Travelers (2026)
Feed:
WIRED
(https://www.wired.com/feed/rss)
Published: 2026-07-29 11:34:00
|
Created: 2026-07-31 01:12:59
For the frequent flier who treats the Delta Sky Club like their second home.
show more
Qodana 2026.2: More Security, Better Coverage, Less Configuration
Feed:
The JetBrains Blog
(https://blog.jetbrains.com/feed/)
Published: 2026-07-29 13:47:03
|
Created: 2026-07-31 01:12:59

Qodana 2026.2 makes it easier for development teams to act on code quality, security, and compliance findings throughout the development workflow. This release introduces clearer code coverage insights for pull requests, highlights uncovered new lines directly in the IDE, and automatically detects coverage reports in common project locations – reducing the configuration required to get started.
The release also expands Qodana’s security offering with new inspections, support for custom security rules, post-quantum cryptography inspections, and publicly available SAST benchmarks through SABER. Laravel inspections are now enabled by default, while new License Audit quality gates help teams prevent newly introduced dependencies with prohibited or unknown licences from progressing through the pipeline. Let’s get into the details.
Better Code Coverage UX
Code Coverage for incremental analysis in the IDE
Starting with Qodana 2026.2, pull request analyses can show which changed or added lines are covered by tests and which are not, alongside the total coverage for newly added code, known as fresh coverage.
After the analysis, developers can open the report in the IDE and browse the files changed in the pull request. They can see which files lack coverage through statistics in the tool window, while new lines are highlighted in the IDE to reveal coverage gaps. Developers can use this information to write targeted tests for functionality that lacks coverage, improving the reliability of their software.
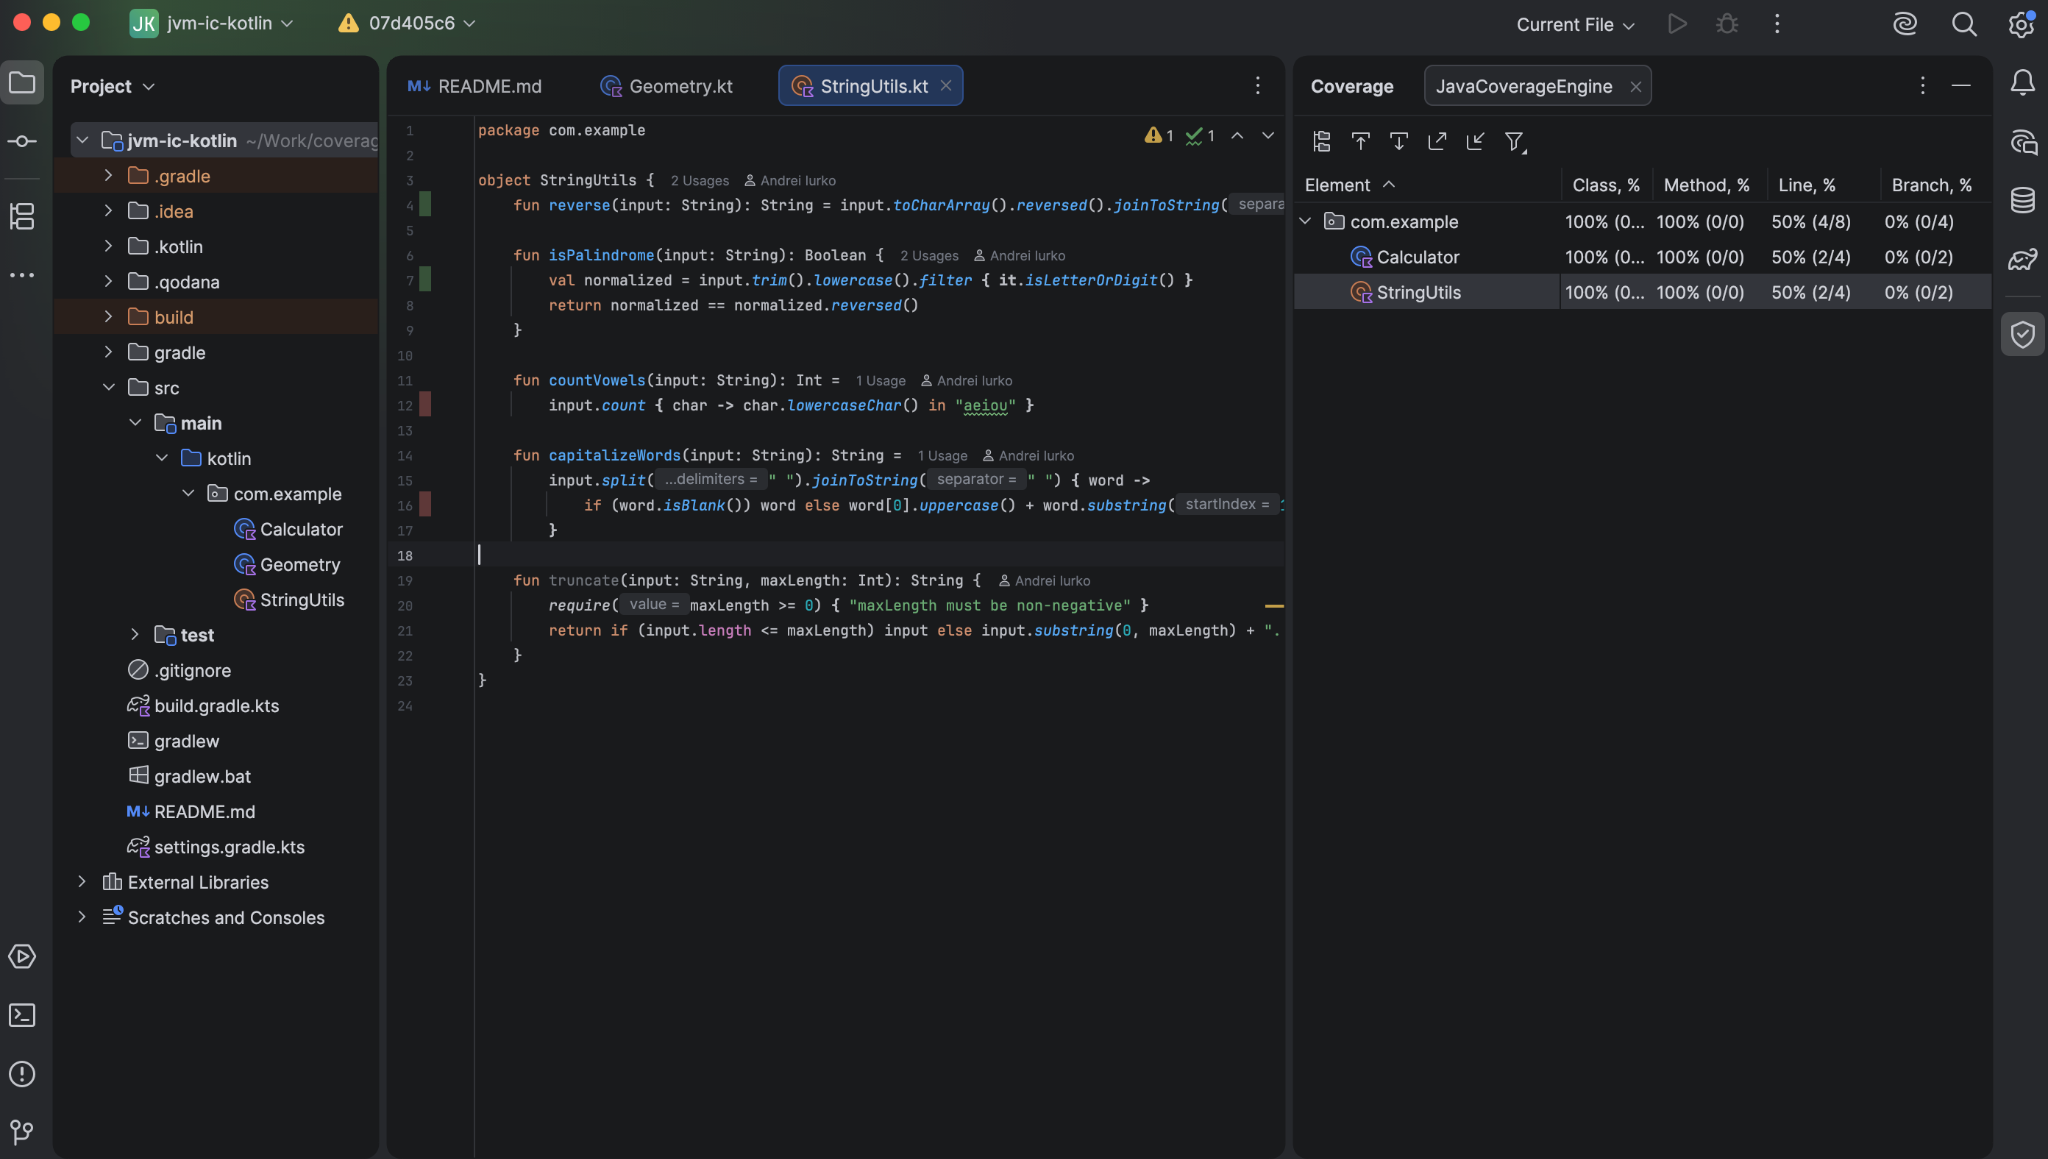
Out-of-the-box code coverage reporting
Showing code coverage results in Qodana now requires fewer configuration steps. You no longer need to copy all reports to the .qodana/code-coverage directory, which lets you simplify your build configuration.
Qodana 2026.2 automatically detects coverage reports in the project:
- Qodana for JVM and Qodana for Android: default paths for Jacoco and Kover plugins are supported for both Maven and Gradle
- Qodana for JS: default location
coverage/lcov.infois supported, as well as some common community locations likereportsortest-coveragedirectories - Qodana for PHP:
clover.xmlandcoverage.xmlfiles are supported in common in community locations, such as the project root,build/logs,reportsandcoverage - Qodana for Python:
coverage.xmlfile is supported in common locations like project root,coverage-reportsorreports - Qodana for Go:
coverage.outorcover.outfiles in root directory and other common directories likecoverage,reportsare supported - Qodana for .NET:
coverage.coberturaandcoverage.infofiles in project root or other common directories likecoverageorTestResultsare supported
To generate code coverage reports, set up one of the supported tools, and see your statistics in any run. To disable this behaviour, either selectively copy your reports to the .qodana/code-coverage directory, or specify your custom location using a new codeCoverageLocations parameter in your qodana.yaml file. See the documentation for an example of how to specify a custom directory. To disable coverage reporting, disable the corresponding inspection in your configuration.
New security inspections
Broader SAST and multi-file taint analysis
Qodana 2026.2 expands the security analysis available in the Qodana for .NET linter, helping teams detect a broader range of vulnerabilities in C#, JavaScript, and TypeScript code. The new inspections are enabled by default in the recommended profile and appear as standard Qodana findings within existing IDE, CI/CD, and reporting workflows.
The expanded inspection set combines two forms of analysis. Pattern-matching rules identify insecure coding practices within individual code locations, while taint analysis tracks untrusted data as it moves through an application, including across multiple files. This enables Qodana to detect vulnerabilities such as SQL injection, command injection, cross-site scripting (XSS), and path traversal.
Teams can also extend this coverage with their own security rules. Qodana for .NET now supports custom and third-party rules written in the OpenGrep format. Place these rules in the .qodana/opengrep directory at the project root, and Qodana will make them available as Qodana inspections.
The predefined rules are publicly available in the opengrep-sast-rules repository. Behind the scenes, pattern matching uses an open-source JetBrains fork of OpenGrep, while data-flow tracking is handled by Qodana’s own taint analysis engine. This gives teams access to the OpenGrep rule format and ecosystem while retaining Qodana’s multi-file analysis and developer workflows. Support will be extended to additional Qodana linters and languages (Kotlin/Java) in future releases.
The following example shows how Qodana detects a classic SQL injection vulnerability in the WebGoat.NET project. The taint trace follows untrusted input from Request[“productNumber”] to its use in an SQL query located in another file.
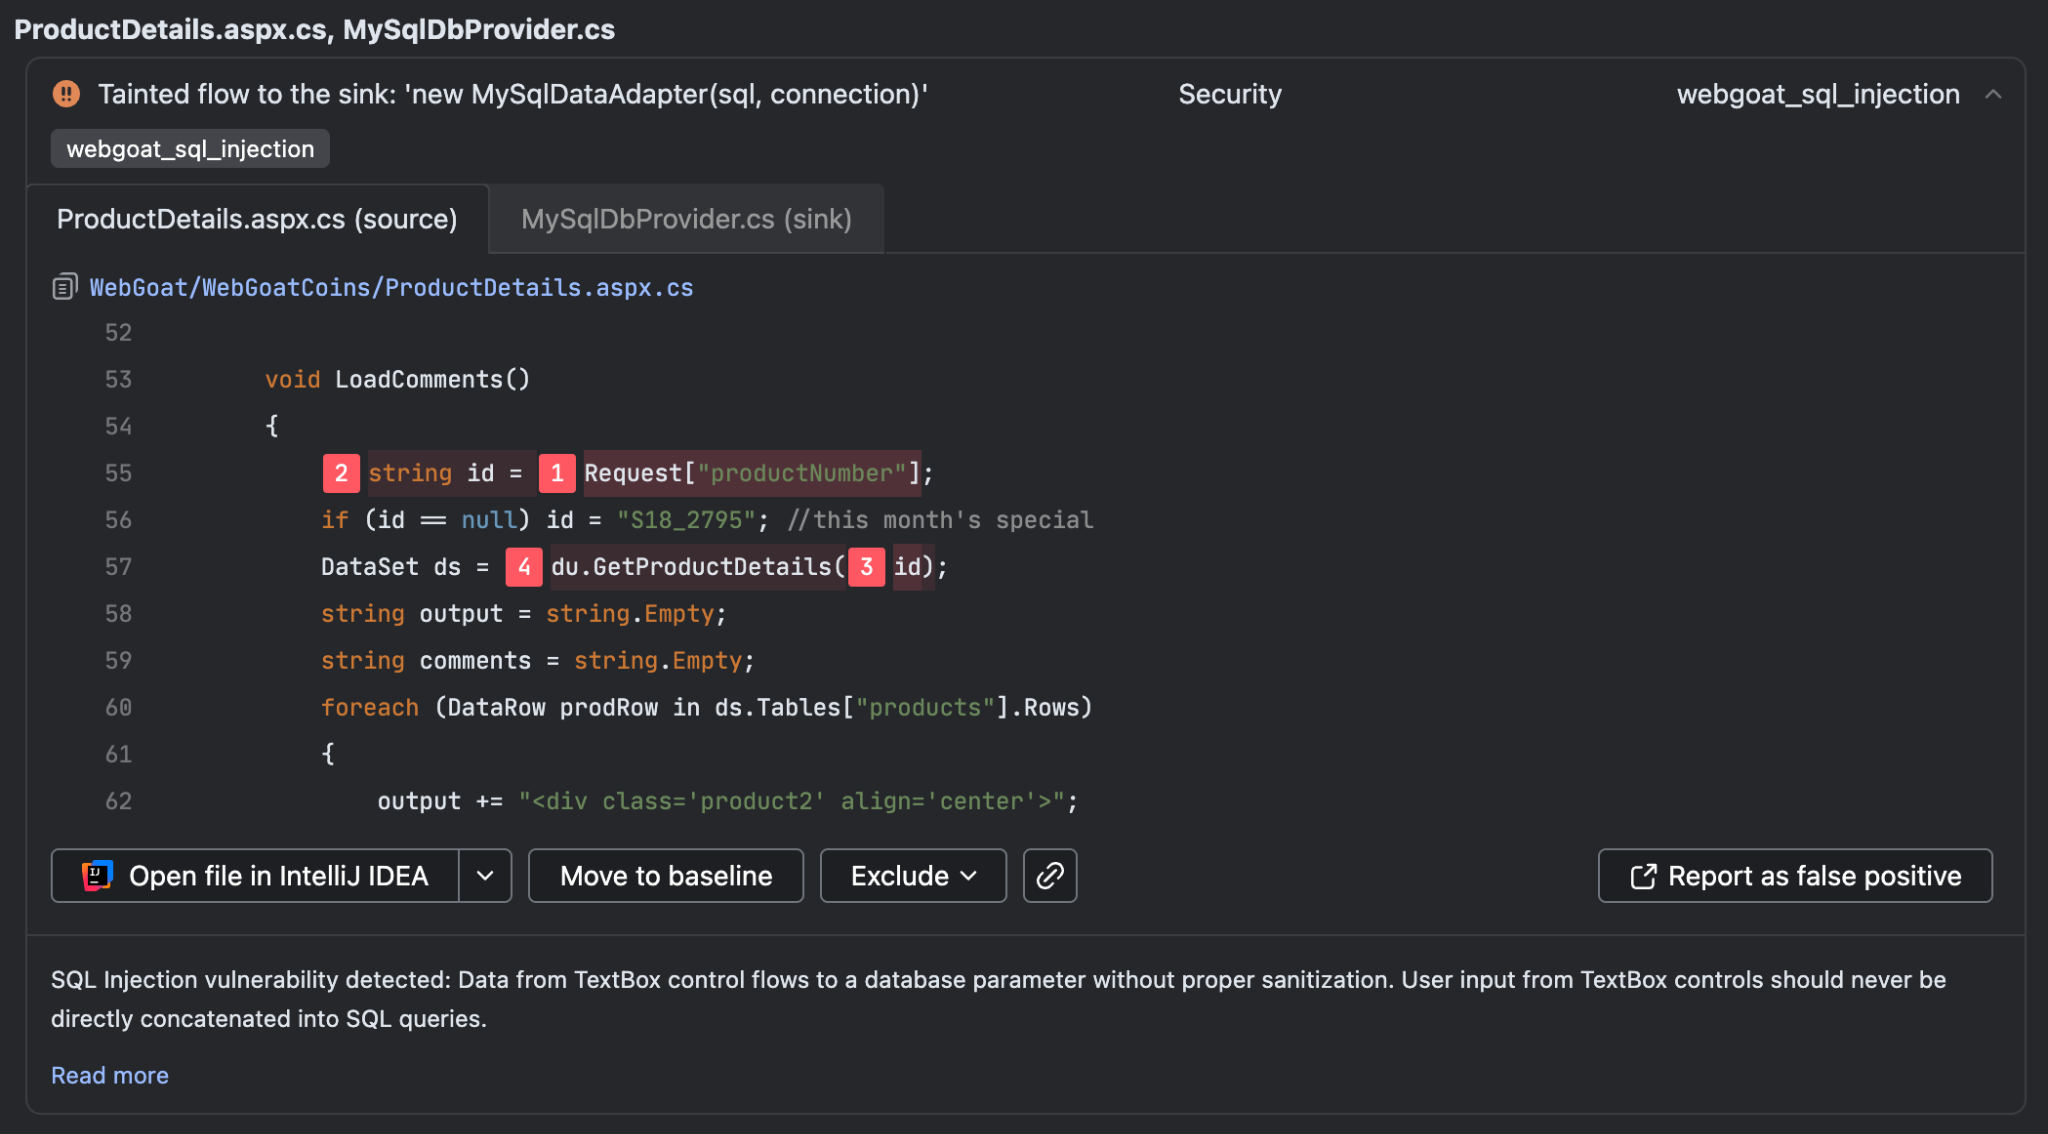
The taint trace begins with the untrusted user input in the Request[“productNumber”]
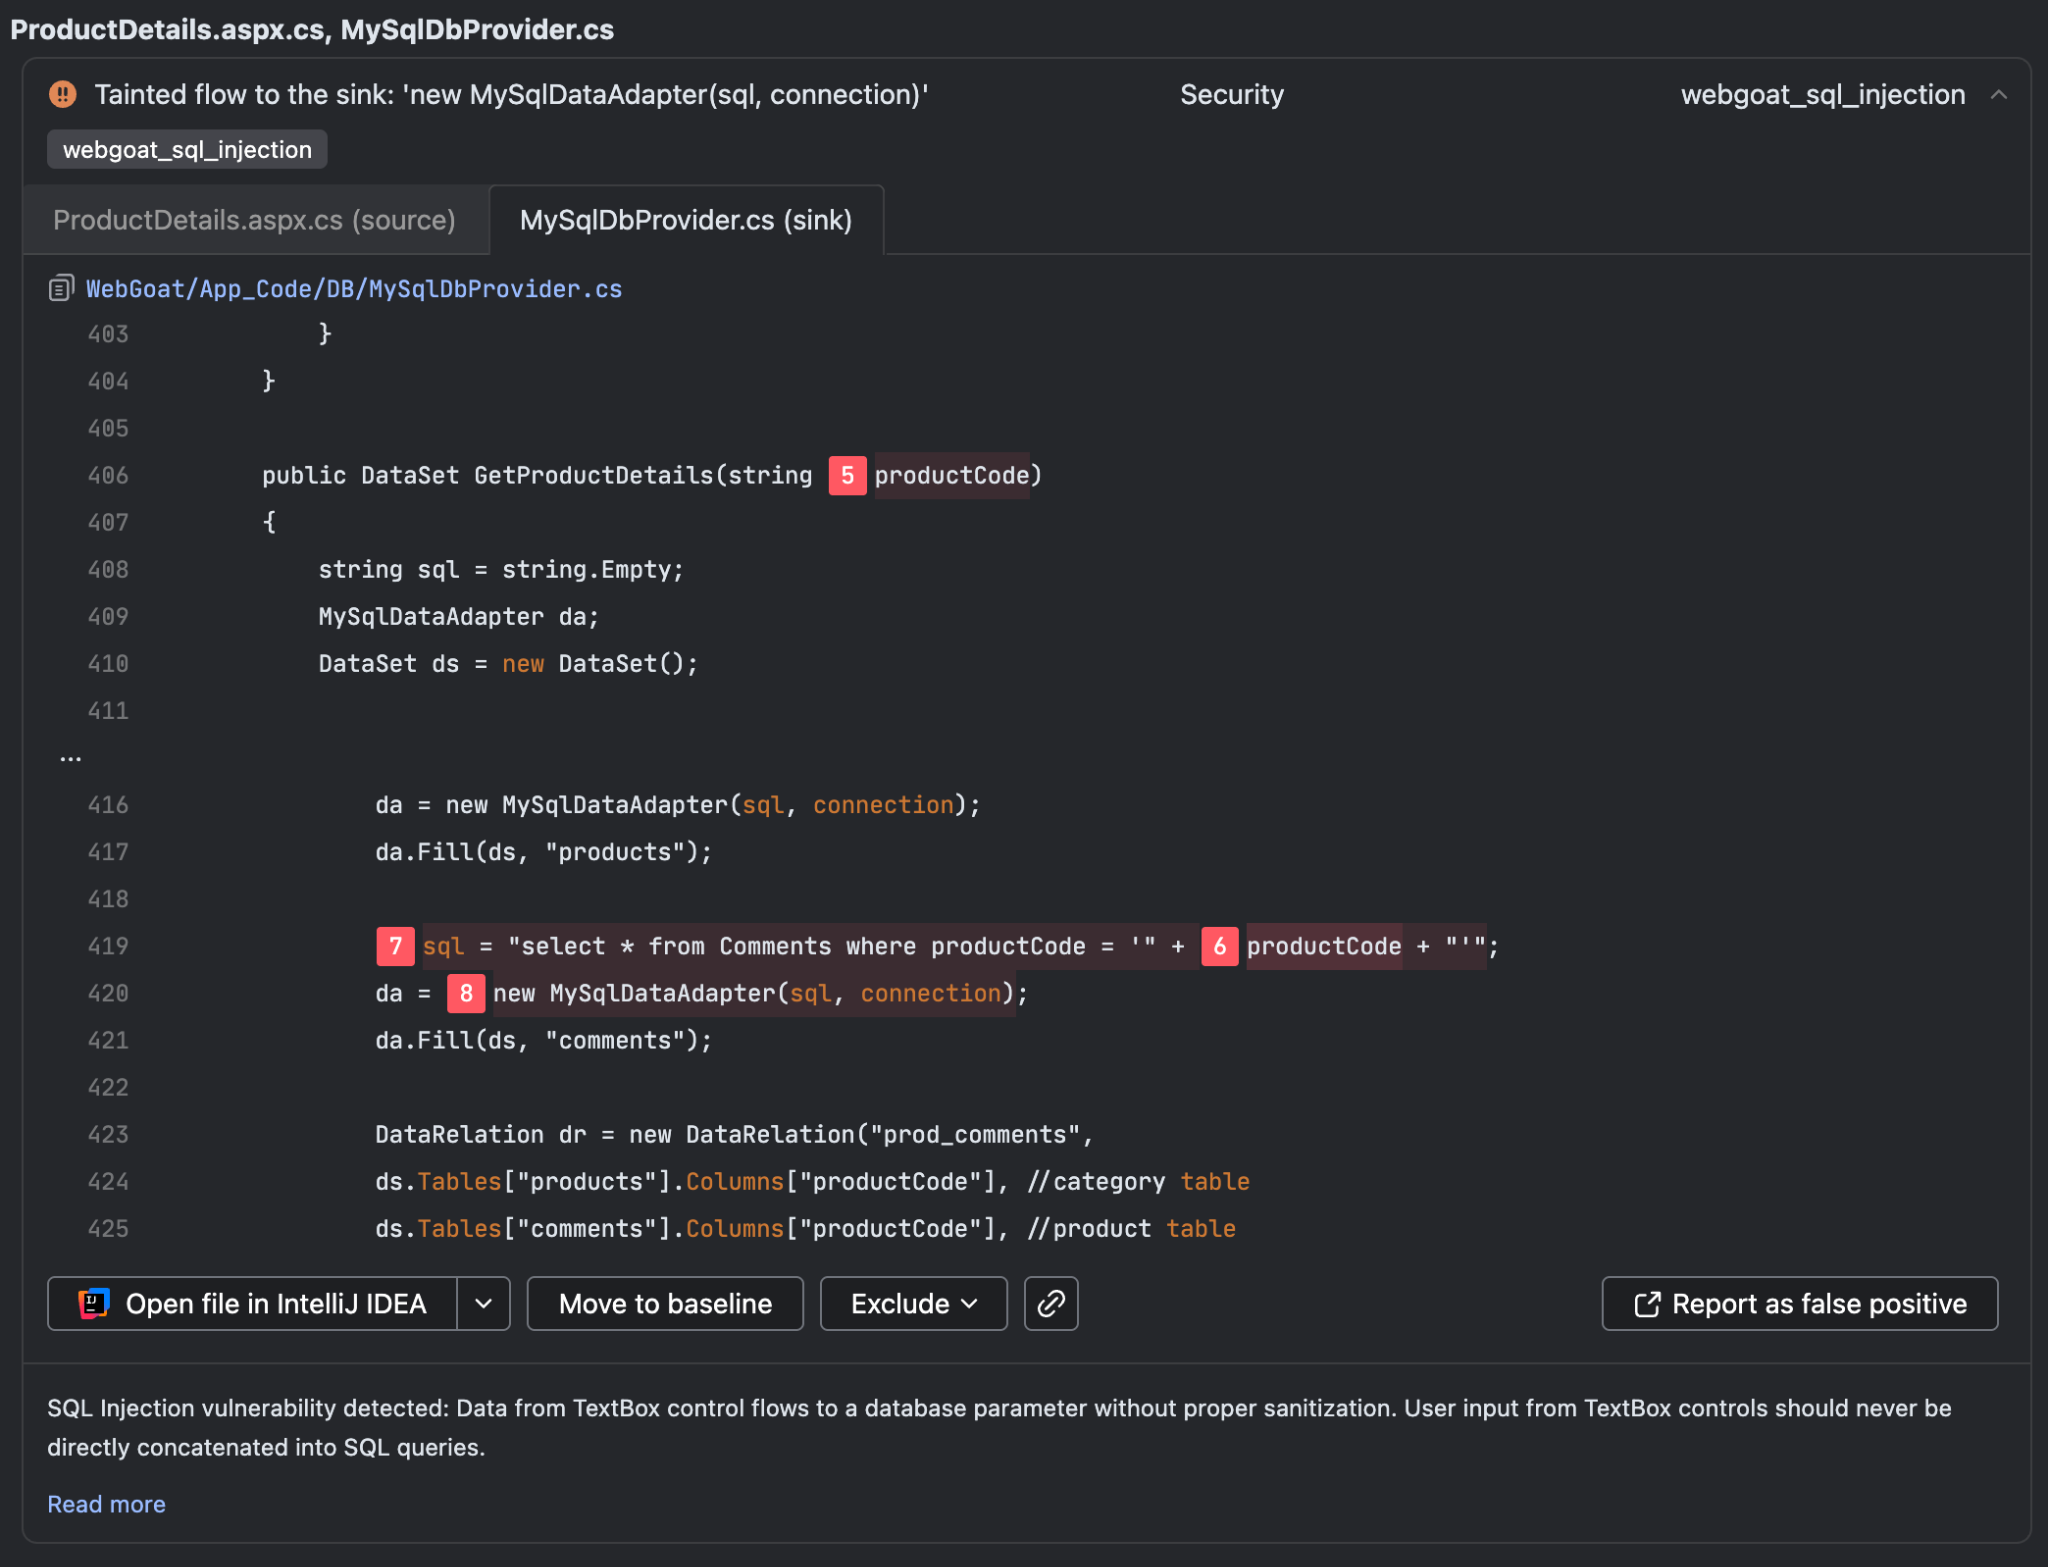
SABER – Static Analysis Benchmark Evaluation Runner
To make the performance of these inspections easier to evaluate, we have introduced SABER, the Static Analysis Benchmark Evaluation Runner. SABER runs Qodana against publicly available security benchmarks and compares its findings with known expected results.
Transparent SAST benchmarking with SABER
The current benchmark suite includes:
- CodeQL benchmarks for C# and JavaScript, built from CodeQL .expected files
- WebGoat.NET, using publicly available ground-truth data from Sonar
- The Qodana post-quantum cryptography demonstration project
The benchmark configurations, individual runs, and aggregated results are publicly available on the SABER TeamCity instance.
Guest access is enabled, allowing anyone to inspect the results and follow how Qodana’s SAST capabilities develop over time. It is available via this link. Guest access is enabled, so anyone can open it using the ‘Log in as guest’ option. We have a strong commitment to demonstrating SAST-related capabilities and continually improving them using industry-standard benchmarks. For example, this is the aggregated report for the currently available benchmarks:
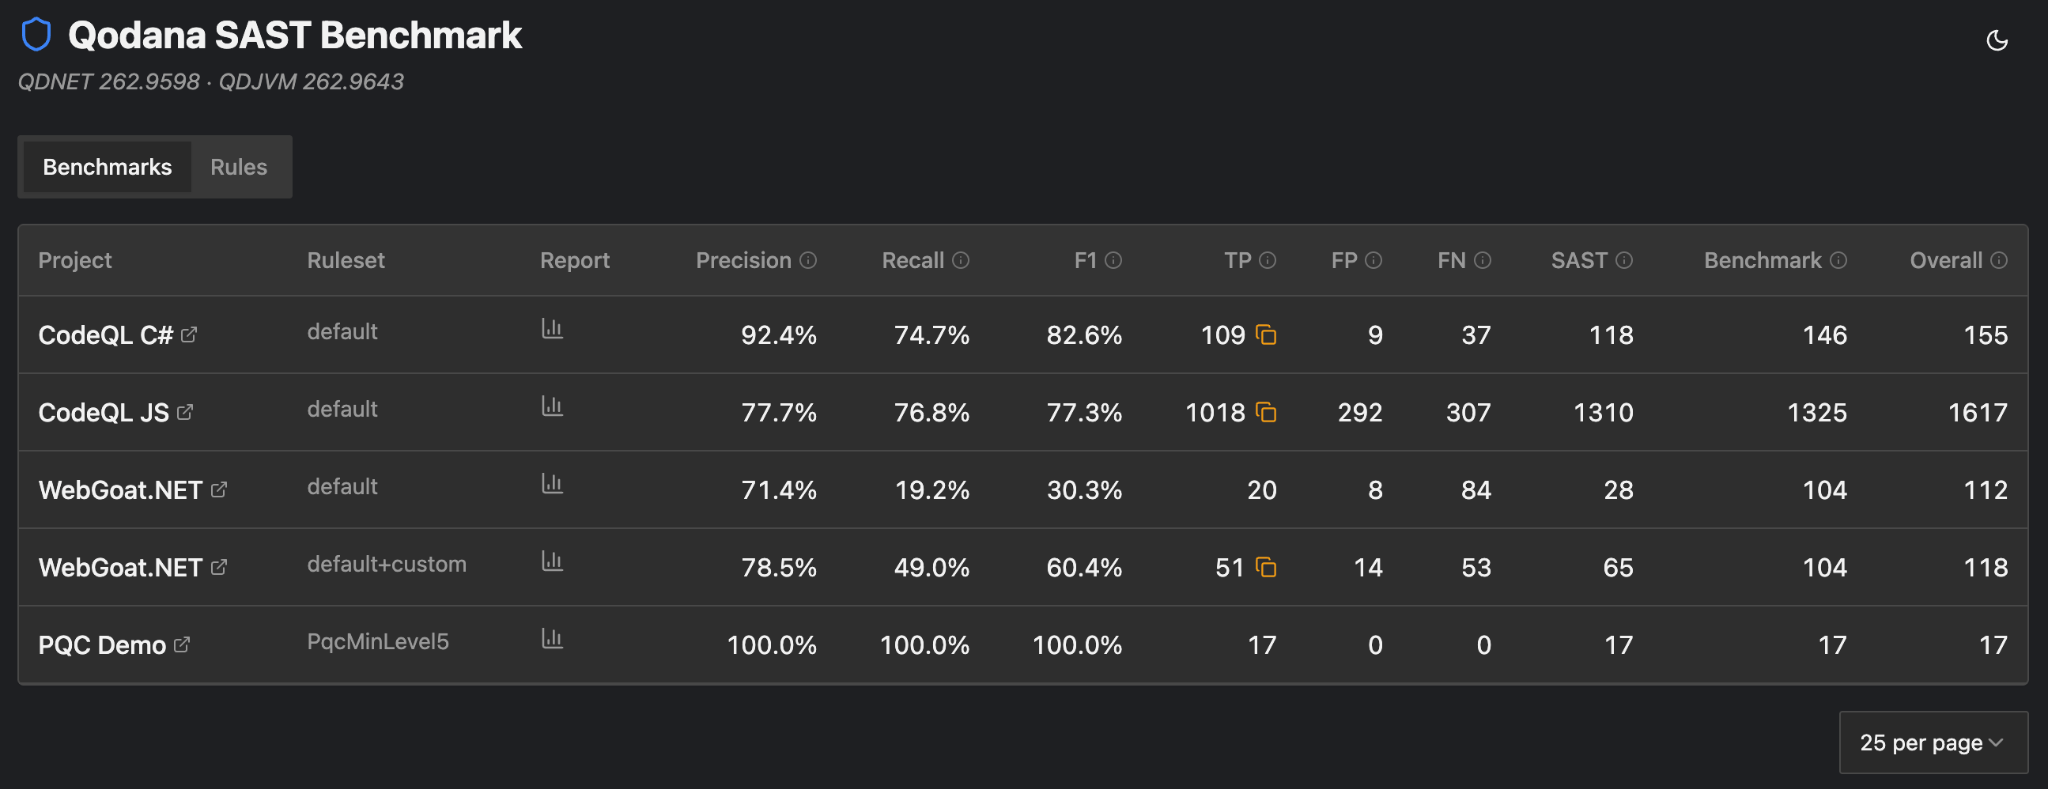
Projects ‘CodeQL C#’ and ‘CodeQL JS’ use the jetbrains-qodana/codeql-benchmark project that is built from the CodeQL ‘.expected’ files. Project WebGoat.NET is a well-known vulnerable C# project (our fork is here: jetbrains-qodana/WebGoat.NET) and uses the publicly available ground-truth.json as the expected results. The PQC demo project is a test project that demonstrates the capability to identify post-quantum cryptography issues in your code.
Post-Quantum Cryptography (PQC) inspections
If you have heard about quantum computation, you might know that it will, in the future, easily break many widely used public-key cryptographic algorithms (such as RSA and ECC). Even though quantum computation is not yet widely spread, you should be ready now because of the Harvest Now, Decrypt Later approach, in which future attackers might already harvest and store your encrypted data to decrypt it later.
Qodana for JVM now includes inspections that help developers identify affected code and guide them toward post-quantum cryptographic alternatives, reducing future security risk and supporting a gradual, manageable migration, helping organizations prepare for quantum-era security risks.
Our PQC inspections are implemented in accordance with NIST recommendations and are grouped into several priority levels (called PqcMinLevel1, PqcMinLevel2, and so on to PqcMinLevel5). To enable these inspections, activate one of the corresponding groups that represent NIST-based post-quantum readiness levels:
- Level 1 – Flag pre-quantum and legacy cryptographic algorithms. This uncovers the most critical vulnerabilities.
- Level 2 – Flag baseline post-quantum algorithms.
- Level 3 – Flag standard-strength post-quantum algorithms.
- Level 4 – Flag high-strength post-quantum algorithms.
- Level 5 – Flag all algorithms except those providing maximum security.
Every level includes all previous levels, so level 5 includes inspections from levels 1-4 as well.
We also prepared a demo project (PQC demo) that showcases PQC’s current capabilities. These inspections are backed by OpenGrep and taint analysis (described in the previous section), which also support excellent pattern matching and multifile taint analysis for Java and Kotlin, as shown in the example below.
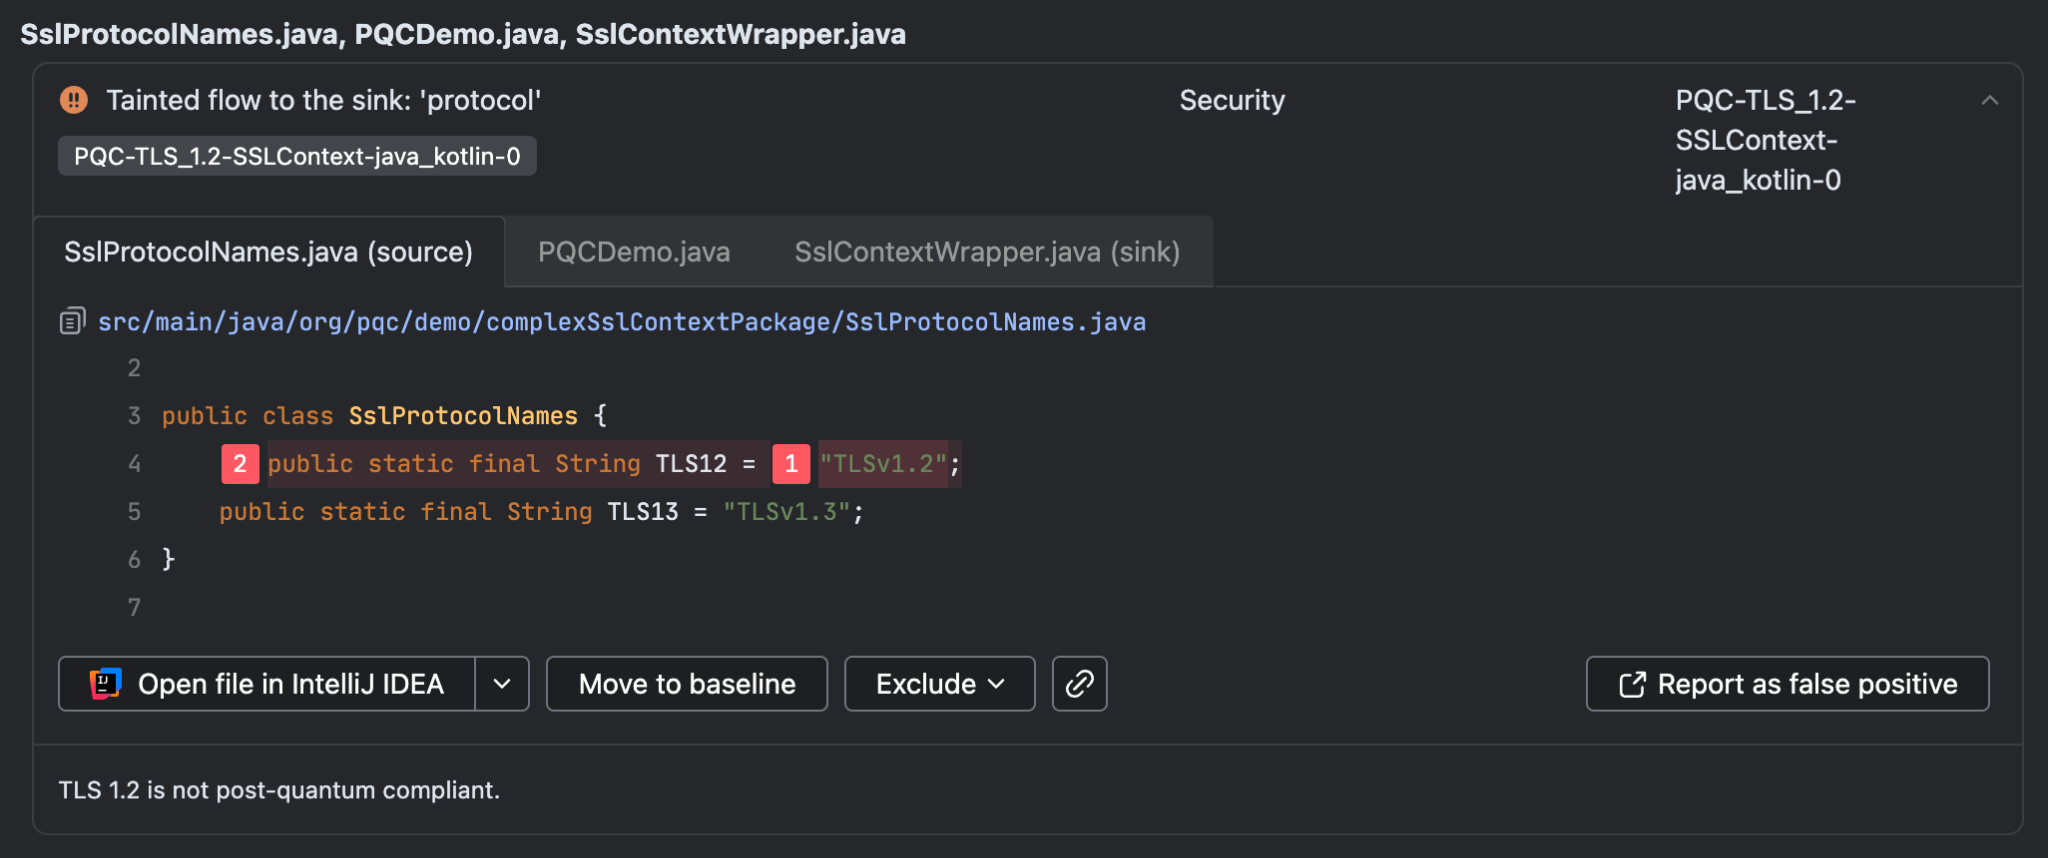
A non-compliant crypto protocol is found in a string constant
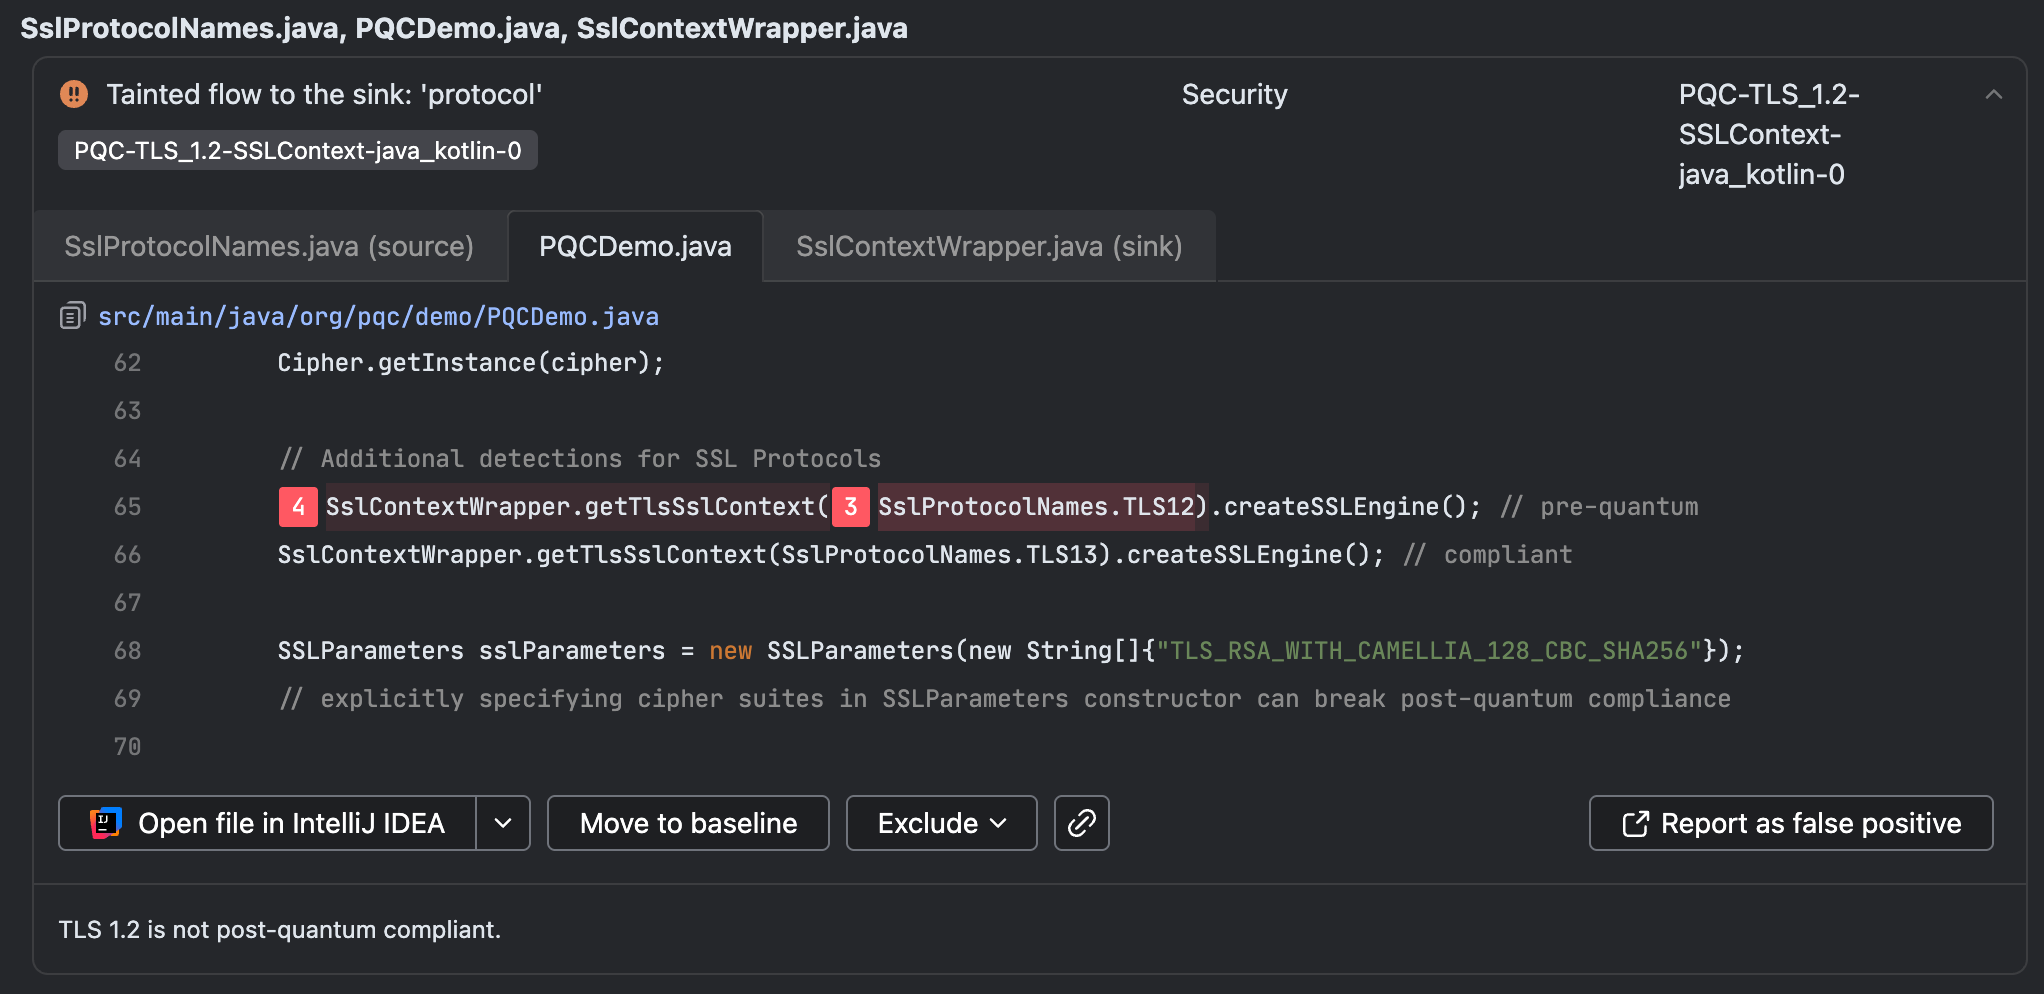
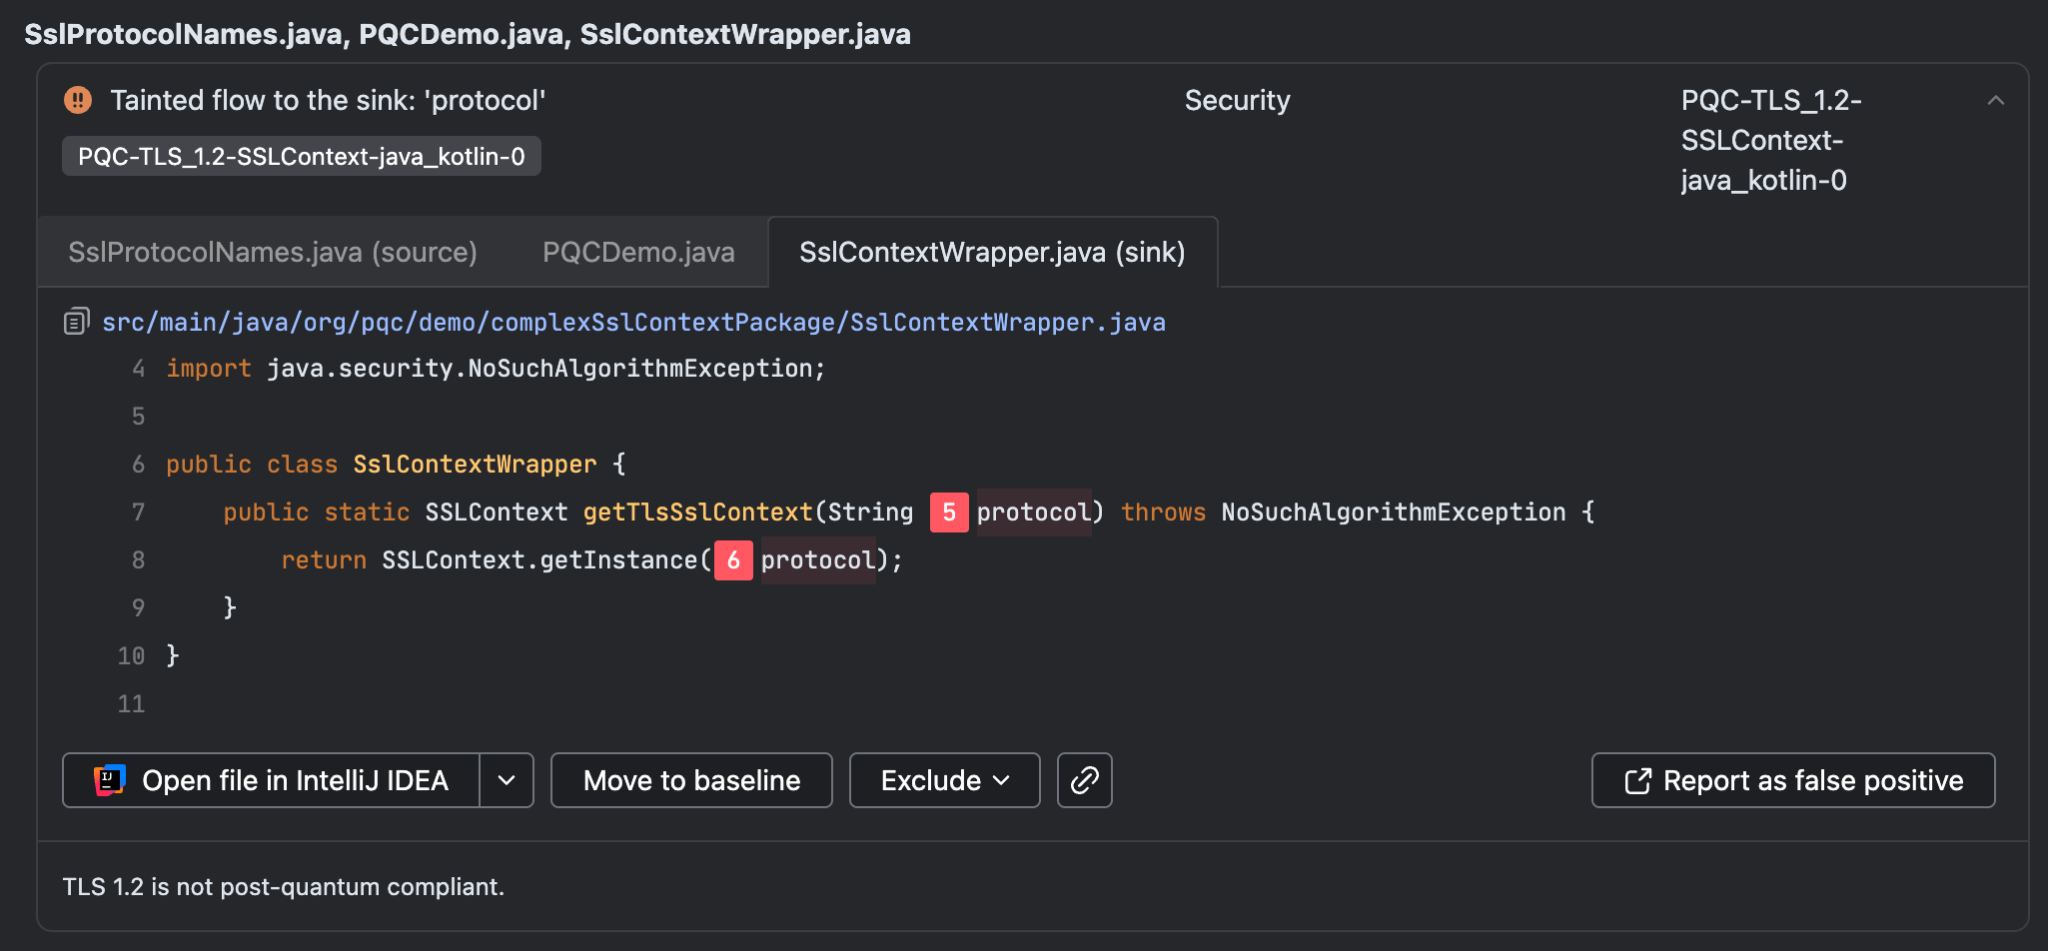
Laravel checks enabled by default
Qodana for PHP now includes Laravel code inspections. This reduces the number of false positives in PHP code, and analyses code for Laravel-specific code problems, such as directly assigning values to guarded attributes.
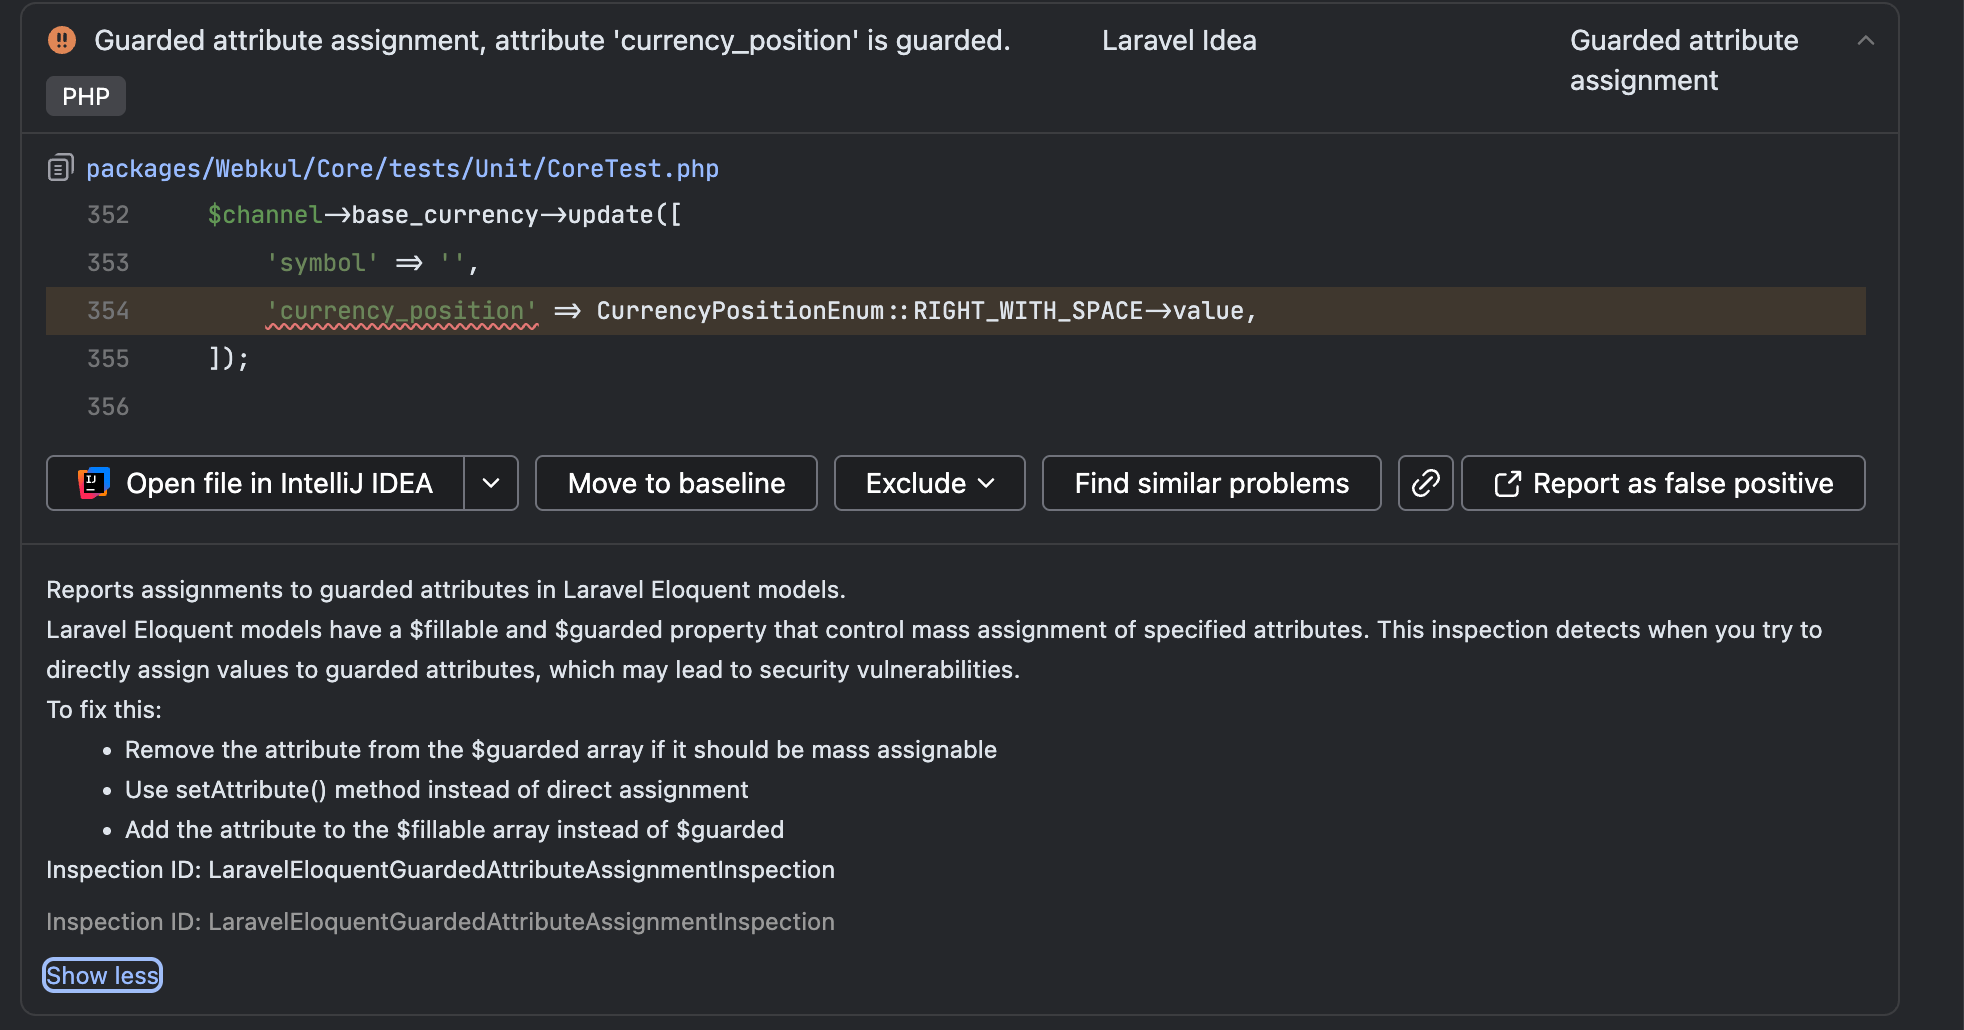
Quality gates on License Audit
Qodana 2026.2 adds support for license audit quality gates, with two new options:
failOnProhibited— fails the run if any dependency uses a license prohibited by your configured license rules.failOnUnknown— fails the run if any dependency has a license that couldn’t be detected or categorized.
For example, in qodana.yaml, the failureConditions section may now contain a dependencyLicenses block:
failureConditions:
  dependencyLicenses:
    failOnProhibited: true
    failOnUnknown: true
Qodana evaluates the quality gate against the collected dependency licenses directly, independently of whether License Audit problems are present as inspection results. Only the CheckDependencyLicenses inspection needs to be enabled.
License audit quality gates also work for incremental analysis, and only fail on new violations.
What to do next:
If you’re already using the latest release, you’re ready to start using the improvements in Qodana 2026.2 right away. If not, update to 2026.2.
For setup details and feature-specific guidance, head over to the documentation. If you’d like to see what Qodana can do in your own environment, try it on your project and explore the latest updates on the Qodana blog.
Request a demo if you’d like to learn more from our sales team or want 20% off when switching to Qodana from a comparable, commercial solution.
Oscar-winning songwriter Glen Hansard killed in crash
Feed:
BBC News
(http://feeds.bbci.co.uk/news/world/rss.xml)
Published: 2026-07-29 15:33:14
|
Created: 2026-07-31 01:12:59
Hansard, who was 56, won the best song Oscar for the 2007 low-budget musical film Once.
show more
Love It or Hate It, the Ferrari Luce Is a Thrilling Drive
Feed:
WIRED
(https://www.wired.com/feed/rss)
Published: 2026-07-29 12:00:00
|
Created: 2026-07-31 01:12:59
WIRED test-drove a preproduction version of the Luce, the storied Italian automaker’s controversial electric car, and it was remarkably surprising. Will it convert Ferrari fanatics?
show more
Why Republicans Can't Stop Talking About What James Talarico Eats
Feed:
TIME
(https://time.com/feed/)
Published: 2026-06-02 16:32:03
|
Created: 2026-07-31 01:12:59

Texas Republicans have nominated a Senate candidate with so many scandals to his name that an incumbent GOP Senator last month said that calling him ethically challenged was like saying serial killer cannibal Jeffrey Dahmer had an eating disorder. The GOP counter? The Democratic nominee is actually worse—a vegan.
As he claimed the Republican nomination last week, state Attorney General Ken Paxton derided Democrat opponent James Talarico as “Tofu Talarico” and “Low-T Talarico”—implying he suffers from low testosterone. A Fox News host recently called Talarico a "gay vegan” and President Donald Trump’s top adviser said Talarico is “clearly transitioning into a female.”
To set the record straight: Talarico eats meat and has a girlfriend. That isn’t stopping this line of attacks, which make clear that the GOP hopes to make one of the marquee midterm races a referendum on what it means to be a man.
The strategy is the most obvious example of something bigger going on. In states like Georgia and New Hampshire where Republicans hope to net seats, efforts are underway to make the race more about the personal traits of younger Democratic candidates than policy positions or relevant experiences. It’s a sign that, despite a year and a half of controlling every lever of the federal government, Republicans find themselves struggling to pitch a compelling narrative for continued dominance. The personal attacks suggest they fear a debate on merits is one they will have a tough time winning.
Nowhere is the ham-handed effort more evident than in Texas, where a blend of culture war grievance and incel-targeting rage have circled the sharp-witted but mild-mannered Talarico, whose campaign is shaping up to be a fundraising juggernaut. The race to define Talarico has almost nothing to do with the actual job of representing his state’s 32 million residents in the Senate. Instead, it’s rooted in Republicans’ framing of Paxton’s perceived masculinity—and Talarico’s perceived lack thereof because he was caught supporting a vegan local business and liking vegetarian breakfast tacos.
Within an hour of capturing an upset of a nomination over incumbent Republican Sen. John Cornyn, Paxton was doing his best to channel Trump’s name-calling bluster. “Six-Gender Jimmy,” and “James Tala-freak-o” both came from the podium as the state Attorney General with a fat oppo file pivoted to general-election mode.
Even though a Democrat hasn’t won statewide in Texas in decades, Republicans are still making something of a bet that the smart play is a narrow appeal to the manosphere. These Joe Rogan-types were a crucial voting bloc in Trump’s re-election bid. But it’s a strategy that risks backfiring against a candidate like Talarico, a white cisgendered man who held his own last year on Rogan’s podcast, so much that the host urged him to run for President.
To be sure, Talarico, a seminarian and state lawmaker, has been trying to walk back some of his past comments that have given Paxton and others fodder. Yes, Talarico previously said God is non-binary and that there are, in fact, six genders in terms of chromosomal combinations. Talarico has not softened on his support for transgender rights but has said his other comments were “cringey” in hindsight.
That has not stemmed some truly ugly rhetoric being hurled. Fox News personality Jesse Watters tried to make a funny when describing Talarico as a "gay vegan.” (Watters later said he was not being serious.) Watters’ co-host also questioned if Talarico was fabricating a girlfriend: “Does she live in Canada?” co-host Greg Gutfeld quipped. White House Deputy Chief of Staff Stephen Miller said Talarico is transgender. "He's clearly transitioning into a female," Miller said. "When Talarico goes in for a blood test, when he gets a physical, blood doesn't come out. Soy milk comes out."
Even the President has gotten in on the action. “He’s a vegan in Texas, and you can’t get elected as a vegan in Texas,” Trump told reporters.
Talarico, a steady and disciplined presence on the campaign trail, is responding to the attacks while staying on message. "I've been eating barbecue since before Ken Paxton's first indictment," he said, pointing to Paxton's 2015 indictment on federal securities-fraud charges. Talarico has started selling merchandise with the “Tala-freak-o” branding. And, just for good measure, his campaign confirmed the identity of Talarico’s girlfriend after Texas outlet Current Revolt published her name despite the campaign’s requests of other newsrooms to do the opposite.
That’s not to say Talarico is focused entirely on white papers. It’s just that his critique of Paxton is one rooted in his real record, one that includes felony securities fraud charges and being federally investigated—but never charged—for public corruption. “The most corrupt politician in America just became the Republican nominee for the United States Senate,” Talarico said almost immediately after Paxton prevailed. “For 50 years, megadonors and their puppet politicians like Ken Paxton have stolen from us, with their bribes, bailouts and billionaire tax breaks. Ken Paxton has gotten away with it. They’ve all gotten away with it. But that ends this year, in this state, in this race.”
In his updated standard campaign speech, Talarico distills the argument neatly: “I have a legislative record. Ken Paxton has a criminal record.”
Thus unfolds the next six months of competing pitches to the electorate: Republicans say the Democrat is a cultural mismatch; Democrats say the Republican is corrupt to his core. It may be the most revealing race of the midterms.
PyTorch Tutorial for Deep Learning
Feed:
The JetBrains Blog
(https://blog.jetbrains.com/feed/)
Published: 2026-07-29 16:18:55
|
Created: 2026-07-31 01:12:59
This is a guest post from Naa Ashiorkor, a data scientist and tech community builder.

Building intelligent systems that can see, hear, understand language, and make decisions was previously the domain of specialized researchers with massive computing resources only – today, deep learning has made this accessible to developers and data scientists across the world, bringing the ability to build, train, and deploy AI models within reach.
This accessibility can be credited to deep learning frameworks, and one such framework is PyTorch, which has rapidly become the prevailing choice across both research and industry. PyTorch is an open-source deep learning framework built in Python and designed to make building neural networks intuitive.
Curious about how neural networks actually learn? In this tutorial, you’ll build your first PyTorch model using the MNIST dataset in PyCharm and see it recognize handwritten digits in real time. Along the way, you’ll get familiar with tensors and understand the core workflow behind building deep learning models.
What is PyTorch?
PyTorch traces its roots to Torch, a scientific computing framework that used Lua; in 2016, researchers at Facebook’s AI Research Lab (FAIR), now Meta AI, reinvented it for Python, creating PyTorch, which is today a Linux Foundation community project.
By 2024, PyTorch had established itself as the most popular deep learning framework, with a 63% adoption rate in the model training space, used in over 70% of AI research implementations. In 2025, the PyTorch Foundation’s ecosystem grew to include large-scale projects such as vLLM, DeepSpeed, and Ray, all of which are governed independently.
The annual PyTorch Conference attracted more than 3,400 attendees and gained 16 new industry members, including Snowflake, Dell Technologies, and Qualcomm. Also, it is trusted in production by organizations such as Meta, Microsoft, OpenAI, and Tesla. For developers and data scientists looking to enter deep learning, PyTorch remains the most practical and widely supported starting point available today.
PyTorch was built on two foundations: GPU-accelerated tensor computation as a more powerful alternative to NumPy and an automatic differentiation engine for training neural networks.
From these foundations, PyTorch has grown into one of the most fully featured deep learning frameworks available. Its core features include:
- Dynamic computation graphs (define-by-run): As code executes, PyTorch builds computation graphs. These are maps of every mathematical operation your model performs: things like multiplying inputs by weights, adding biases, and applying activation functions. PyTorch needs to track these because training requires working backwards through all of those steps to calculate how much each weight contributed to the model’s error, so it knows how to adjust them to improve. Computation graphs allow the model structure to be modified during runtime and facilitate debugging using standard Python tools, making PyTorch ideal for research and experimentation.
- Pythonic and intuitive interface: PyTorch code is Pythonic, which reduces the learning curve. It uses standard Python control flow and clean, readable syntax, and it integrates well with Pythonic libraries.
- Strong GPU acceleration: PyTorch has seamless support for GPUs using CUDA. There is easy device switching and efficient tensor computations on GPUs. It also supports multi-GPU training.
- Autograd (automatic differentiation): There is a built-in autograd engine that automatically computes gradients. It tracks operations on tensors and enables backpropagation with minimal code.
- Rich neural network library: PyTorch provides a comprehensive module for building models. There are prebuilt layers, loss functions, activation functions, and a modular design for custom architectures.
- Extensive ecosystem: PyTorch is not just a framework – it is an ecosystem. There is a wide array of tools, even beyond the AI-specific libraries. Hence, an entire AI project can be managed under the Python umbrella from data collection to deployment.
- Model deployment support: PyTorch supports deploying models from research to production, with support for both mobile and edge deployments. What’s more, it also has TorchScript for optimized execution and ONNX export for interoperability.
- Broad community and industry adoption: PyTorch is backed by Meta, and it has a large and active community. Due to Python being one of the largest programming communities worldwide, PyTorch users benefit from shared knowledge, resources, and tools. There is extensive documentation and tutorials, and it is widely used in academia and industry.
For a broader perspective on how PyTorch and TensorFlow differ, and when to choose each, check out this blog post.
Why use PyTorch for deep learning projects?
PyTorch is at the core of the current deep learning ecosystem. In recent years, it has been the framework behind some of the most influential AI models, such as Meta’s Llama, OpenAI’s early GPT models, and Stable Diffusion. Today, it is a popular choice for AI research worldwide.
With a 63% adoption rate, PyTorch is the industry leader in model training, according to the Linux Foundation’s Shaping the Future Generative AI report. In academia, it is highly used in research paper implementations. It is preferred for research and development because of its intuitive design, which allows for easy experimentation and iteration.
Hence, researchers can develop novel architectures and test ideas simultaneously. PyTorch powers 85% of deep learning papers presented at top AI conferences.
PyTorch is a framework of choice due to its advantages:
- Debugging with PyTorch is straightforward and natural since it runs as ordinary Python. Due to its dynamic graphing and real-time execution, developers can test and make changes to models using standard Python tools like print statements and debuggers – no special setups or workarounds are required. This sets PyTorch apart significantly from static-graph frameworks, where errors mostly emerge at runtime, and it can be challenging to trace them back to their source.
- PyTorch is flexible due to its dynamic computation graph and intuitive API, so it is ideal for experimentation and rapid iteration.
- PyTorch has a thriving community. According to the PyTorch 2024 year in review, there were contributions from more than 3,500 individuals and 3,000 organizations in a single year, and its tooling ecosystem grew by over 25%. The community has built up a huge library of tutorials, pre-trained models, and extensions. In particular, Hugging Face’s Transformers library, built directly on top of PyTorch, is now the standard toolkit for NLP research and development.
Understanding PyTorch tensors
Understanding PyTorch requires an understanding of tensors. Every input, output, and model weight in PyTorch lives inside a tensor. Hence, tensors are not just a data format; they are the medium through which all computation flows.
Tensors are the core data structure in PyTorch. They are like n-dimensional arrays and matrices, but unlike regular arrays, tensors can be used on hardware accelerators like GPUs. Think of tensors as an extension of numbers we are already familiar with. A single number is a zero-dimensional tensor, a list of numbers is a one-dimensional tensor, and a table of numbers is a two-dimensional tensor. From there, you can add more dimensions to represent complex data like images, videos, or audio.
Neural networks accept tensors as input and generate tensors as output – even the parameters of a neural network, its weights and biases, are stored as tensors. For a visual explanation, you can watch a beginner-friendly video on tensors and deep learning:
Tensors are similar to NumPy arrays but can also run on GPUs or other hardware accelerators. Often, tensors and NumPy arrays can share the same underlying memory, meaning that data doesn’t need to be copied.
The main difference is what happens when the calculation gets serious. NumPy is for scientific computing on a CPU. PyTorch tensors can be moved and processed on GPUs in one line of code, allowing for massive parallel computation and providing significant speedups for the types of matrix multiplication common in deep learning.
This enables the kind of processing that makes training large neural networks possible.
There are basic operations with PyTorch tensors that are essential. You can view the full implementation in this GitHub repository.
Creating a tensor
The first thing you need to know is how to create a tensor. PyTorch gives you several ways depending on what your data looks like – you can build a tensor from an existing list, initialize one filled with zeros or ones as a placeholder, or generate one with random values as a starting point for a model’s weights.
import torch

# From a list
x = torch.tensor([1.0, 2.0, 3.0])

# Filled with zeros or ones
zeros = torch.zeros(3, 3)
ones = torch.ones(3, 3)

# Random values
rand = torch.rand(3, 3)

print(x)
print(zeros)
print(ones)
print(rand)
This code snippet demonstrates different ways to create tensors in PyTorch. A tensor is created from a Python list, alongside tensors filled with zeros and ones, and a tensor containing randomly generated values. The output displays the resulting tensor structures and values, illustrating common methods used to initialize tensors for deep learning workflows.
Basic arithmetic
Tensor arithmetic works element-wise, meaning PyTorch applies the operation across every value in the tensor simultaneously rather than looping through one by one. This is what makes tensors so fast – and it is also what makes GPU acceleration so powerful, since GPUs are specifically designed to run thousands of these operations in parallel.
a = torch.tensor([1.0, 2.0, 3.0])
b = torch.tensor([4.0, 5.0, 6.0])

print(a + b)
print(a * b)
print(a.sum())
print(a.mean())
This code snippet demonstrates common mathematical operations on PyTorch tensors. Two tensors are added and multiplied element-wise, while functions such as sum() and mean() are used to compute the total and average values of the tensor elements. The output displays the results of these operations, highlighting how PyTorch efficiently performs numerical computations on tensor data.
Reshaping
In deep learning, you will constantly need to reshape tensors – for example, flattening a 2D image into a 1D vector before passing it into a fully connected layer or reorganizing a batch of data to match what a model expects as input. PyTorch makes this straightforward with reshape(), which rearranges the data into a new shape without changing the underlying values.
x = torch.ones(6)
x_reshaped = x.reshape(2, 3)
print(x_reshaped.shape)
This code snippet demonstrates how to change the shape of a tensor using the reshape() function. A one-dimensional tensor of ones containing six elements is reshaped into a 2×3 tensor. The output shows the updated tensor structure, confirming that the data has been reorganized without altering its values.
Moving to GPU
By default, tensors are created on the CPU, but moving them to a GPU – where matrix operations can run orders of magnitude faster – takes just one line. This allows the same code to run on both GPU-equipped machines and machines that only have a CPU. It is good practice to check whether a GPU is available.
if torch.cuda.is_available():
   x = x.to("cuda")
This code checks whether a CUDA-enabled GPU is available using torch.cuda.is_available(). If a GPU is available, the tensor x is moved from the CPU to the GPU using .to("cuda"). This enables faster computation by leveraging GPU acceleration, which is especially useful for large-scale deep learning tasks.
Converting to and from NumPy
PyTorch and NumPy use nearly the same language, so switching between them is simple. Chances are you are already using NumPy somewhere in your pipeline – for loading data, preprocessing, or visualizing results.
PyTorch is designed to work alongside it seamlessly. You can convert between tensors and NumPy arrays in one line, and on the CPU, they even share the same memory, so there is no performance cost to switching between them.
import numpy as np

# Tensor to NumPy
tensor = torch.tensor([1.0, 2.0, 3.0])
numpy_array = tensor.numpy()

print("Original PyTorch tensor:")
print(tensor)

print("\nConverted to NumPy array:")
print(numpy_array)

# NumPy to Tensor
numpy_array = np.array([1.0, 2.0, 3.0])
tensor = torch.from_numpy(numpy_array)

print("\nOriginal NumPy array:")
print(numpy_array)

print("\nConverted to PyTorch tensor:")
print(tensor)
This snippet demonstrates interoperability between PyTorch and NumPy. A PyTorch tensor is first converted into a NumPy array using .numpy(), and then a NumPy array is converted back into a PyTorch tensor using torch.from_numpy(). The output shows that the values remain unchanged during the conversion process, highlighting seamless data sharing between the two libraries. This is particularly useful when integrating PyTorch models with NumPy-based preprocessing or analysis workflows.
Setting up PyTorch
PyCharm streamlines deep learning setup by integrating directly with Python environments and package management tools. One of its key strengths is its seamless integration with Jupyter notebooks and optional Google Colab support, allowing you to switch between local and cloud-based computation effortlessly.
Before creating the project, it is important to install uv, a fast Python package and environment manager, locally. This enables PyCharm to create and manage project-specific environments using uv directly from the Python interpreter settings.
The setup process begins by creating a new project, where a project-specific Python environment is configured through the Python interpreter settings. During this step, a uv-managed environment and a Jupyter notebook are selected, too, enabling an interactive development environment from the beginning.
Version control can also be initialized using Git within this same window. For a detailed guide on creating and working with Jupyter notebooks in PyCharm, refer to the PyCharm documentation.




Using Conda as an alternative
If a Conda environment is preferred, PyCharm supports Conda directly through the Python interpreter settings. A Conda environment can be selected when setting up the project, and PyCharm will manage it automatically. Refer to the PyCharm documentation for Conda environments for more details on configuring them.
Once the Conda environment is active, install PyTorch using the terminal:
conda install pytorch torchvision torchaudio pytorch-cuda=12.1 -c pytorch -c nvidia
For PyTorch development, I recommend PyCharm because it provides excellent support for Python, intelligent coding assistance, debugging, version control, integrated database management, and seamless Docker integration. Specifically for data science, PyCharm supports Jupyter notebooks and key scientific and machine learning libraries and integrates with tools like the Hugging Face models library, Anaconda, and Databricks.
Additionally, it is particularly well-suited for PyTorch development because it understands the framework and includes features for layer-by-layer inspection of PyTorch tensors, which is essential when exploring data and building deep learning models.
Beyond tensors, PyCharm allows you to set breakpoints in training loops, inspect tensor values, and step through model forward passes using the integrated debugger – which works naturally with PyTorch’s dynamic computation graphs.
Building neural networks with PyTorch
A neural network is a system of connected layers that learns patterns from data by adjusting its internal weights through training. In PyTorch, all of these layers are contained within a single module called torch.nn . Think of it as your construction toolkit, which gives you everything you need to assemble a network without writing low-level mathematical operations from scratch.
torch.nn comes with a library of predefined layers, such as nn.Linear for fully connected layers, nn.Conv2d for convolutional layers, and nn.LSTM for recurrent layers. Hence, you can focus on designing your network rather than implementing the math behind each layer. It provides all the building blocks needed to build your own neural network.
Every module in PyTorch subclasses nn.Module. As a neural network is itself a module that consists of other modules (layers), this nested structure allows for easily building and managing complex architectures.
When you build a neural network in PyTorch, you create a Python class that inherits from nn.Module and implements two core methods:
__init__() –where you define your layers.forward() –where you define how data flows through those layers.
PyTorch’s autograd system automatically builds the computation graph based on the operations performed in the forward method, enabling automatic differentiation. The backward method, which handles gradient computation, typically does not need to be implemented manually. That means PyTorch handles the math behind gradient calculations, so you can focus on building.
Model building involves more than understanding the code. There are practicalities that need to be considered.
- Constant iteration. There is a very high probability that your first model will not perform well. That is normal because deep learning is an experimental process that involves adjusting layers, activation functions, and hyperparameters until the model improves.
- Simplicity first, then complexity. A two-layer feedforward network is always a good starting point. It is advisable to add complexity, such as additional layers and different architectures, when it is clear that the simple model is insufficient.
PyCharm makes model building easier thanks to its integrated debugger. You can set breakpoints inside your forward method, inspect tensor values at each layer, and add step-throughs of your model pass by pass, which drastically reduces the time it takes to identify and fix problems.
Build your first PyTorch handwritten digit classifier
In this section, you will build a simple neural network in PyTorch that can recognize handwritten digits from the MNIST dataset. You will work through the complete workflow, starting from raw image data; you will prepare and normalize the dataset, define a neural network, train it to recognize digits, and evaluate how well it performs on test data.
Along the way, you will explore key deep learning concepts such as tensors, layers, activation functions, loss functions, optimization, and training loops, while using PyCharm to inspect and understand what happens inside the training loop.
In deep learning, image classification is a foundational task, in which a model learns to assign a label to an image based on its visual content. In this example, we’ll use image classification on the MNIST database of handwritten digits, a classic benchmark in computer vision that consists of 28 x 28 grayscale images of handwritten digits from 0 to 9.
It is small and well-structured, and using it as an example gives us the opportunity to focus on understanding the core building blocks of deep learning. The aim is to build a neural network using PyTorch that can accurately recognize and classify these digits.
The complete source code for this project is available in the accompanying GitHub repository.

Preparing the data
Before training any model, the data needs to be loaded, cleaned, and formatted so PyTorch can work with it efficiently. PyTorch provides two classes that handle this:
Datasetdefines how individual samples are accessed and returned.DataLoadertakes aDatasetand handles how data is fed into the model during training, including batching, shuffling, and parallel loading.
As these components are configured, PyCharm helps streamline development through features such as code completion, automatic import suggestions, parameter hints, and quick documentation.
Hovering over PyTorch classes and functions shows usage information, and pressing Ctrl+Q opens detailed documentation directly within the IDE. Hence, it is easier to explore PyTorch APIs and correctly configure data loading and preprocessing steps without frequently switching to external documentation.
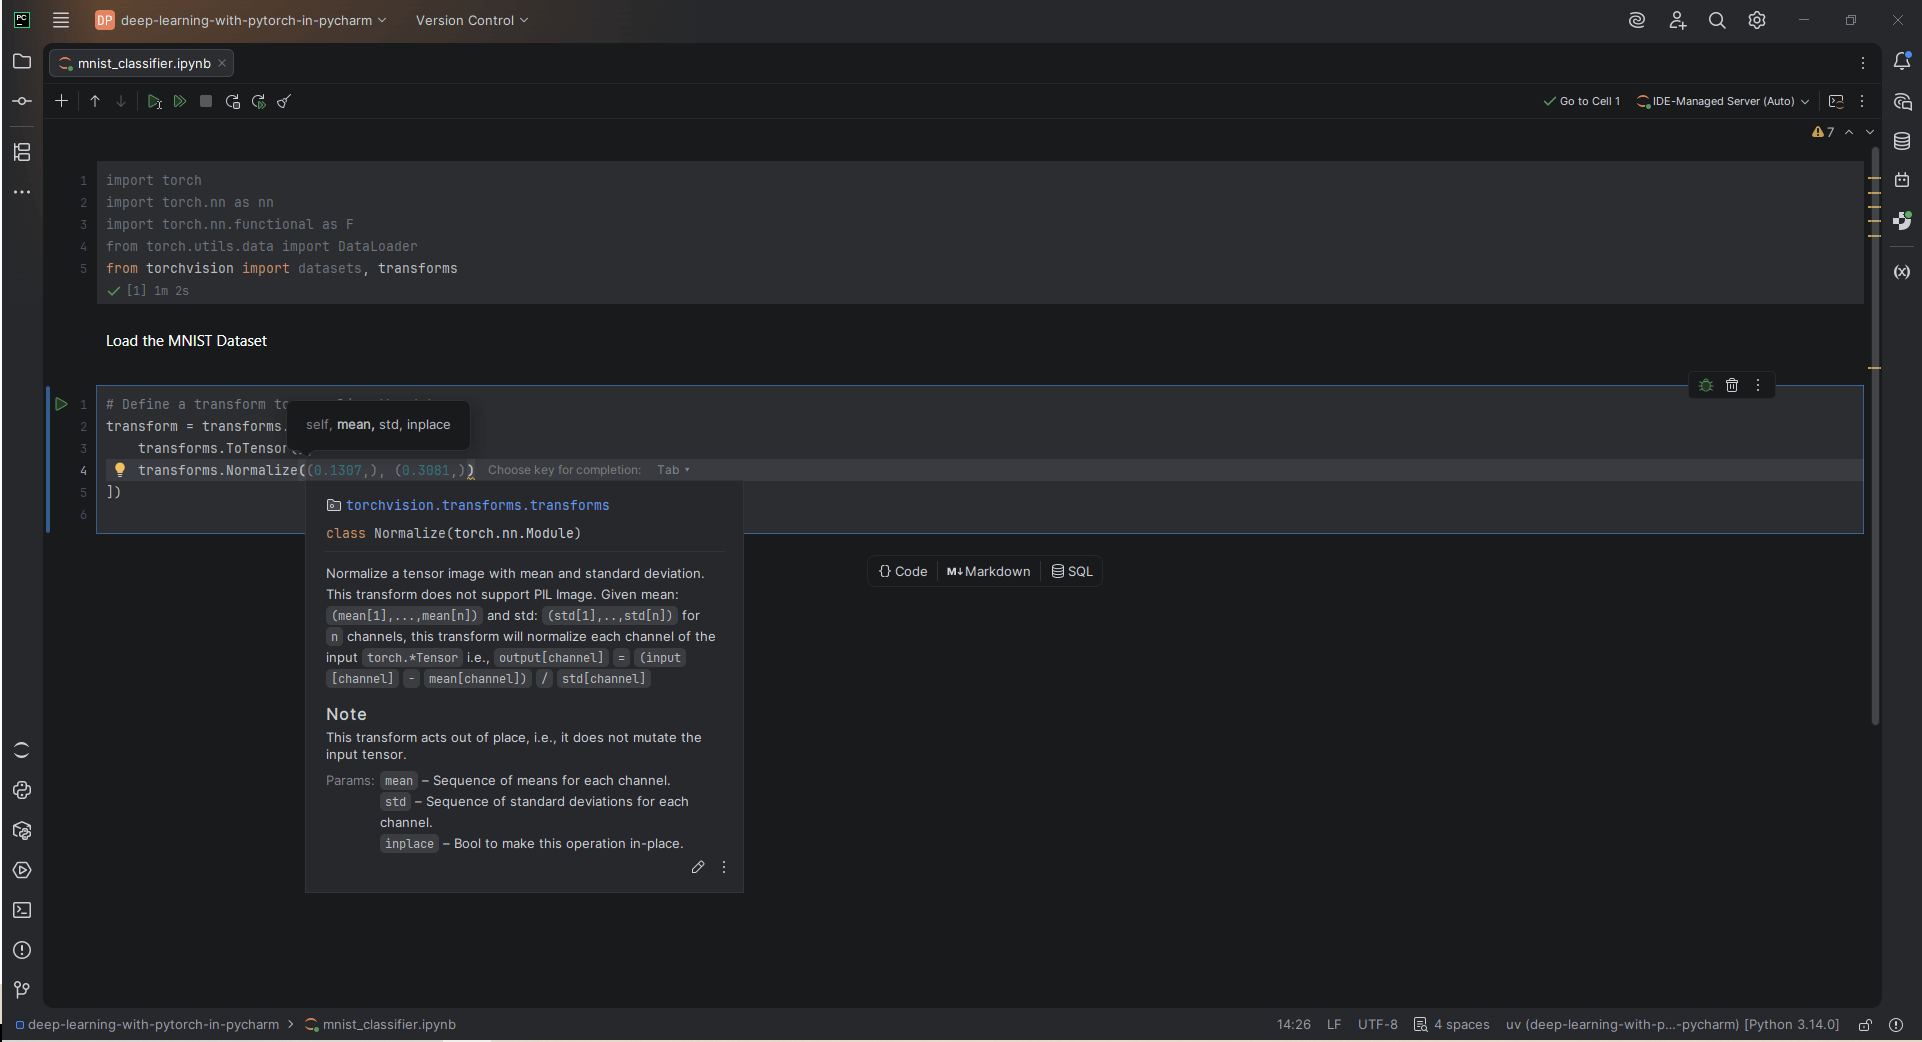
transforms.Normalize() is typed, PyCharm displays the function signature and parameter information directly in the editor, helping developers configure data preprocessing steps more efficiently without referring to external documentation. Loading and normalizing the data
Before training a neural network, the input data needs to be normalized so that the pixel values are scaled into a consistent range. This helps improve stability by keeping input values centered around zero and ensuring that gradients behave more predictably during optimization.
# Download and load the training data
train_data = datasets.MNIST(
   root='./data',
   train=True,
   download=True,
   transform=transform
)
The code snippet above downloads the MNIST dataset (if needed), loads the training images, and applies preprocessing so that the data is ready to be used in a neural network.
In this project, MNIST images are normalized as part of a preprocessing pipeline using PyTorch transforms:
transforms.ToTensor()converts images from pixel values (0–255) into floating-point tensors scaled to 0–1.transforms.Normalize((0.5,), (0.5,))then rescales these values to approximately -1 to 1, which helps stabilize training by keeping input values centered around zero and improving gradient behavior during optimization.
PyTorch also provides key data-loading parameters to control how training data is processed:
batch_size=64means the model processes 64 images at a time instead of the full dataset. This improves memory efficiency and makes training more stable by allowing gradient updates on mini-groups of data rather than individual samples or the entire dataset.shuffle=Truerandomizes the order of images each epoch, so the model does not memorize the sequence.download=Truemeans PyTorch fetches MNIST automatically on the first run, so you do not need to download anything manually.
Defining the model
After the data is ready the next step is to build the neural network that will learn from it. The goal of the model is to take an input image of a handwritten digit and predict which digit (0–9) it represents. Each MNIST image is 28×28 pixels. Since the model cannot directly interpret images the way humans do, we first flatten each image into a single vector of 784 values (28 x 28 = 784). This converts the 2D image into a format the model can process.
The input layer takes the 784 pixel values and passes them through fully connected layers. Each layer learns weighted combinations of features that become increasingly useful for distinguishing digits. While these representations are not explicitly interpretable, the network gradually learns patterns that help separate different classes.
To help the model learn effectively, we use an activation function called ReLU, which allows the network to capture non-linear patterns that are essential for understanding images.
class SimpleNetwork(nn.Module):
   def __init__(self):
       super(SimpleNetwork, self).__init__()
       self.fc1 = nn.Linear(784, 128)  # 28x28 = 784 input pixels
       self.fc2 = nn.Linear(128, 64)   # hidden layer
       self.fc3 = nn.Linear(64, 10)    # 10 outputs (digits 0-9)


   def forward(self, x):
       x = x.view(-1, 784)             # flatten the image
       x = F.relu(self.fc1(x))
       x = F.relu(self.fc2(x))
       x = self.fc3(x)
       return x


model = SimpleNetwork()
print(model)
When you run the code, PyTorch prints the structure of the model:
SimpleNetwork(
  (fc1): Linear(in_features=784, out_features=128, bias=True)
  (fc2): Linear(in_features=128, out_features=64, bias=True)
  (fc3): Linear(in_features=64, out_features=10, bias=True)
)
The output shows the structure of the neural network. Each Linear layer represents a fully connected layer in the model. The first layer transforms the 784 input pixels into 128 features, the second reduces them to 64 features, and the final layer outputs 10 values representing the digit classes (0–9). This confirms that the model has been correctly defined before training begins.
Using the Jupyter console to inspect data and validate the neural network
One of the features that makes PyCharm Pro especially useful for PyTorch development is the integrated Jupyter console. It connects directly to the running notebook kernel, allowing you to inspect tensors, explore datasets, test model outputs, and debug code interactively without adding temporary cells to the notebook. This streamlines the iterative workflow and makes it easier to validate code during model development.
To access the Jupyter console, first ensure that your Jupyter notebook is running. Then click Open Jupyter Console in the notebook toolbar at the top of the editor.
Additionally, PyCharm provides a Variables view that displays all active objects in the notebook kernel, allowing quick visual inspection of shapes, values, and types, and reducing the need for repeated print statements.
Together, these tools make it easier to inspect data and validate model behavior before training.
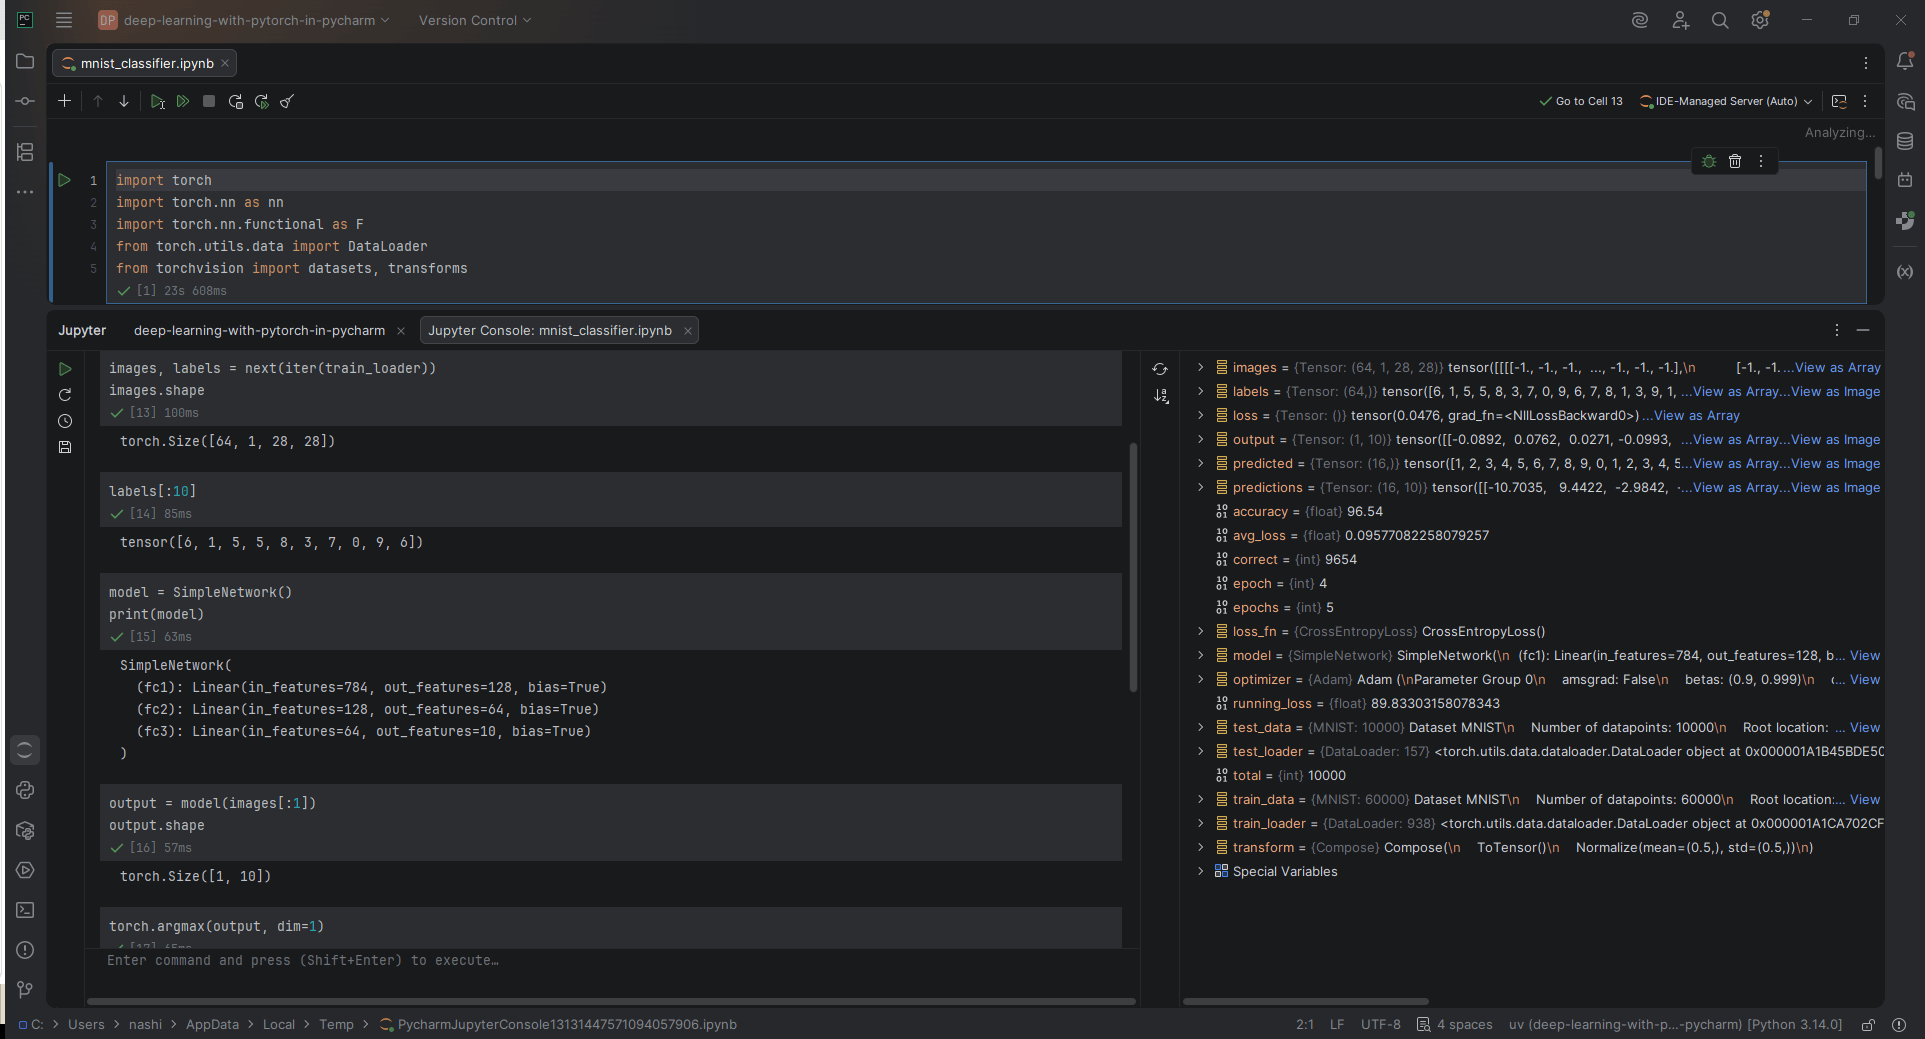
Training the model
Choosing a loss function and optimizer
Now that the model is defined, the next step is to train it so it can learn to recognize handwritten digits. During training, the model processes MNIST images, makes predictions, compares them to correct labels, and gradually improves its performance. To do this, we first need two key components: a loss function and an optimizer.
The loss function measures how far the model’s predictions are from the correct answers. In classification problems like MNIST (which has 10 classes, one for each digit), CrossEntropyLoss is used because it is designed for multi-class classification, and it not only penalizes incorrect predictions but also takes into account how confident the model is when it makes a mistake.
The optimizer is responsible for updating the model’s weights based on the loss. It determines how the model learns from its errors.
We also need to select an optimizer. Adaptive moment estimation (ADAM) and stochastic gradient descent (SGD) are two examples of these – they take the loss and adjust the model’s weights to do better next time.
The difference is how they do it. SGD updates model weights using a fixed learning rate applied to the computed gradients. ADAM extends this idea by adapting the learning rate for each parameter using estimates of past gradients, which often leads to faster and more stable convergence with less manual tuning. For this project, ADAM is the practical choice, with lr=0.001 as a safe default learning rate. SGD is worth exploring later when you want more control over the training process.
Implementing a training loop
The training loop is the core of the learning process. Each full pass through the training data is called an epoch. Training typically runs for multiple epochs so that the model can gradually improve its performance over time.
Each epoch is made up of smaller units called batches. Instead of processing the entire dataset at once, the model processes one batch at a time, which makes training more efficient and memory-friendly.
During each epoch, the model processes data in batches and repeats the same steps:
- Forward pass: The model makes predictions (logits).
- Loss computation: The model compares predictions with true labels.
- Backward pass: The model computes gradients of the loss.
- Weight update: The optimizer adjusts model parameters.
There are a few important implementation details to note when it comes to this section:
model.train()switches the model into training mode and must be called at the start of each epoch.optimizer.zero_grad()must be called beforeloss.backward()every iteration because, without it, PyTorch accumulates gradients from previous batches, which corrupts the updates. This is one of the most common beginner mistakes in PyTorch.loss.item()converts the loss tensor into a Python number for logging. This detaches it from the computation graph, ensuring it is not tracked for gradients.
The code below implements the training loop and prints the loss at the end of each epoch:
# Define loss function and optimizer
loss_fn = nn.CrossEntropyLoss()
optimizer = torch.optim.Adam(model.parameters(), lr=0.001)

# Training loop
epochs = 5

for epoch in range(epochs):
   model.train()
   running_loss = 0

   for images, labels in train_loader:
       # Forward pass
       predictions = model(images)
       loss = loss_fn(predictions, labels)

       # Backward pass
       optimizer.zero_grad()
       loss.backward()
       optimizer.step()

       running_loss += loss.item()

   avg_loss = running_loss / len(train_loader)
   print(f"Epoch {epoch+1}/5 — Loss: {avg_loss:.4f}")
The output below shows the model’s training progress over five epochs, with the loss steadily decreasing as learning improves.
Epoch 1/5 — Loss: 0.4014
Epoch 2/5 — Loss: 0.1937
Epoch 3/5 — Loss: 0.1364
Epoch 4/5 — Loss: 0.1116
Epoch 5/5 — Loss: 0.0957
Debugging the training process using the PyCharm debugger
While basic Python debugging is available in PyCharm, the PyCharm Pro subscription extends this capability by providing full support for debugging Jupyter notebooks and interactive machine learning workflows.
During model training, breakpoints can be set inside key stages of the training loop, such as the forward pass, allowing execution to pause while the notebook remains interactive. For the MNIST handwritten digit classification project developed in this tutorial, the breakpoint was placed on: predictions = model(images).
This marks the start of the forward pass, in which a batch of input images is passed through the neural network to generate predictions. Pausing execution immediately before this line makes it possible to inspect the input data before the model processes it and then examine the model’s outputs after stepping over the line. This provides a clear view of how data flows through the network during training.
In the PyCharm debugger, the Watches pane lets you monitor custom expressions whenever execution pauses at a breakpoint. Rather than repeatedly evaluating expressions manually, watches automatically refresh their values after each debugging step, making it easier to inspect tensors and verify intermediate results throughout the training process.
For this project, the following watches were added:
images.shape, to verify the dimensions of each input batch.labels.shape, to confirm that the batch of labels corresponds to the input images.predictions.shape, to verify that the network produces an output tensor of the expected shape after the forward pass.predictions.argmax(dim=1)[:5], to display the predicted digit for the first five images in the batch.
After stepping over the forward pass, these watches automatically update to display the model’s outputs. This makes it straightforward to verify that the input tensors have the expected dimensions, confirm that the network produces a prediction for each image in the batch, and inspect the predicted digit classes without modifying the source code.
The debugging workflow described in this section is demonstrated in this video:
Model evaluation
Training is done, but a low training loss does not necessarily mean your model is good. It might have simply memorized the training data. Evaluation on unseen test data tells you how well it actually generalizes. After five epochs of training, the model achieves a test accuracy of 96.87%, correctly classifying 9,687 out of 10,000 previously unseen digits.
This indicates that the model generalizes well to new data for a simple fully connected architecture without additional optimization techniques. It also demonstrates one of PyTorch’s biggest strengths in practice: You can go from raw data to a working, accurate model with relatively little code.
model.eval()
correct = 0
total = 0

with torch.no_grad():
   for images, labels in test_loader:
       predictions = model(images)
       _, predicted = torch.max(predictions, 1)
       total += labels.size(0)
       correct += (predicted == labels).sum().item()

accuracy = 100 * correct / total
print(f"Test Accuracy: {accuracy:.2f}%")
Advanced PyTorch techniques for deep learning
There are advanced PyTorch techniques that can be explored when you grasp building and training basic models. They can take your work further, for example by allowing you to train faster, scale larger, or move a model into production. Some of them include:
- GPU acceleration. One of the highest-impact changes you can make is moving your model and data to a GPU. Modern NVIDIA GPUs such as the A100, H100, and V100 are recommended to accelerate PyTorch with the greatest speedup. They offer exceptional performance, especially for features such as
torch.compile. - Distributed learning. When a single GPU is not enough – either because your model is too large or your dataset too vast – PyTorch’s
torch.distributedbackend lets you scale training across multiple GPUs or machines.DistributedDataParallel(DDP) enables distributed training across multiple GPUs or machines, significantly boosting compute power and reducing training time. When the capacity of a single GPU is exceeded by your model, DDP becomes essential and requires only a few additional lines of code to set up. - Model deployment. Training a model is just one key aspect; eventually, you need to deploy it to real users. TorchServe is a flexible and easy-to-use tool for serving Python models in production. It supports deploying models in either eager or graph mode using TorchScript, serving multiple models concurrently, versioning models for A/B testing, loading and unloading models dynamically, and monitoring detailed logs and customizable metrics.
These three techniques represent the natural progression of any advanced deep learning project. You start on a single machine, scale when needed, and ship when you are ready. They are worth exploring as your projects grow in ambition.
Summary and resources
In this tutorial, you went from understanding what PyTorch is to building and training a neural network that recognizes handwritten digits with over 96% accuracy. Also, we covered tensors, the torch.nn module, the training loop, and model evaluation, which are the core building blocks of every deep learning project built with PyTorch.
This is just the beginning. PyTorch’s real depth lies in what comes next – convolutional networks, transfer learning, and the vast Hugging Face ecosystem of pre-trained models, which run on a PyTorch backend, all built on the same foundations you learned here. Continue to experiment! Swap the optimizer, add a layer, and try a different dataset.
A great next step is to explore the official PyTorch tutorials, which cover everything from convolutional networks to deploying models in production. For a more structured learning path, the Zero to Mastery PyTorch course is free and beginner-friendly, picking up exactly where this tutorial ends.
Build your first PyTorch model in PyCharm
PyCharm gives you one environment for the full deep learning workflow: installing PyTorch, writing model code, running notebooks, debugging the training loop, inspecting tensors, tracking experiments, and managing your project with Git or Docker as it grows.
Download PyCharm for free and use this tutorial to build your first MNIST classifier.
About the author

Naa Ashiorkor
Naa Ashiorkor is a data scientist and tech community builder. She is deeply involved in the Python community and serves as an organizer for various conferences, including EuroPython. She is currently building PyLadies Tampere.
This is how we do it: ‘I could have sex every day, but he says no about 80% of the time’
Feed:
The Guardian
(https://www.theguardian.com/international/rss)
Published: 2026-07-26 10:00:08
|
Created: 2026-07-31 01:12:59
Will’s lack of self-worth is creating a barrier between him and Fi, but talking more could help them adjust to their mismatched libidos
• How do you do it? Share the story of your sex life, anonymously
I worry that Will sees me more as a mother figure than a sexual being
Continue reading...What’s the Status of Trump’s Anti-Weaponization ‘Slush’ Fund?
Feed:
TIME
(https://time.com/feed/)
Link:
https://time.com/article/2026/06/03/trump-doj-anti-weaponization-fund-j6-blanche-irs-tax-audit/
Published: 2026-06-03 09:05:22
|
Created: 2026-07-31 01:12:59

The Justice Department said it would cancel plans to create a $1.8 billion “anti-weaponization fund” that critics feared would have gone to loyalists of President Donald Trump.
On Tuesday, Acting Attorney General Todd Blanche testified that the DOJ would not move forward with plans for the fund, which was intended to compensate people who claimed to have been targeted by the “weaponization” of President Joe Biden’s government. It was the first time that an official publicly confirmed the DOJ would scrap the fund entirely after backlash from both Republicans and Democrats over concerns that it would serve as a “slush fund” for Trump’s allies and supporters, including those who participated in the Jan. 6, 2021, attack on the Capitol. Legal experts also said the fund lacked a clear legal basis, with no judicial review or congressional oversight.
“We are not moving forward with the fund, period,” Blanche told the House Appropriations subcommittee. In response to questions from Rep. Grace Meng (D, NY), Blanche confirmed that the DOJ planned to drop the plans forever.
The fund was part of a controversial settlement of Trump’s $10 billion civil lawsuit against the Internal Revenue Service over the 2019 leak of his tax returns by a former contractor.
After a federal judge temporarily blocked the fund last week, the DOJ said on Monday that it disagreed with the ruling but would abide by it.
Democrats and even some GOP lawmakers pushed to formally block the creation of the fund, but Senate Republicans narrowly voted down multiple efforts to strike it from a massive Trump-backed immigration enforcement package on Thursday.
An attempt, led by Democratic Leader Chuck Schumer, to amend the bill to codify Blanche’s promise failed 49-50. The vote extended for hours due to initial GOP holdouts.
Senators also rejected an effort by Sen. Thom Tillis (R, N.C.) to redirect the funding towards “fraud enforcement” at the DOJ, which Democrats said would still be a politicized use of taxpayer money.
“If Blanche says that this is largely inoperative, why not use this moment to codify that? Otherwise, you’re exposing every one of our members who are in cycle to having to deal with this between today and Election Day, and that makes no sense,” Tillis said before the vote. Tillis, who has bucked his party and opposed Trump on multiple occasions, said in June that he does not plan to run for reelection. Tillis refused to vote for the bill if it did not include language to permanently bar the fund.
The fund could face at least one other challenge from Sen. Bill Cassidy (R, La.), who said he intends to offer an amendment to ban payouts from the settlement. Cassidy lost his bid for reelection in the Republican primary last month to a Trump-endorsed challenger. Republican leaders told the Associated Press that amendments restricting the settlement could endanger the bill’s passage in the House, risking another legislative impasse like the stalled Homeland Security funding legislation that led to a partial government shutdown in March.
Concerns that the Administration might resuscitate the fund in future have grown since Blanche refused to formally renounce the fund.
Blanche told Meng on Tuesday that he was not “committing to putting anything in writing” to rescind, amend, or reissue the DOJ’s May 18 press release announcing the fund.
“I’m just concerned because you’re not under oath,” Meng said. “I want to trust you, and I want to believe you. We all do, but putting it in writing would settle that issue.”
“I don’t know what the purpose of putting something in writing. I’m telling you what we’re doing,” Blanche said.
The “reasons for the fund,” he added, “remain as important as they were before, but we are not moving forward with the fund.”
On Wednesday, Trump injected more uncertainty into whether the Administration might try to revive the fund in the future. The President told CNN that he’d “have to ask the lawyers” about whether its creation was scrapped entirely or just put on hold.
“As far as I’m concerned,” Trump said of the fund, “it was a beautiful thing.”
Bipartisan pushback against the fund
A bipartisan group of 35 former federal judges filed a motion in late May asking a federal judge in Miami to reopen the settlement case and review whether the fund was “a product of collusion and is itself a fraud on the court.” The settlement was not made public until after U.S. District Judge Kathleen Williams granted a voluntary dismissal of the case on May 18. On May 29, Williams launched an inquiry after receiving the third-party motion. The same day, a federal judge in Virginia, Leonie Brinkema, paused the creation of the fund.
Pushback against the fund from both Republicans and Democrats grew after Trump officials refused to rule out payments to Jan. 6 rioters who assaulted police officers. Vice President J.D. Vance said last month that the Administration would consider compensating Jan. 6 defendants on a “case-by-case basis.” Blanche had also said during a Senate Appropriations subcommittee hearing on May 19 that “anybody can apply” for compensation through the fund.
The Trump Administration has taken several steps towards absolving nearly 1,600 people who were criminally charged or convicted in relation to the Capitol attack. On the first day of his second term, Trump granted blanket clemency to nearly all individuals convicted of or charged with offenses related to the insurrection. Last month, the DOJ asked a federal appeals court to vacate seditious conspiracy convictions of the leaders and members of far-right groups, who had their prison sentences commuted by Trump’s move but did not receive full pardons. Also last month, the DOJ removed hundreds of news releases related to the prosecutions from its website.
The White House also published a page on its website describing defendants as “unfairly targeted, overcharged, and used as political examples” and characterizing the attack as a security failure by the Democrats. The page also repeated claims of a “fraud-ridden election,” which have been widely discredited.
The Trump Administration has also repeatedly accused the Biden Administration of “political weaponization” of federal agencies, including the Justice Department. Biden officials have denied the allegations. At the same time, Trump has urged the DOJ to investigate his perceived foes, including former Fed Chair Jerome Powell, New York Attorney General Letitia James, and Sen. Adam Schiff (D, Calif.). Those cases either did not result in charges or were dismissed. The DOJ also indicted former FBI Director James Comey in late April over a purported threat to Trump, after an earlier indictment of him was dismissed.
Republican opposition to the fund stalled progress on a $70 billion funding package for immigration enforcement agencies, which Democrats are universally opposed to.
After initially appearing to resist pushback last month, the DOJ said it would comply with the temporary pause on the fund, and reports suggested that the Administration was amenable to discarding the plans.
Still, several Republicans said they needed to hear a clear promise to abandon the fund before they would move forward with the bill. Senate Republican leaders are now pushing for a vote on the bill as soon as Wednesday, sources told CNN.
Protections from I.R.S. audits remains
The settlement also “forever barred” the I.R.S. from auditing past tax returns of Trump, his family members, or their companies. “Nothing has changed” in terms of those protections, Blanche said on Tuesday.
The tax term was scrutinized by Democrats at Tuesday’s hearing.
“What you’re doing on this is that you’ve taken one piece and you said, ‘Okay we have had a ton of backlash on this $1.8 billion slush fund, however, so we’ll not move on that,’ but as part of the settlement, which is this immunity for the President and his family and his business, etc. that stands,” Rep. Rosa DeLauro (D, Md.) said. “Simply put, you just gave the President and his family a tax immunity to the tune of about $100 million.”
Blanche defended the tax term, which had been included in an addendum to the DOJ’s announcement of the fund and not separately announced.
“It’s standard, it’s typical to get rid of past ongoing audits. It’s not a forward-looking document,” Blanche said. “It’s nothing that gives any sort of immunity in the future to the president or his family or his organizations.”
DeLauro, however, said the term exempted Trump “from any accountability.”
“If the President, his associates, and family members were innocent of whatever they were being investigated for, the investigation would surely bear that out,” she said. “But now we will never know.”
The Complete Package: Why Debugging Is Only Half the C# Productivity Story
Feed:
The JetBrains Blog
(https://blog.jetbrains.com/feed/)
Published: 2026-07-30 18:47:54
|
Created: 2026-07-31 01:12:59
As .NET developers, we need to iterate on our applications while building, and part of that developer inner loop is the debugging experience. The rise of multi-platform code editors further requires developers to have all the functionality they need to build and debug their application out of the box, wherever they’re coding. Previously, .NET developers could leverage the ReSharper extension for Visual Studio Code to build .NET applications, but they lacked a proper debugging experience. That changes now.
With the release of version 2026.2, our built-in .NET debugger is officially live, bringing the battle-tested debugging engine powering JetBrains Rider directly into VS Code and compatible environments. But as engineers, we know a fundamental truth: Debugging is a reactive process. While a robust debugger is essential for diagnosing a failing runtime state, relying on it as your primary tool for catching errors is incredibly inefficient. A highly productive workflow is proactive, leveraging static analysis and structural code intelligence tools to prevent bugs from being compiled in the first place. With the arrival of the debugger, we add to the already rich experience included in the extension. We now offer a completely unified, highly intelligent development ecosystem inside your lightweight editor. To learn more about the debugger and its capabilities, read the announcement blog post.
Let’s take a look at some of the other functionality that ReSharper for VS Code provides to accompany the new debugging experience. With ReSharper’s deep static code analysis, you transition from diagnosing runtime exceptions to catching logical inefficiencies in real-time. ReSharper provides over 2,500 inspections that analyze code as you type, underlining code smells or potential improvements before you hit compile.
Static analysis: Stop bugs before your debugger catch block
Let’s look at an everyday code block that compiles without any compiler errors, but contains a classic collection-lookup performance bug and an asynchronous anti-pattern.
The code smell: Redundant lookups and async void
Without deep static analysis, the following code compiles silently, only showing up as a memory allocation spike during heavy profiling:
public class UserService
{
    private readonly Dictionary<int, UserProfile> _profiles = new();
    // Issue 1: "Async void method will swallow exceptions at runtime"
    public async void UpdateProfileAsync(int userId, string bio)
    {
        // Issue 2: "Dictionary lookup can be simplified"
        // Calling .ContainsKey() followed by the indexer forces two lookups.
        if (_profiles.ContainsKey(userId))
        {
            var profile = _profiles[userId];
            profile.Bio = bio;
            await SaveToDatabaseAsync(profile);
        }
    }
    private Task SaveToDatabaseAsync(UserProfile p) => Task.CompletedTask;
}
This snippet exposes two common bugs:
- The async void exception trap: Declaring an asynchronous method as async void instead of async Task means unhandled exceptions cannot be caught by an awaiting caller. If
SaveToDatabaseAsync()fails, it will quietly crash the thread or surface as an unhandled background crash. - The double-lookup penalty: Checking
.ContainsKey()immediately followed by an indexer access_profiles[userId]forces the dictionary to hash and traverse the collection twice. In hot loops, this significantly degrades performance.
What ReSharper sees (and how it fixes it)
Instead of leaving you to encounter these problems during a stress test or a tricky debugging session, ReSharper highlights both issues inline. Hovering over the lines reveals the context, and pressing Ctrl+. (or Alt+Enter) brings up instant quick-fixes to optimize the logic instantly:
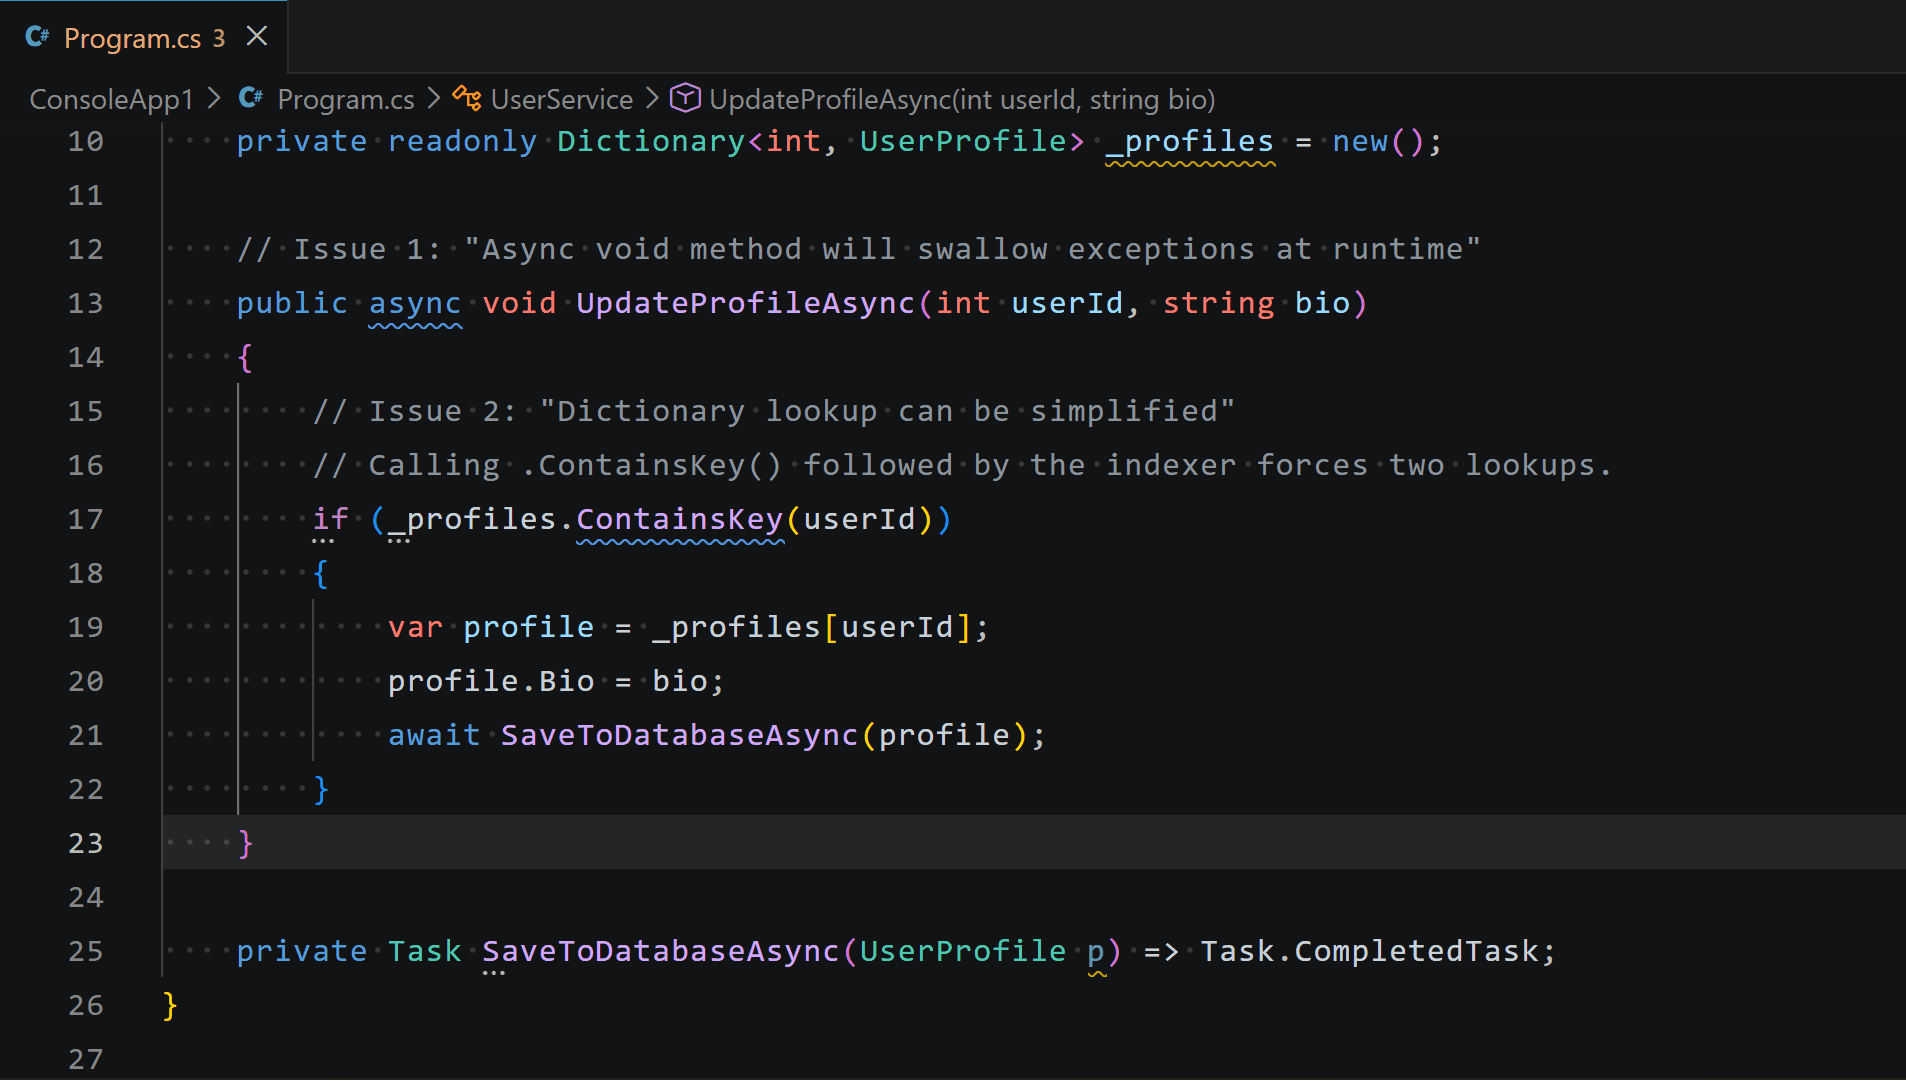
Global symbol renaming without the search-and-replace risk
Using a standard string-based search-and-replace to rename a core domain model or an API endpoint is incredibly risky. A simple find-and-replace often over-corrects by modifying unrelated strings, variable names, or third-party properties that happen to share the same text. Conversely, it can miss occurrences hidden inside documentation comments or string-based route templates.
ReSharper brings its compiler-grade Rename refactoring engine directly into your workspace, allowing you to globally update a symbol with complete semantic safety. The Rename refactoring also includes a conflict handler, meaning if you attempt to rename a symbol to a value that already exists somewhere in your codebase, ReSharper will show a conflict view where you can either accept or discard the change.
The technical scenario: Renaming a core contract/domain property
Imagine you are working on an e-commerce platform and the business requirements dictate changing the name of a core property on a public class – changing Sku to StockKeepingUnit.
This property is referenced across your entire solution: inside API route constraints, domain logic, data models, and miscellaneous strings like string variables, method or property names, documentation blocks, etc.
/// <summary>
/// Represents an item in the system. The <see cref="Sku"/> must be unique.
/// </summary>
public class ProductItem
{
    // You want to rename 'Sku' to 'StockKeepingUnit' here
    public string Sku { get; init; } = string.Empty;
}
// Elsewhere in a different file/project:
public class InventoryService
{
    public bool IsItemInStock(ProductItem item)
    {
        // Simple search-and-replace might miss or break this exact reference:
        if (string.IsNullOrWhiteSpace(item.Sku))
            throw new ArgumentException("Sku cannot be blank.");
        return CheckWarehouseStock(item.Sku);
    }
    private bool CheckWarehouseStock(string sku)
    {
       return !string.IsNullOrEmpty(sku); // Placeholder logic
    }
}
What ReSharper does (the semantic rename)
Instead of manually executing an imprecise global search across your projects:
- Place your cursor on the
Skuproperty name inside theProductItemclass. - Press the global refactoring shortcut: Ctrl+R, R (or F2).
- Type the new name: StockKeepingUnit.
ReSharper builds a structural map of your entire workspace. Instead of performing a dumb text sweep, it targets the symbol’s underlying references safely:
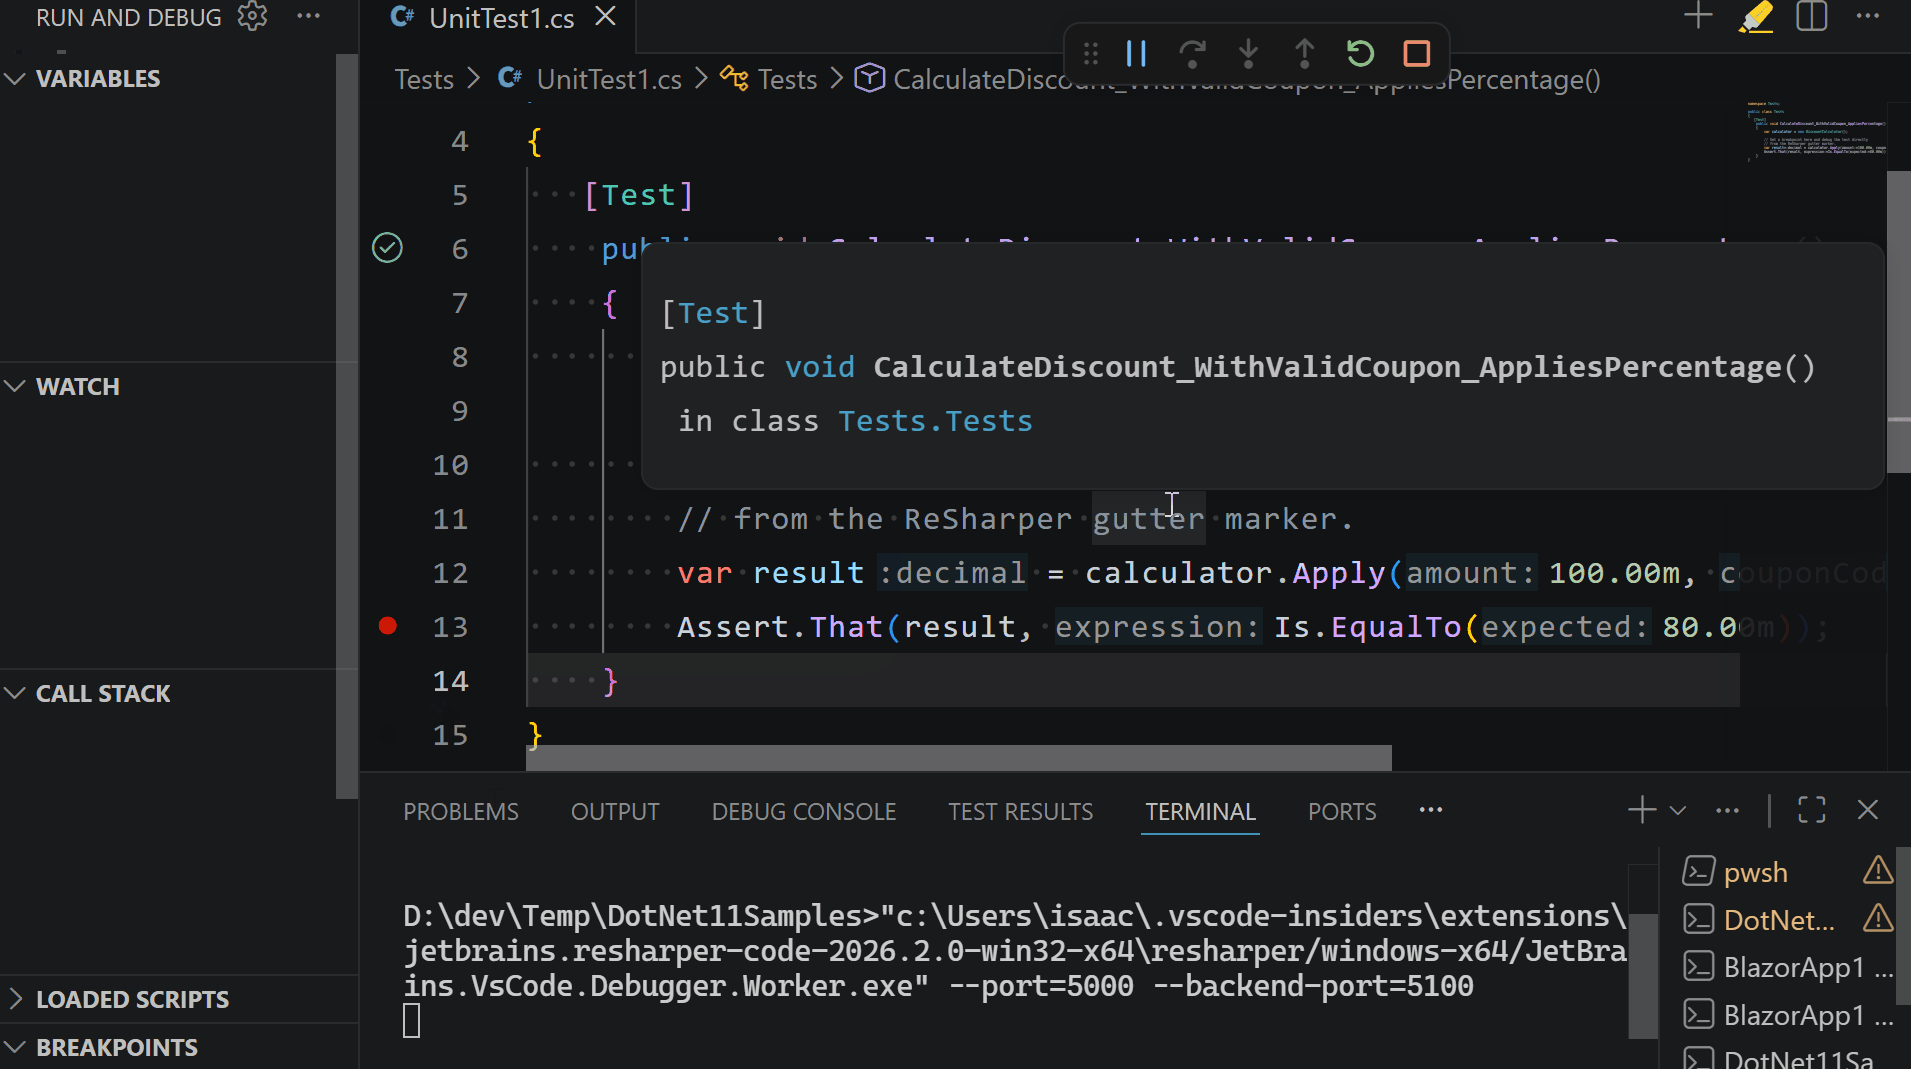
What it catches: ReSharper automatically updates the code references across all projects in the solution, updates the XML documentation tags (<see cref=''...''/>), and provides checkboxes allowing you to rename corresponding variables (like changing string sku to string stockKeepingUnit in local method signatures).
What it leaves alone: It safely ignores strings, comments, and third-party API payloads that happen to contain the characters “Sku” but are unrelated to your domain model’s property definition.
Quickly find what you are looking for
As .NET solutions scale, finding files and locating types can completely stall your momentum. ReSharper indexes your entire solution to provide lightning-fast keyboard shortcuts that let you jump to any file, class, interface, or specific member instantly.
| Key Shortcut | Action |
| Ctrl+T | Search Everywhere (Types, Symbols, Files) |
| Alt+\ | Navigate To popup (Quickly jump to methods/properties in the current file) |
| Shift+F12 | Find Usages (Deeply indexes every reference across all projects) |
Combined with our dedicated Solution Explorer view, navigating massive, multi-project workspace architectures is seamless and fast.
A unified .NET lifecycle
By bringing a native .NET debugger into this ecosystem, ReSharper completes the puzzle for professional .NET development inside your editor. You get static inspections, navigation, refactorings, unit testing, and now debugging, all integrated into a single, cohesive extension.
Ready to experience a complete, high-performance .NET development workflow? Installing it in Visual Studio Code takes less than a minute.
# Press Ctrl+P (or Cmd+P on macOS) to open the Command Palette in your editor and run:
ext install JetBrains.resharper-code
Coming up next…
Did you know that this extension works beyond Visual Studio Code? In our next post, we’ll take a look at some other .NET code editors that now benefit from our improved developer experience with ReSharper.
Share your thoughts!
We’d love to hear your feedback on how you’re getting on with ReSharper for Visual Studio Code. What do you like, what’s working for you, and what you’d like to see next. You can let us know in the issue tracker.
And if you’re enjoying ReSharper for Visual Studio Code, don’t forget to leave us a review on the marketplace. Your feedback helps other members of the .NET community make informed decisions and ensures that we continue to improve based on user needs.
- Visual Studio Code Marketplace
- Open VSX Registry (for Cursor, Google Antigravity IDE, Devin Desktop, Kiro, and other compatible editors)
Thank you for your support!
London's Mayor Sadiq Khan Played the Long Game on Climate. And It Worked
Feed:
TIME
(https://time.com/feed/)
Published: 2026-06-03 15:29:32
|
Created: 2026-07-31 01:12:59

Around the world, particularly in the U.S. and Europe, countries are in the middle of a climate reset. Right-wing politicians want to nix climate policy full stop. Their left and center-left counterparts are backtracking on promises for aggressive new policies under the assumption that climate is no longer popular—or perhaps that it never was.
Sadiq Khan, the London mayor who completed a decade in office last month, says his tenure offers a different lesson. His climate policy push has generated moments of significant blow back from right-leaning politicians and outspoken members of the public, leading political observers to cast green policies as all-but-inevitable instigators of climate backlash. And yet Khan survived and his policies did too. “There is a silent majority who aren’t keyboard warriors,” he told me in April.
Every country, province, and city has a different texture, but it’s a reminder that ditching climate entirely may not be necessary or wise in this moment of reassessment. “These policies, green policies, environmental policies, can be popular,” Khan says.
There was no greater backlash than in 2023 when Khan pushed through an expansion of the city’s Ultra Low Emissions Zone (ULEZ), a program that charges Londoners with vehicles that do not meet certain emissions standards for driving across the city. What was meant as a technocratic method of reducing air pollution and addressing climate change turned into a culture war focal point. Protesters tore down and disabled enforcement cameras and painted the policy as a civil liberties issue. Other opponents dismissed the air pollution science guiding the policy. “This new phenomenon… of disinformation, misinformation… gave a vocal minority massive airtime and gave people the impression this was an unpopular policy,” he says.
Calmer heads complained that the policy would increase the cost for commuters and small businesses that bring vehicles into the heart of London. The issue received wall-to-wall coverage. Watching from afar especially, it felt as though the effort had become a central political issue in Britain.
But the reality was more complicated. A poll conducted the year after implementation, around the time of the 2024 mayoral election showed that voters ranked the issue ninth on a list of priorities.
In Khan’s telling, a lot was on the line when he was up for reelection in 2024. Leaders in other cities that were in various stages of considering a similar policy—including New York and Milan—were watching closely. Defeat might have signaled a political cost not just to pollution charges specifically but to climate policy more broadly. He won with an even greater share of the vote than in the previous election.
Khan, who serves as the co-chair of C40 cities, a group of cities committed to climate action, explains his climate policy success in part by focusing much of his public message on kitchen table issues rather than climate specifically. He explained ULEZ as a health matter rather than a climate measure. (Indeed, air pollution in many cities including London is a silent killer). “People don’t talk about climate change, climate emergency, environment… What they do know is the young child’s been diagnosed with asthma,” he says. “What they do know is, in winter, bills keep on going up.”
And he has sought to connect clean energy with affordability and cost savings at a time when constituents in London and voters around the world are concerned with the rising cost of living, particularly energy. “The reason why we're suffering a cost of living crisis is we're relying upon fossil fuels from overseas,” he told me.
It’s hard to map the particular policy approaches and particular rhetoric in London onto other cities—in the U.S. or elsewhere. Every city has its own characteristics. Driving is more entrenched in most U.S. cities. Pollution concerns are top of mind across much of Asia but less so in many advanced economies where the most dangerous pollutants tend to be less visible. And, of course, climate policy provokes a unique set of responses in the U.S.
But Khan’s tenure is a reminder that climate policy that actually improves people’s lives can be popular, or at the very least durable, if only it’s given the opportunity to settle in.
This story is supported by a partnership with Outrider Foundation and Journalism Funding Partners. TIME is solely responsible for the content.
Beerlao: probably the most important lager in the world
Feed:
Latest Updates
(https://www.economist.com/latest/rss.xml)
Link:
https://www.economist.com/asia/2026/07/30/beerlao-probably-the-most-important-lager-in-the-world
Published: 2026-07-30 13:02:21
|
Created: 2026-07-31 01:12:59
Its country’s economy depends on it
show more
Book returned to Australian library – 150 years overdue
Feed:
World news | The Guardian
(https://www.theguardian.com/world/rss)
Published: 2026-07-30 10:59:19
|
Created: 2026-07-31 01:12:59
The book, Antiquities of Athens, was handed back to Kiama library by a man who found it bricked into a wall
An Australian public library has had a book returned an estimated 150 years late after being found behind a wall during a home renovation.
The book, Antiquities of Athens, published in 1858, was returned to the library in the seaside town of Kiama, south of Sydney, by a man who had found it inside a tea crate bricked into a sealed fireplace
Continue reading...Icac revelations have left Angus Taylor’s colleagues anxious – and his factional enemies angry
Feed:
World news | The Guardian
(https://www.theguardian.com/world/rss)
Published: 2026-07-30 15:00:17
|
Created: 2026-07-31 01:12:59
The opposition leader is the highest-profile person mentioned so far at the NSW anti-corruption commission – and the political figure with the most to lose
Get our breaking news email, free app or daily news podcast
After the opening days of an inquiry exposing a dark underbelly of the New South Wales Liberals, the prevailing mood among Angus Taylor’s colleagues is one of apprehension.
The federal opposition leader is not a specific target of Operation Rosny, which is investigating allegations of corruption against people associated with the NSW branch. He is not accused of wrongdoing.
Continue reading...
Page 596 of 1019 (50947 total items)
Recent Feeds
The Guardian
PBS News Hour - The Latest
NBC News Top Stories
Все публикации подряд на Хабре
Home - CBSNews.com
Stack Overflow Blog
BBC News
World
World news | The Guardian
BBC News
BBC Russian
TIME
WIRED
TechCrunch
Vox
The Latest News from the UK and Around the World | Sky News
NPR Topics: News
NYT > Top Stories
World & Nation
Latest Updates